0563
Intra- and inter-session reliability of lumbar spinal cord resting-state fMRI1Vanderbilt University Institute of Imaging Science, Vanderbilt University Medical Center, Nashville, TN, United States, 2Radiology & Radiological Sciences, Vanderbilt University Medical Center, Nashville, TN, United States, 3Biomedical Engineering, Vanderbilt University Medical Center, Nashville, TN, United States
Synopsis
Keywords: Spinal Cord, fMRI (resting state)
We investigated the intra- and inter-session reliability of functional connectivity indices derived from resting-state fMRI in the lumbar spinal cord. Slicewise and average indices of connectivity for the ventral and dorsal networks were collected across three experiments in healthy participants at 3T. Intra-session reliability was high for back-to-back scans (ICC>0.9), and moderate-to-good when introducing repositioning, surveying and reshimming (COV=3-25%). Repeatability of indices across separate visits was low, although similar grey matter functional networks could be independently observed and showed high spatial overlap using ICA, a data-driven approach. This is the first evaluation of resting-state fMRI reliability in the lumbar cord.Introduction
The resting-state fMRI (rs-fMRI) features of the lumbar spinal cord have been recently described by our group1 and others2. In this study, we examine for the first time the intra- and inter-session reliability of functional connectivity measures in the lumbar cord via three experiments in healthy participants at 3T.Methods
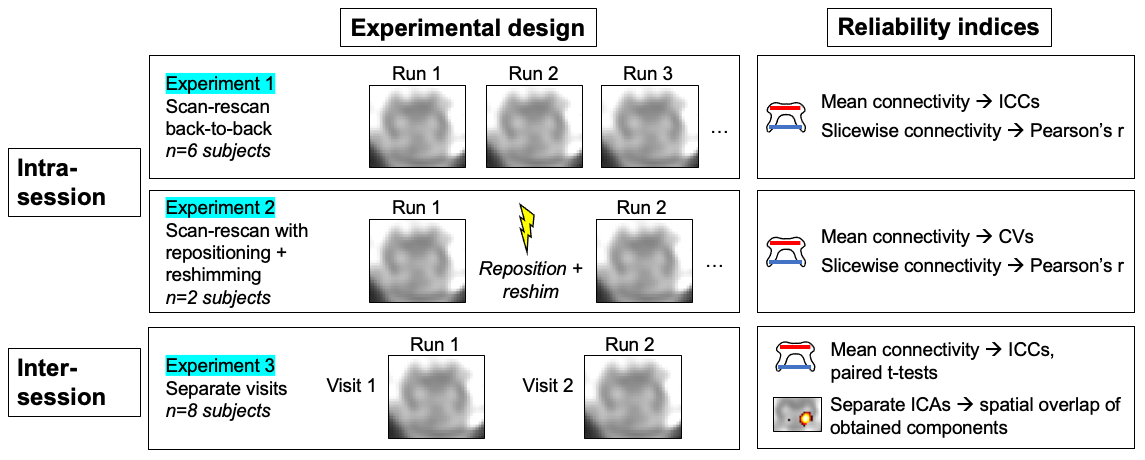
All participants (n=16, ages 22-54, 8M/8F) gave informed consent. Data were acquired on a 3T Philips dStream Ingenia MR scanner with 2-channel transmit and a dStream total spine coil combined with an integrated 12-channel posterior coil for reception. FMRI used a 3D axial multi-shot gradient echo sequence: volume acquisition time=2.6s, TE=20ms, α=8°, FOV=110x101mm2, 14 slices centered at the lumbar enlargement, acquired voxel size 1.1x1.1x10mm3 (reconstructed 0.43x0.43x5mm3), 200 dynamics, EPI factor=9, saturation pulse for fat suppression: 'ProSet 1331'. Three experiments were performed to assess intra- (with and without repositioning/reshimming) and inter-session reliability, described in Fig. 1. The processing pipeline was described previously1 and included motion correction using SCT v4.0.23, denoising with AFNI-RETROICOR, and band-pass filtering at 0.01-0.10Hz. Functional connectivity indices (Pearson’s r) were computed for the ventral and dorsal networks slicewise, and averaged across slices. Further experiment-specific details are below.Experiment 1. Six participants were scanned 3-4 times back-to-back. Data were co-registered within-subject and the same regions of interest (ROIs) were used for all runs.
Experiment 2. Two participants were scanned 3 times consecutively. Between scans, they were instructed to “wiggle and change position”, sagittal and coronal surveys were conducted for repositioning, and reshimming was performed. Datasets were co-registered within-subject and processed using the same ROIs.
Experiment 3. Eight participants were scanned on two separate occasions (time between visits: 4±2 months). For initial ROI-based analysis, all datasets were processed independently. For Independent Component Analysis (ICA), all runs were registered to a good quality target, and truncated to 6 central slices. Spatial ICA (GIFT toolbox v3.0b154, Matlab R2018b) used the ‘Infomax’ algorithm, a preset of 40 components, and a cord mask. ICA-derived components were thresholded at z>3 and binarized. Dice coefficients were computed for all component pairs between visits and used to identify each component’s best match by spatial overlap. Matched component pairs were visually inspected.
Results
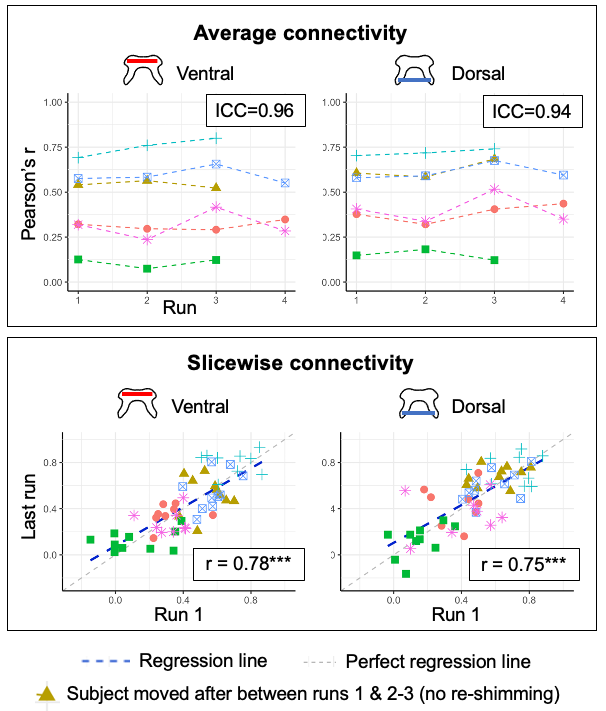
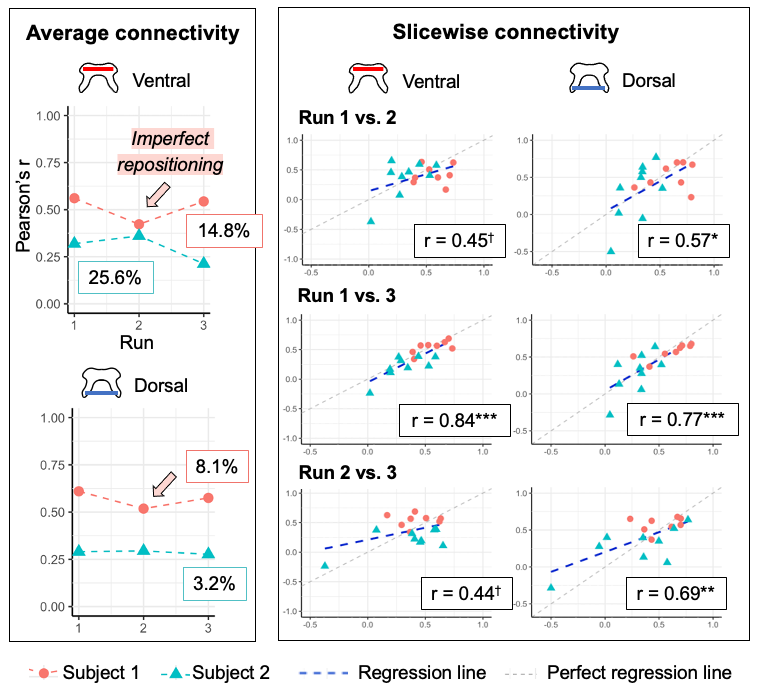
Experiment 1 (Fig. 2). Cord-average measures showed high stability across scans, and ICCs were excellent (ventral = 0.96, dorsal = 0.94). Slicewise indices showed high correlation between the first and last runs (Pearson’s r > 0.75).Experiment 2 (Fig. 3). Reliability of cord-average connectivity indices was moderate, with between-scans CVs ranging from 3.2%-25.6%, although differentiation between subjects was good. Reliability of slicewise indices was moderate to good (Pearson’s r: ventral network 0.44-0.84, dorsal: 0.57-0.69). Note one subject had imperfect FOV repositioning for one run, which may explain the deviation in this scan’s values, and the highest correlations being obtained between the other two runs (‘Run 1 vs. 3’).
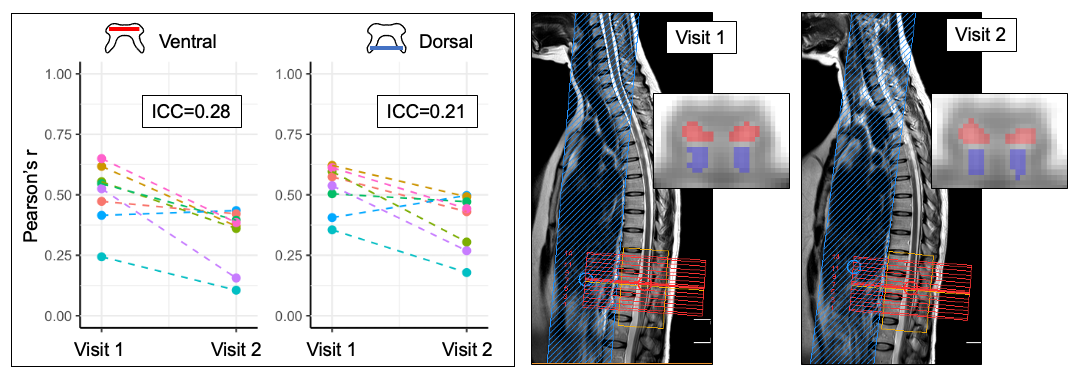
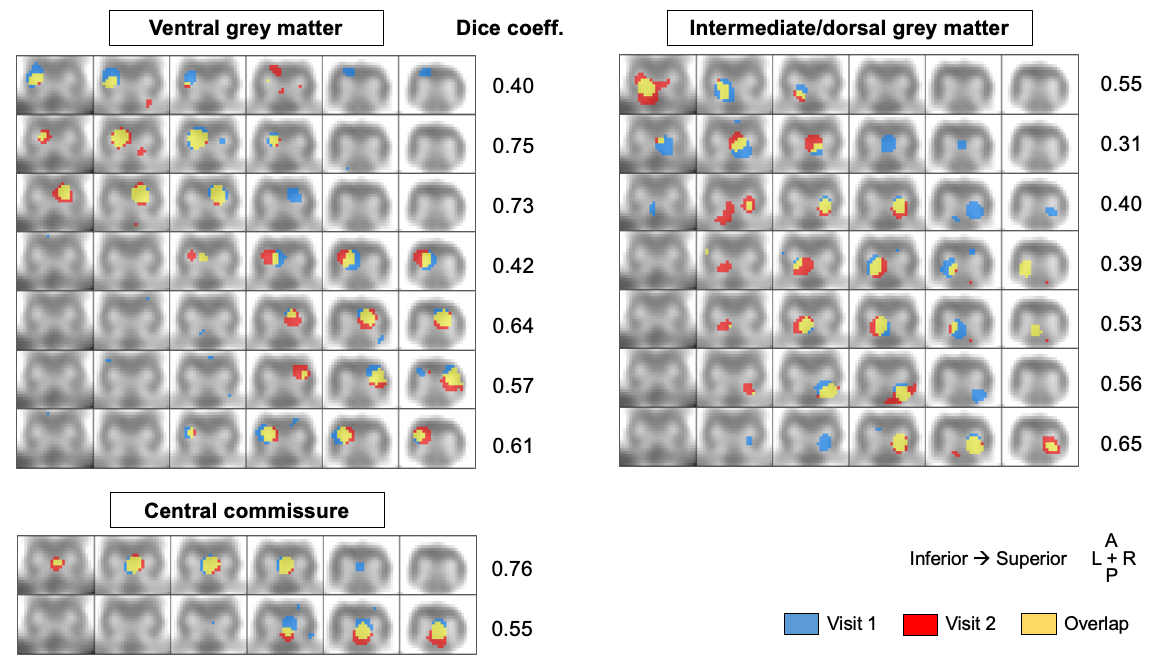
Experiment 3 (Fig. 4). ICCs between the two visits were low (ventral = 0.28, dorsal = 0.21). There was a significant decrease in measured connectivity between visits (ventral network: p<.01, dorsal: p<0.05), although temporal SNR was similar (visit 1 = 17.9±3.1, visit 2 = 19.2±4.1, p>.05). ICA post-processing yielded 52 matched component pairs, distributed as follows: grey matter (GM) = 16, white matter = 21, noise-related = 15. Average Dice coefficients of the GM components were: ventral = 0.59 (n=7), central commissure = 0.66 (n=2), intermediate/dorsal = 0.47 (n=7). Overlapping GM components are shown in Fig. 5.
Discussion
Reliability was high in back-to-back scans, and good when consecutive scans were preceded by repositioning and reshimming. These results begin to establish the stability of rs-fMRI measures within-session, supporting its use for experimental designs where a stimulus (e.g. administering pain) or condition (e.g. bladder-filling) may be manipulated between or during successive scans. When performing repeat scans with repositioning, careful planning is recommended in all planes to optimize the capture of identical anatomical regions. A future experiment will include participants moving out of the scanner and introduce a delay to examine the effect of potential experimental interventions.In Experiment 3, inter-session reliability of ROI-based indices was low. Repeatability of rs-fMRI is notoriously difficult to achieve due to both instrumentation noise and intrinsic instability of neuronal fluctuations over time. Methodologically, inter-subject variance was incidentally lower than for other experiments, partly contributing to low ICCs. Within-subject co-registration and use of the same ROIs may improve reliability, as done for Experiments 1 and 2, which will be done in future work. Despite this, ICA revealed similar group-level GM components between visits, suggesting that functional networks can be probed with consistent success despite variability in ROI-based indices. Further strategies for improving inter-session reliability will also be explored: i) better inter-session registration for alignment of dorsal regions to facilitate their detection with ICA, ii) improving the component-matching routine by removing noise components from consideration, iii) quantifying the reliability of functional connectivity indices obtained from subject-level ICA components.
Conclusion
We found high intra-session reliability, and propose analysis strategies for improving inter-session repeatability. This work forms a basis for future scan-rescan experiments and longitudinal studies using lumbar rs-fMRI.Acknowledgements
The authors thank all study participants and the VUIIS MRI technologists. This work was supported by the National Institutes of Health under award numbers KL2TR002245 (K.P.O.), K01EB030039 (K.P.O.), and 5R01NS109114 (S.A.S.).
References
1. Combes AJE, Sengupta A, Rogers BP, Houston D, Prock L, Bagnato F, McKnight CD, Gore JC, Smith SA, O'Grady KP. Detection of resting-state functional connectivity networks in the human lumbar spinal cord at 3T. ISMRM 2022.
2. Ricchi I, Kinany N, Van De Ville D. Resting-state fMRI of lumbar spine: static and dynamic functional connectivity. OHBM 2022.
3. De Leener B, Lévy S, Dupont SM, Fonov VS, Stikov N, Collins DL, Callot V, Cohen-Adad J. SCT: Spinal Cord Toolbox, an open-source software for processing spinal cord MRI data. Neuroimage. 2017 Jan 15;145:24-43.
4. GIFT: Calhoun, Vince D., et al. "A method for making group inferences from functional MRI data using independent component analysis." Human brain mapping 14.3 (2001): 140-151.
Figures