0561
Sliding-Window Dynamic Functional Connectivity Of Resting-State Spinal Cord fMRI Reveals Specific Interaction Patterns1Electrical and Electronics Engineering, Bogazici University, Istanbul, Turkey, 2Neuro-X Institute, Ecole Polytechnique Fédérale de Lausanne (EPFL), Geneva, Switzerland, 3Department of Radiology and Medical Informatics, University of Geneva, Geneva, Switzerland
Synopsis
Keywords: Spinal Cord, fMRI (resting state)
In recent years, while the exploration of spontaneous brain activity has shifted from static methods (i.e., examining average connectivity patterns over the entire run) towards dynamic approaches (i.e., accounting for the non-stationarity of resting-state fluctuations), the non-stationary nature of intrinsic activity in the spinal cord has seldom been studied. Here, we propose to probe time-varying functional connectivity patterns in the spinal cord using a sliding-window correlation approach, as commonly employed in the brain. Our results suggest the potential of this approach to unravel ventral-ventral and dorsal-dorsal correlation patterns, while also emphasizing their time-varying nature.Introduction
Resting-state functional magnetic resonance imaging (fMRI) has become a prominent tool for understanding the large-scale organization of the central nervous system (CNS). Although the assumption that functional networks are stable over the duration of scanning sessions prevailed in early studies 1,2, the time-varying nature of the brain’s functional connectivity has been underlined in recent years3. Yet, despite this increased interest in investigating the dynamics of spontaneous brain activity, only one study has been published on the dynamics of functional connectivity in the spinal cord4. To further extend these investigations, the current study aims to uncover the temporal dynamics of spinal resting-state functional connectivity patterns using a popular method of dynamic functional connectivity analysis: sliding window correlation.Methods
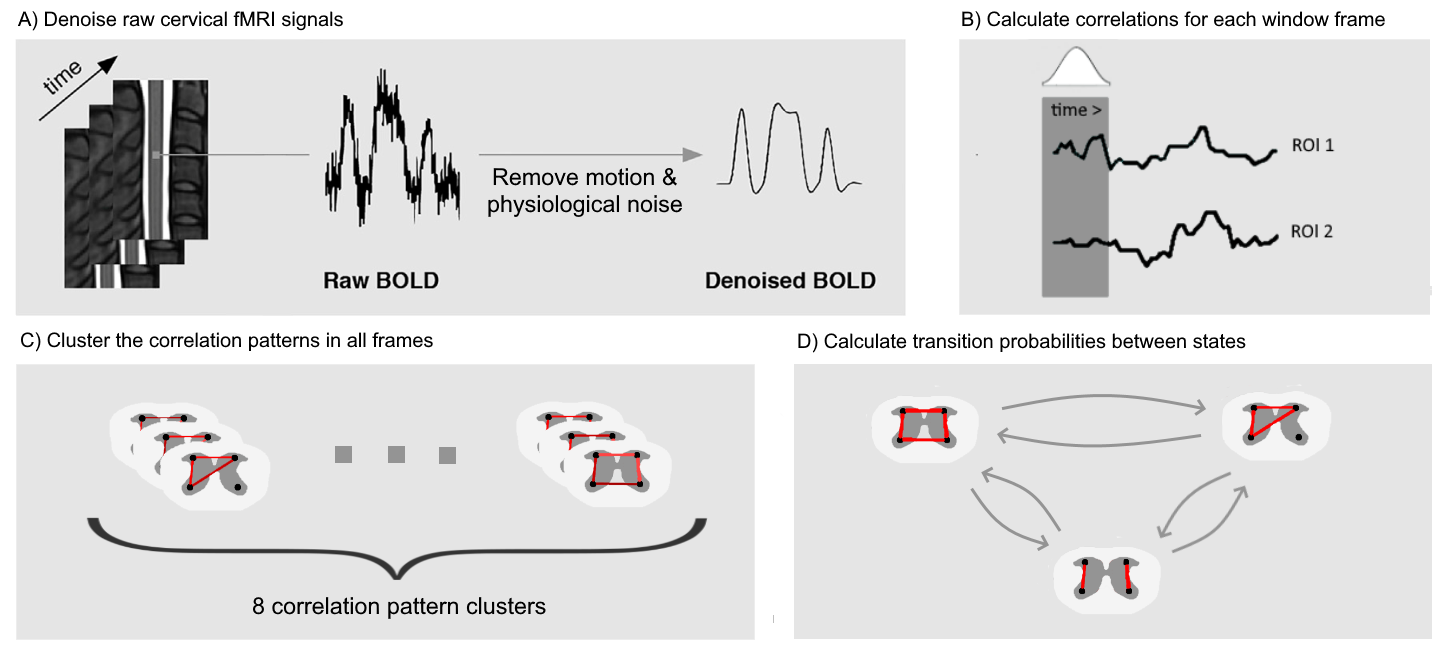
19 right-handed healthy subjects (10 females, 28.5 ± 3.1 years old) , acquired in the framework of an earlier study3, were included in the study. Cervical fMRI was performed with a T2*-weighted gradient-echo EPI sequence using ZOOMit selective field-of-view imaging (Siemens Prisma, 3 Tesla, TR = 2500 ms, TE = 34 ms, resolution = 1x1x3 mm). A total of 360 volumes (15 minutes) were acquired for each volunteer. Data processing included slice-wise motion correction and denoising (physiological noise and motion regression), which were conducted using the Oxford Center for fMRI of the Brain’s (FMRIB) Software Library (FSL, version 5.0)5 and the Spinal Cord Toolbox (SCT, version 3.2.7)6. The data were also temporally filtered with a band-pass range from 0.01 Hz to 0.13 Hz.In the proposed sliding window correlation method (Figure 1), fMRI signals of a region comprising spinal levels C5 to C7 were considered. Regions of interest (ROIs) were then defined according to the neuroanatomical subdivisions of the spinal cord, resulting in four ROIs spanning these three spinal levels: left ventral horn, right ventral horn, left dorsal horn, right dorsal horn. Pearson correlation coefficients were calculated between each pair of ROIs over sliding windows and the values were Fisher transformed. In line with recent brain literature, we opted for a Hamming window with a length of 50 s (20 volumes) and a stride of one volume. Using these parameters, 340 correlation matrices were obtained for each of the 19 subjects and K-means clustering was thus applied to a total of 6460 correlation matrices in order to uncover the dominant correlation patterns. Clustering stability was inspected for various numbers of clusters using the Silhouette method7 and a subdivision in 8 clusters appeared to be most stable. Average correlation matrices were computed for each cluster (Figure 2). Finally, transition probabilities between clusters were calculated to investigate the dynamics of connectivity changes (Figure 3). All statistical tests were conducted using non-parametric permutation tests with 1000 permutations.
Results
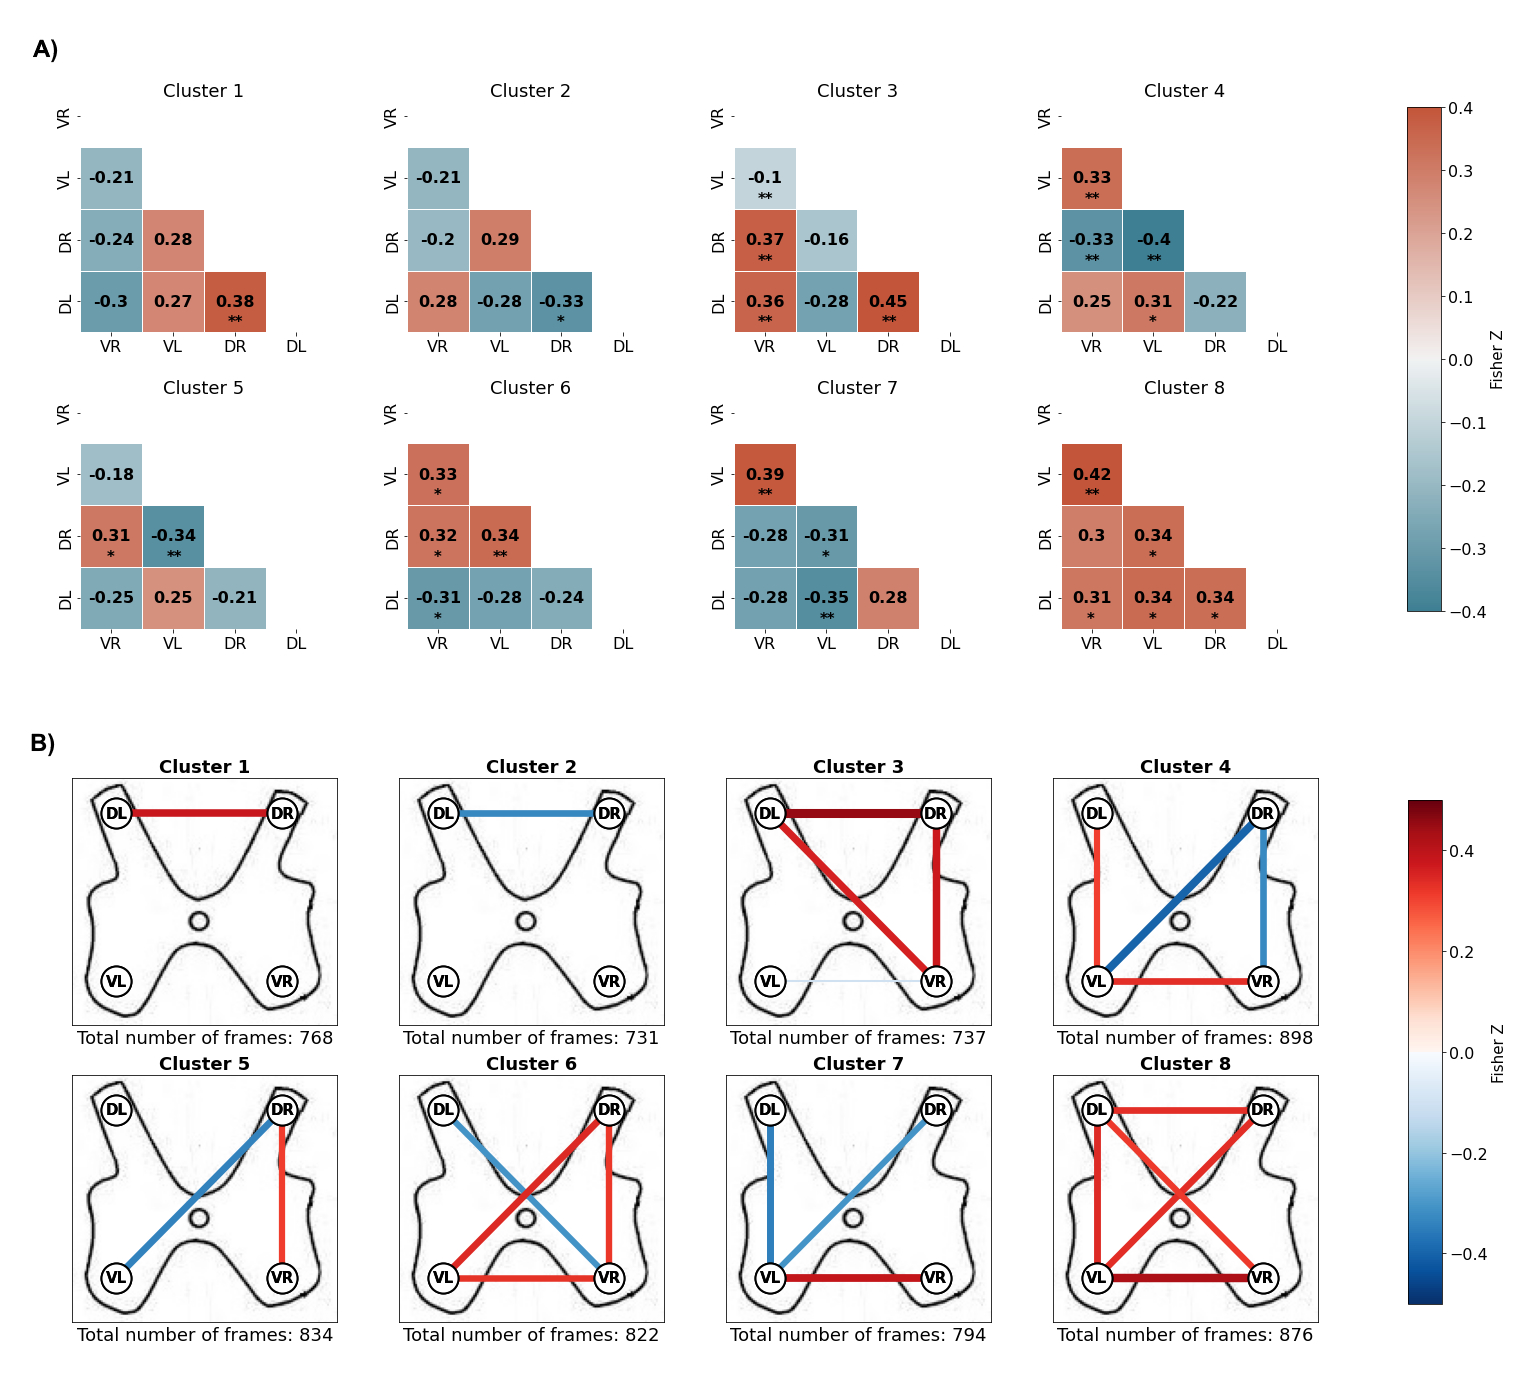
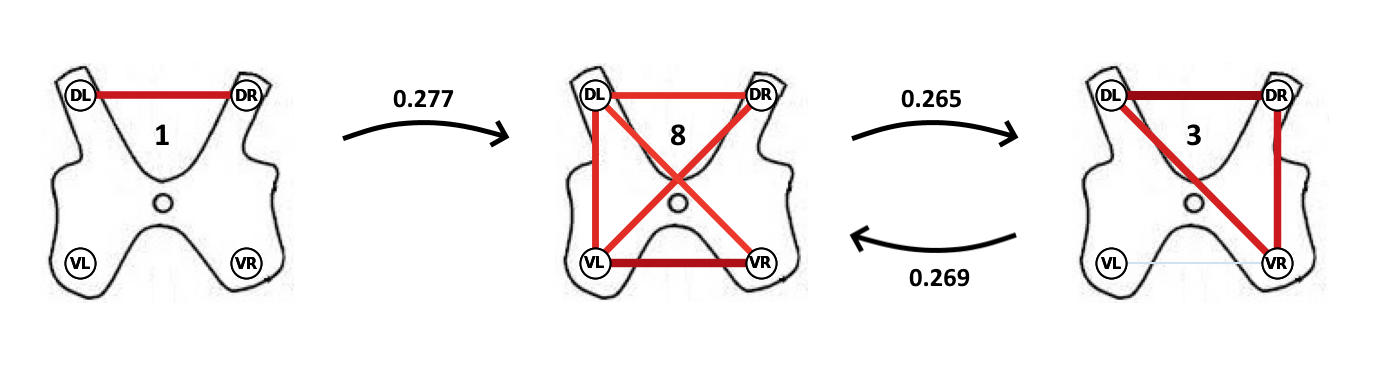
The 8 clusters corresponded to distinct connectivity patterns, including both positive and negative correlations (Figure 2). In line with static results 1,2, they notably comprised interhemicord dorsal (clusters 1, 3 and 6) and ventral (clusters 4, 6, 7 and 8) connections. Of note, dorsal and ventral horns respectively contain sensory and motor neurons. These different configurations were observed in subject-specific cluster distributions with average dwell times ranging from 4.98 to 6.39 seconds and fractional occupancies ranging from 9.3% to 16.4%. Interestingly, our analyses highlighted a number of transitions between clusters that were statistically significant (Figure 3). In particular, transitions between cluster 8, which indicates the state of widespread functional connectivity with the ventral-ventral connection as its highest correlation, and cluster 3, which presents dorsal-dorsal correlation with a positively correlated right ventral component, displayed a significantly higher occurrence. Additionally, cluster 1, which represents the state of dorsal-dorsal correlation exclusively, also experienced a statistically significant transition into cluster 8.Conclusion and Discussion
In this study, we estimated the dominant correlation patterns in spontaneous spinal cord signals acquired with fMRI, by deploying sliding window correlations and k-means clustering. The rich temporal dynamics of these patterns were observed, underscoring how distinct connectivity patterns underlied spinal cord intrinsic activity. Our findings notably revealed ventral-ventral (i.e. motor) and dorsal-dorsal (i.e., sensory) correlation patterns, which is consistent with results derived from static approaches 1,2, while also underscoring their time-varying properties. In particular, the interhemicord dorsal network appeared to dynamically connect to the right ventral horn, possibly reflecting processes related to hand dominance. Future work will build on these results to provide a more in-depth (e.g., level-dependent, between-level, etc.) description of these dynamics and further explore their physiological relevance.Acknowledgements
No acknowledgement found.References
1. Barry RL, Smith SA, Dula AN, Gore JC. Resting state functional connectivity in the human spinal cord. eLife. 2014;3:e02812.
2. Kong Y, Eippert F, Beckmann CF, Andersson J, Finsterbusch J, Büchel C, et al. Intrinsically organized resting state networks in the human spinal cord. Proceedings of the National Academy of Sciences. 2014;111(50):18067-72.
3. Preti MG, Bolton TAW, Van De Ville D. The dynamic functional connectome: State-of-the-art and perspectives. NeuroImage. 2017;160:41-54.
4. Kinany N, Pirondini E, Micera S, Van De Ville D. Dynamic Functional Connectivity of Resting-State Spinal Cord fMRI Reveals Fine-Grained Intrinsic Architecture. Neuron. 2020;108(3):424-35.e4.
5. Jenkinson M, Beckmann CF, Behrens TEJ, Woolrich MW, Smith SM. FSL. NeuroImage. 2012;62(2):782-90.
6. De Leener B, Lévy S, Dupont SM, Fonov VS, Stikov N, Louis Collins D, et al. SCT: Spinal Cord Toolbox, an open-source software for processing spinal cord MRI data. NeuroImage. 2017;145:24-43.
7. Rousseeuw PJ. Silhouettes: A graphical aid to the interpretation and validation of cluster analysis. Journal of Computational and Applied Mathematics. 1987;20:53-65.
Figures