0554
Self-Gated Cardiac Phase-Contrast Balanced SSFP at 0.55T
Charles McGrath1, Oliver Bieri2,3, Sebastian Kozerke1, and Grzegorz Bauman2,3
1University and ETH Zurich, Zurich, Switzerland, 2Division of Radiological Physics, Department of Radiology, University Hospital Basel, Basel, Switzerland, 3Department of Biomedical Engineering, University of Basel, Basel, Switzerland
1University and ETH Zurich, Zurich, Switzerland, 2Division of Radiological Physics, Department of Radiology, University Hospital Basel, Basel, Switzerland, 3Department of Biomedical Engineering, University of Basel, Basel, Switzerland
Synopsis
Keywords: Flow, Low-Field MRI
Free-running radial phase-contrast balanced steady-state free precession (PC-bSSFP) imaging including slice-select gradient inversion and respiratory and cardiac self-gating enables robust through-plane flow quantification in the aorta with excellent image signal-to-noise ratio (SNR) and contrast on a low-cost low-field 0.55T scanner. Relative to phase-contrast spoiled gradient echo (PC-GRE), PC-bSSFP offers SNR improvements by a factor of about two.
Keywords: Flow, Low-Field, Balanced SSFP, Phase-Contrast, Self-gated
Introduction
Balanced steady-state free precession (bSSFP) is the workhorse for cardiac cine imaging given its intrinsically high signal-to-noise ratio (SNR) efficiency and the exquisite contrast between blood and muscle1. While insufficient shimming and specific absorption rate limits can compromise bSSFP performance at higher field strengths2 the application of bSSFP at fields < 1T is particularly attractive as it allows to offset some of the intrinsic SNR loss at lower field by leveraging shorter T1 relaxation times, higher flip angles and reduced field inhomogeneity3,4.The objective of the present work was to combine a) cardiac/respiratory self-gating based on continuous radial scanning with b) bSSFP through-plane gradient inversion5 for phase-contrast (PC) flow measurements in the aorta on a low-cost 0.55T MR-system. For reference, a spoiled gradient echo (GRE) variant6 of the sequence was used to compare SNR and flow values.
Methods
A free-running7 radial PC-bSSFP scheme with tiny Golden angle increments8 was implemented on a 0.55T system (MAGNETOM Free.Max , Siemens Healthineers, Germany) with low-performance gradients (26mT/ m amplitude, 45 T/m/s slew rate). Half-way through the sequence the slice-select gradients and corresponding pre- and re-winders were inverted along with inverting the sign of the frequency offset of the radiofrequency pulses. Each sequence partition was preceded by a number of ramp-up cycles to approach steady state. The encoding velocity was calculated according to:$$V_{enc}=\frac{\pi}{2\gamma{M_1}},$$
where $$$M_1$$$ denotes the first moment of the non-inverted slice select gradient. To adjust $$$V_{enc}$$$, user parameters were introduced allowing to adjust the radiofrequency bandwidth and hence the slice-select gradient strength as well as the duration of the plateau of the slice-select gradient and, consequently, the area of pre- and rewinders. A sequence diagram can be seen in Figure 1a.
Five healthy subjects were scanned upon written informed consent following institutional and ethics guidelines. On each volunteer , four scans were performed i.e. free-breathing PC-bSSFP/PC-GRE and breathhold PC-bSSFP/PC-GRE . Neither ECG nor breathing belts were used. Scan parameters are summarized in Figure 1b-c. Transverse slices were positioned perpendicular to the ascending aorta to measure through-plane flow.
Reconstruction was performed with BART9, using the pics function. Coil sensitivities were estimated based on a direct NUFFT reconstruction of the time-averaged dataset. Total generalized variation (TGV) regularization was applied along time (binning dimension). The regularization weight was chosen such that the peak flow velocity in the ascending aorta did not deviate by more than 5% from the unregularized velocity. Thereby velocity estimation errors were balanced against residual radial under sampling artifacts in both magnitude and phase.
Results and Discussion
Reconstructed breath hold data for one subject are shown in Figure 2, comparing PC-SSFP and PC-GRE for both magnitude and velocity. Due to the low field of 0.55T and the relatively short TR, off-resonance bands are well outside the chest. Residual “flickering” in magnitude and phase relates to the reduced regularization in reconstruction to avoid excessive temporal filtering of the phase.Velocity and SNR curves for all 5 volunteers are shown in Figure 3, comparing PC-bSSFP and PC-GRE scans. A good agreement of velocity between PC-SSFP and PC-GRE was found (RMSE = 7.8cm/s) in agreement with previous findings5,10. SNR curves show in-flow dependence. Overall PC-bSSFP outperforms PC-GRE in SNR by approximately a factor of 2 (108+/-21 vs. 51+/-12).
Figure 4 compares velocity and SNR data as a function of respiratory phase for one volunteer. Difference in chest expansion as a function of the respiratory phase are noted. Velocity curves show good agreement for all five respiratory phases (mean difference -1.5+/-6.9cm/s).
A cropped image-wise comparison of all scans can be seen in Figure 5 for one volunteer. Here, velocities less than 10 cm/s (~7% of $$$V_{enc}$$$) are shown as gray and low signal regions are masked out. Difference between breath-hold and free-breathing PC-bSSFP acquisitions are associated in parts with residual jitter in assigning cardiac phases based on the k-space center signal.
Conclusion
Free-running self-gated radial bSSFP incorporating through-plane gradient inversion permits aortic flow measurements on low-cost low-field MR-systems providing both sufficient SNR and velocity quantification.Acknowledgements
References
- Bieri O, Scheffler K. Fundamentals of balanced steady state free precession MRI. J. Magn. Reson. Imaging 2013;38:2–11 doi: 10.1002/jmri.24163.
- Schär M, Kozerke S, Fischer SE, Boesiger P. Cardiac SSFP Imaging at 3 Tesla. Magn. Reson. Med. 2004;51:799–806 doi: 10.1002/mrm.20024.
- Bandettini WP, Shanbhag SM, Mancini C, et al. Evaluation of Myocardial Infarction by Cardiovascular Magnetic Resonance at 0.55-T Compared to 1.5-T. JACC Cardiovasc. Imaging 2021;14:1866–1868 doi: 10.1016/j.jcmg.2021.02.024.
- Campbell-washburn AE, Ramasawmy R, Restivo MC. Opportunities in Interventional and Diagnostic Imaging by Using High-performance Low-Field-Strength MRI. Radiology 2019:2–11.
- Markl M, Alley MT, Pelc NJ. Balanced phase-contrast steady-state free precession (PC-SSFP): A novel technique for velocity encoding by gradient inversion. Magn. Reson. Med. 2003;49:945–952 doi: 10.1002/mrm.10451.
- Roeloffs V, Voit D, Frahm J. Spoiling without additional gradients: Radial FLASH MRI with randomized radiofrequency phases. Magn. Reson. Med. 2016;75:2094–2099 doi: 10.1002/mrm.25809.
- Ma LE, Yerly J, Piccini D, et al. 5d flow mri: A fully self-gated, free-running framework for cardiac and respiratory motion–resolved 3d hemodynamics. Radiol. Cardiothorac. Imaging 2020;2 doi: 10.1148/ryct.2020200219.
- Wundrak S, Paul J, Ulrici J, et al. Golden ratio sparse MRI using tiny golden angles. Magn. Reson. Med. 2016;75:2372–2378 doi: 10.1002/mrm.25831.
- Uecker M, Ong F, Tamir JI, et al. Berkeley Advanced Reconstruction Tools. Proc. Intl. Soc. Mag. Reson. Med. 2015;23:2486.
- Grinstead J, Sinha S. In-plane velocity encoding with coherent steady-state imaging. Magn. Reson. Med. 2005;54:138–145 doi: 10.1002/mrm.20526.
Figures
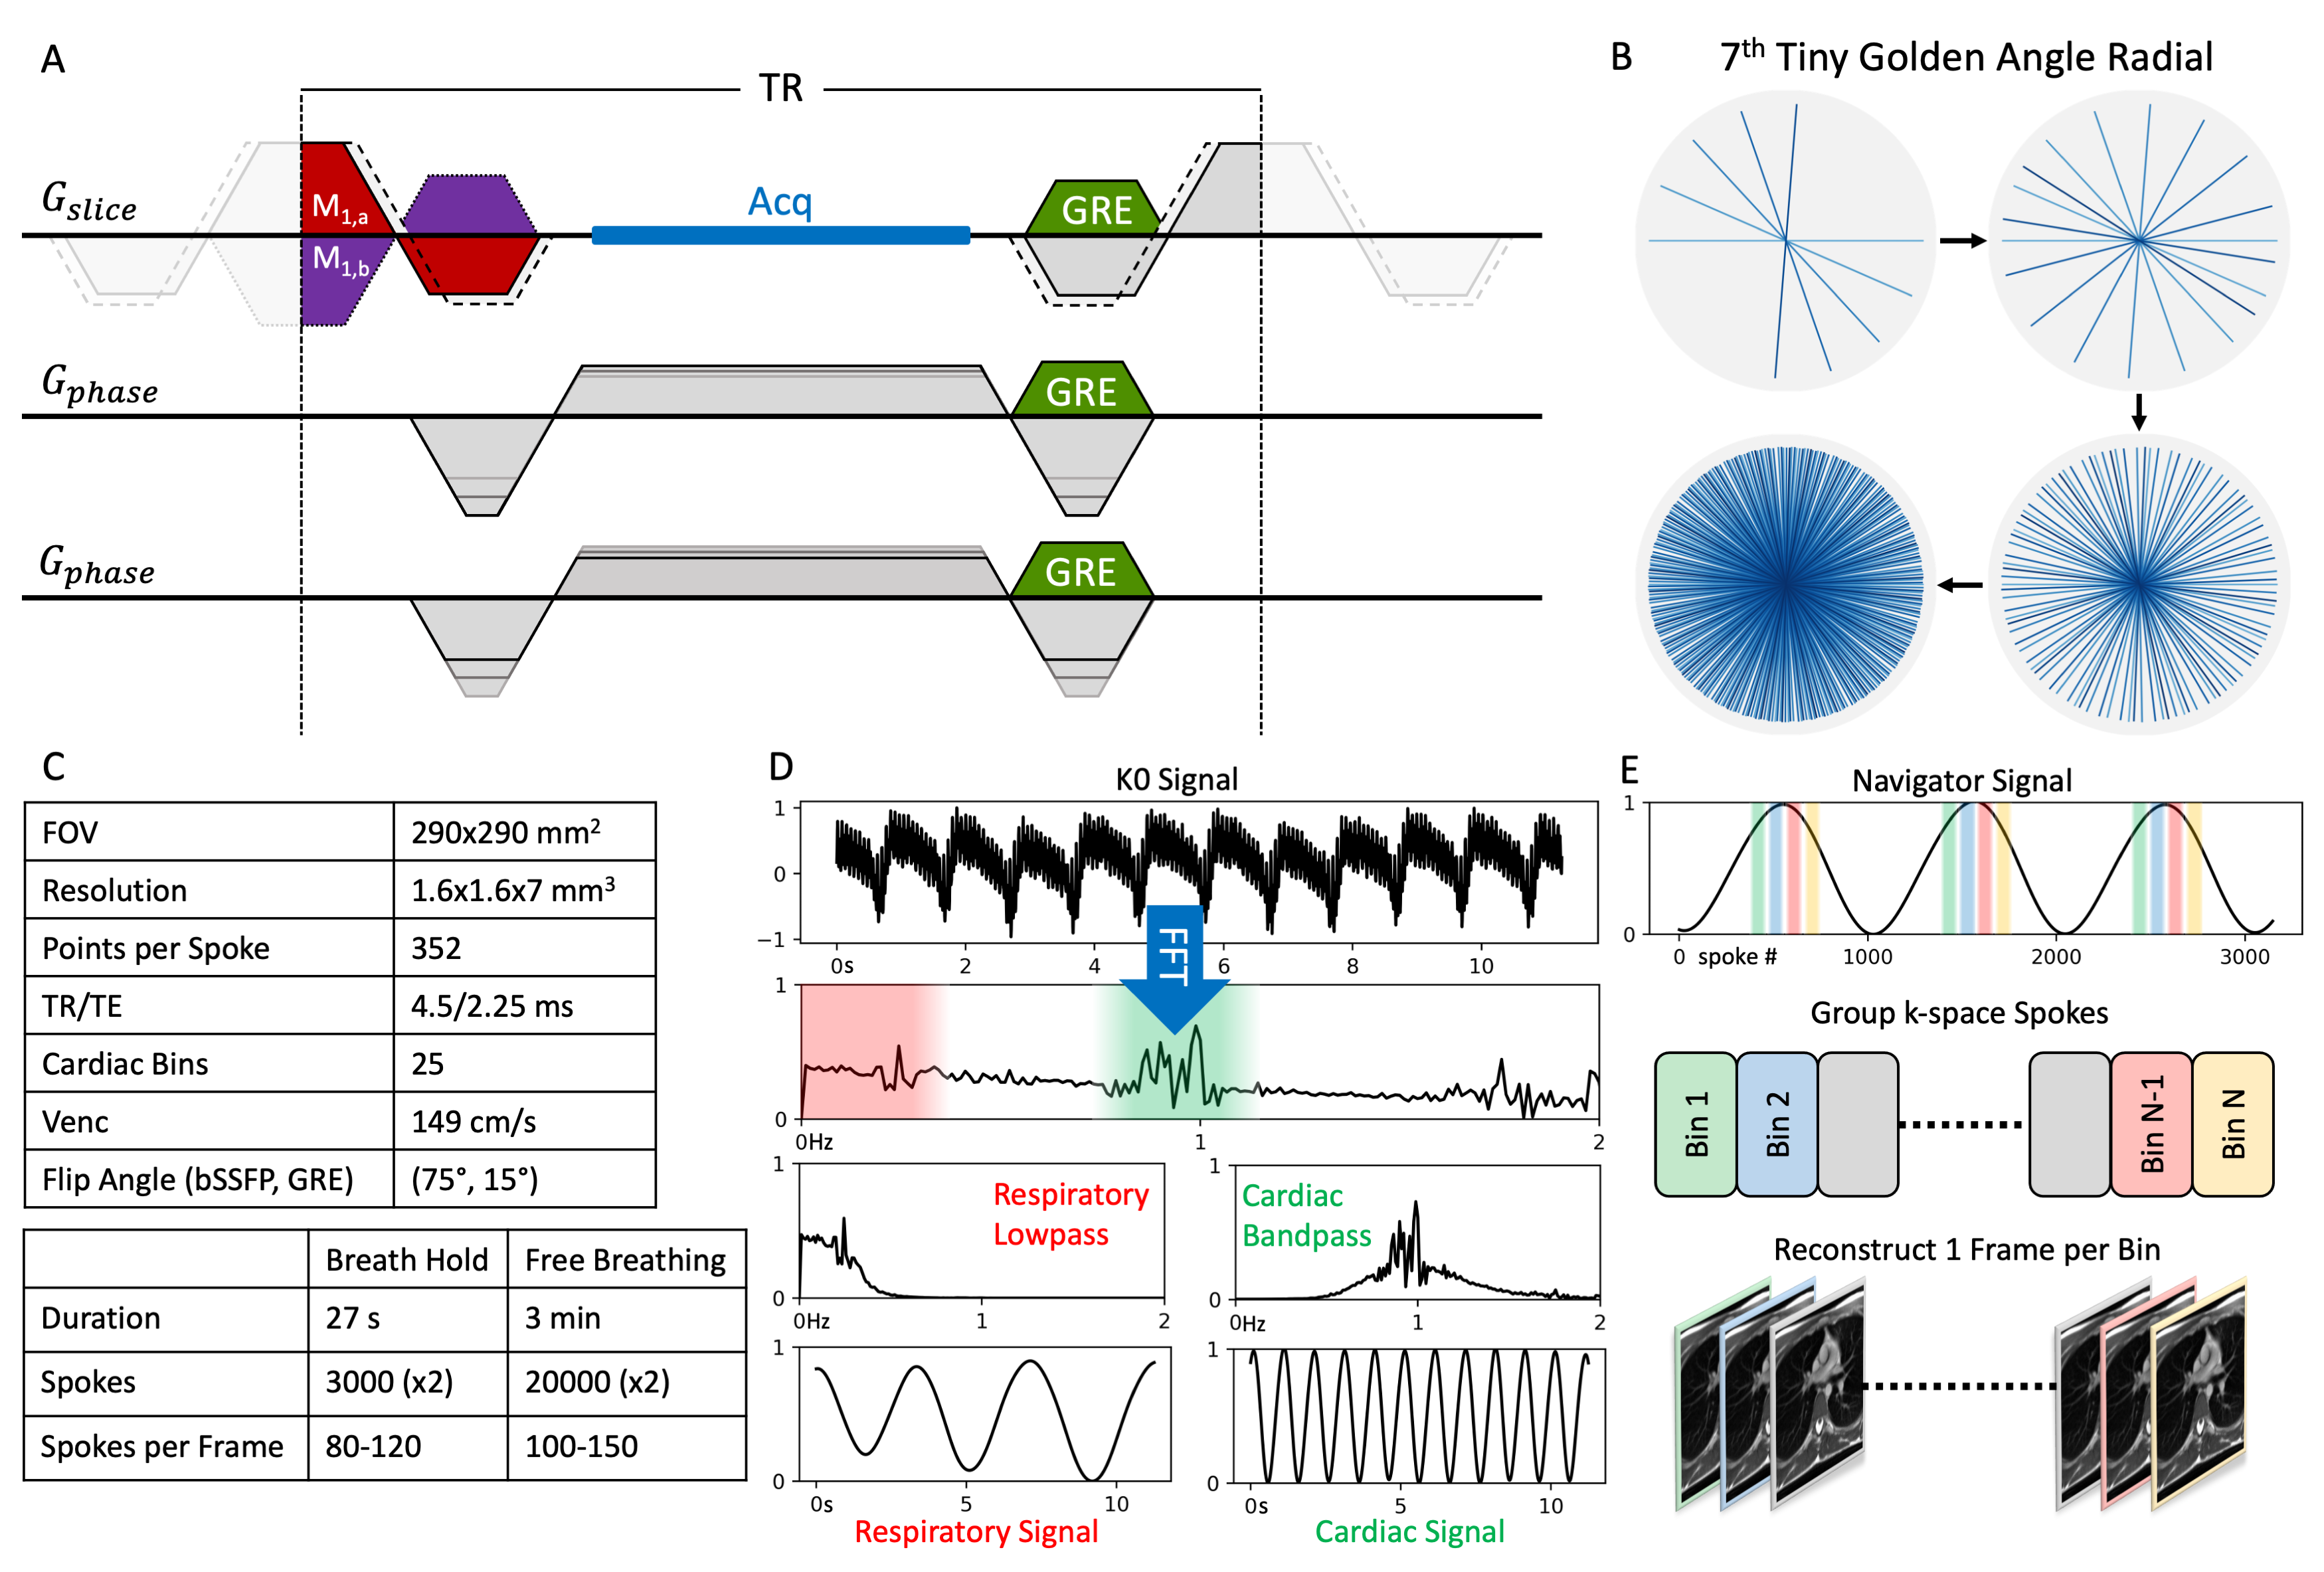
Figure 1: A - Sequence diagram for one repetition time (TR) of a radial PC-bSSFP sequence. Gradient related changes for GRE are shown in green. The velocity encoding portion of the slice-select gradient is given in red/purple for the standard/inverted gradients. Dotted lines show the extension of the slice-select gradient to decrease $$$V_{enc}$$$. B - Example 7th tiny golden angle radial k-space sampling. C - Tables of sequence parameters. D - Process for extracting respiratory/cardiac navigator signals from k-space center (K0 Signal). E - Depiction of navigator based binning.
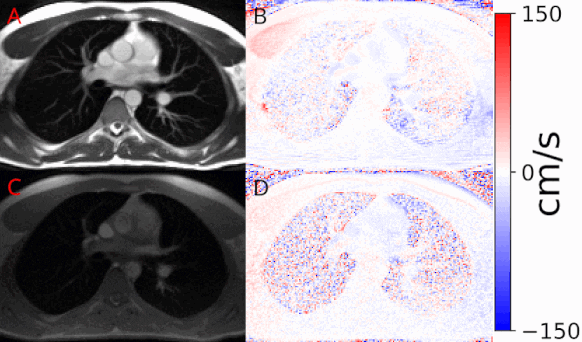
Figure 2: (GIF) Example reconstructed images for PC-bSSFP (magnitude A, velocity B) and PC-GRE (magnitude C, velocity D). Magnitude images are scaled to the same value to demonstrate increased signal intensity and reduced noise associated with PC-bSSFP.
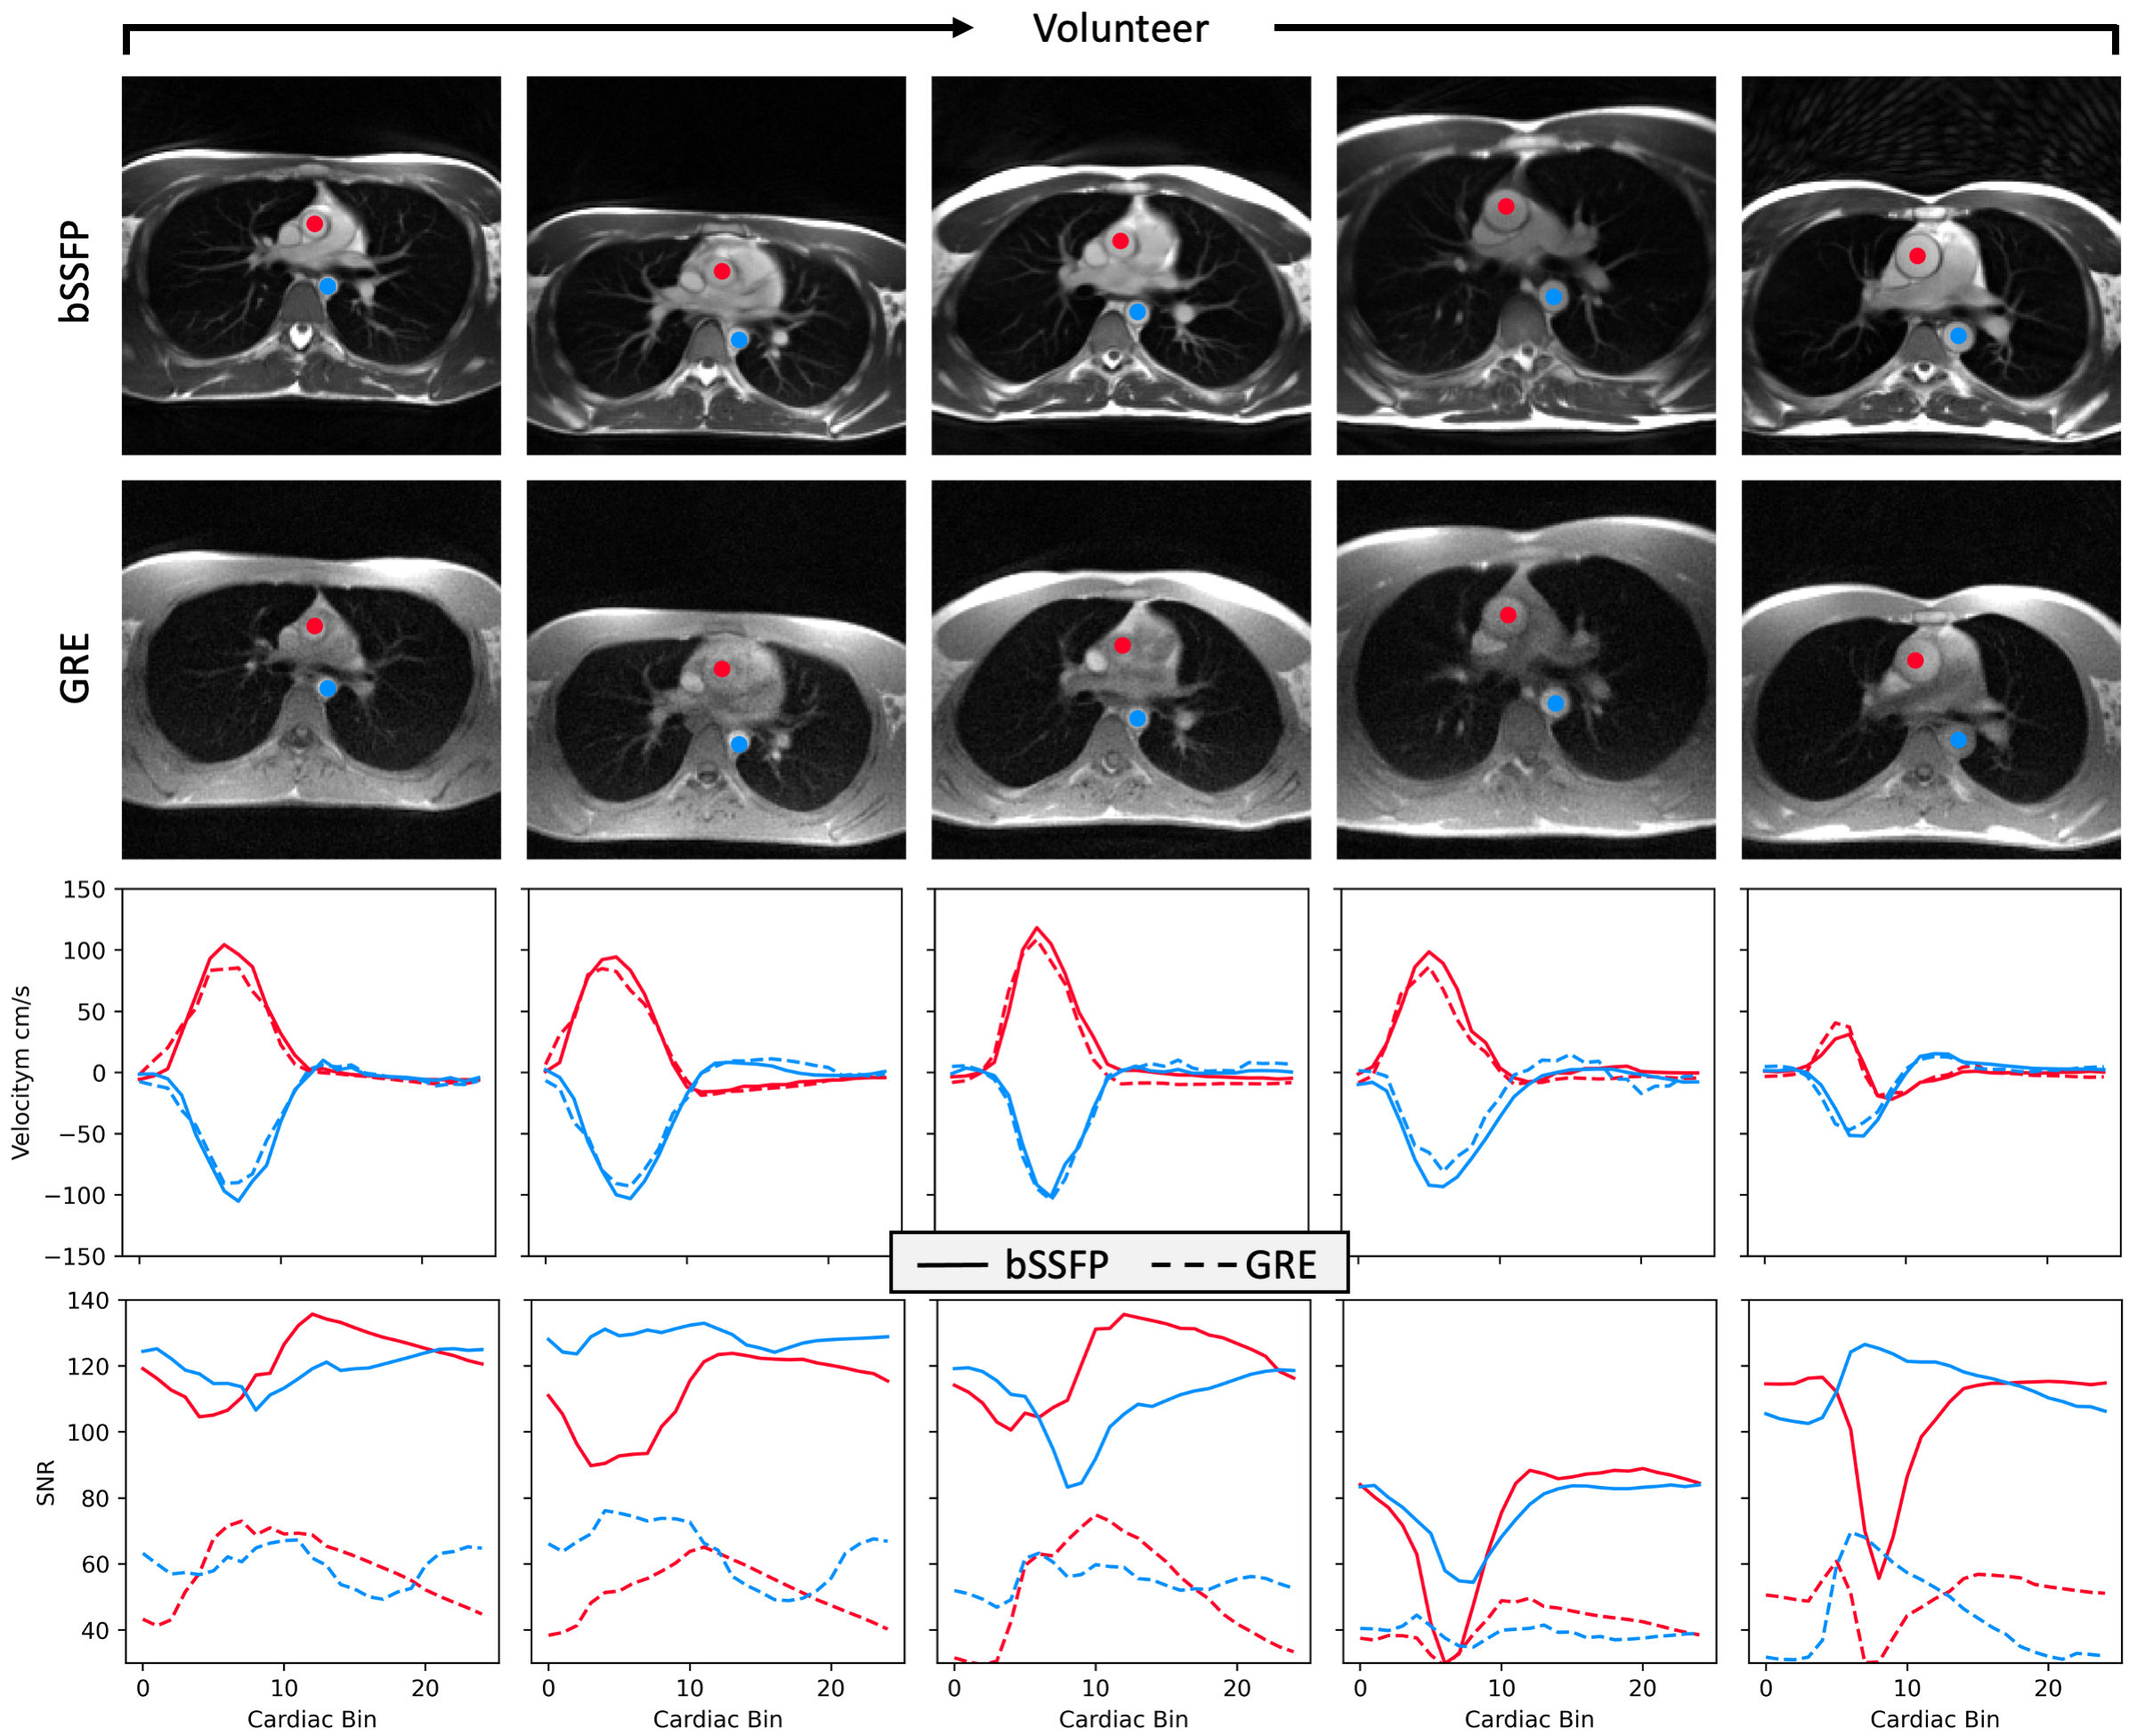
Figure 3: Comparison of PC-bSSFP and PC-GRE for 5 volunteers. Curves show SNR and average velocity for the ascending aorta (red) and descending aorta (blue). Magnitude images for PC-GRE are scaled by 2 to match intensities of PC-bSSFP. Velocity curves show good agreement between PC-bSSFP and PC-GRE, while SNR curves show PC-bSSFP outperforming PC-GRE by a factor of approximately 2. Additionally, in-flow contrast for PC-GRE and in-flow related signal loss for PC-bSSFP is evident.
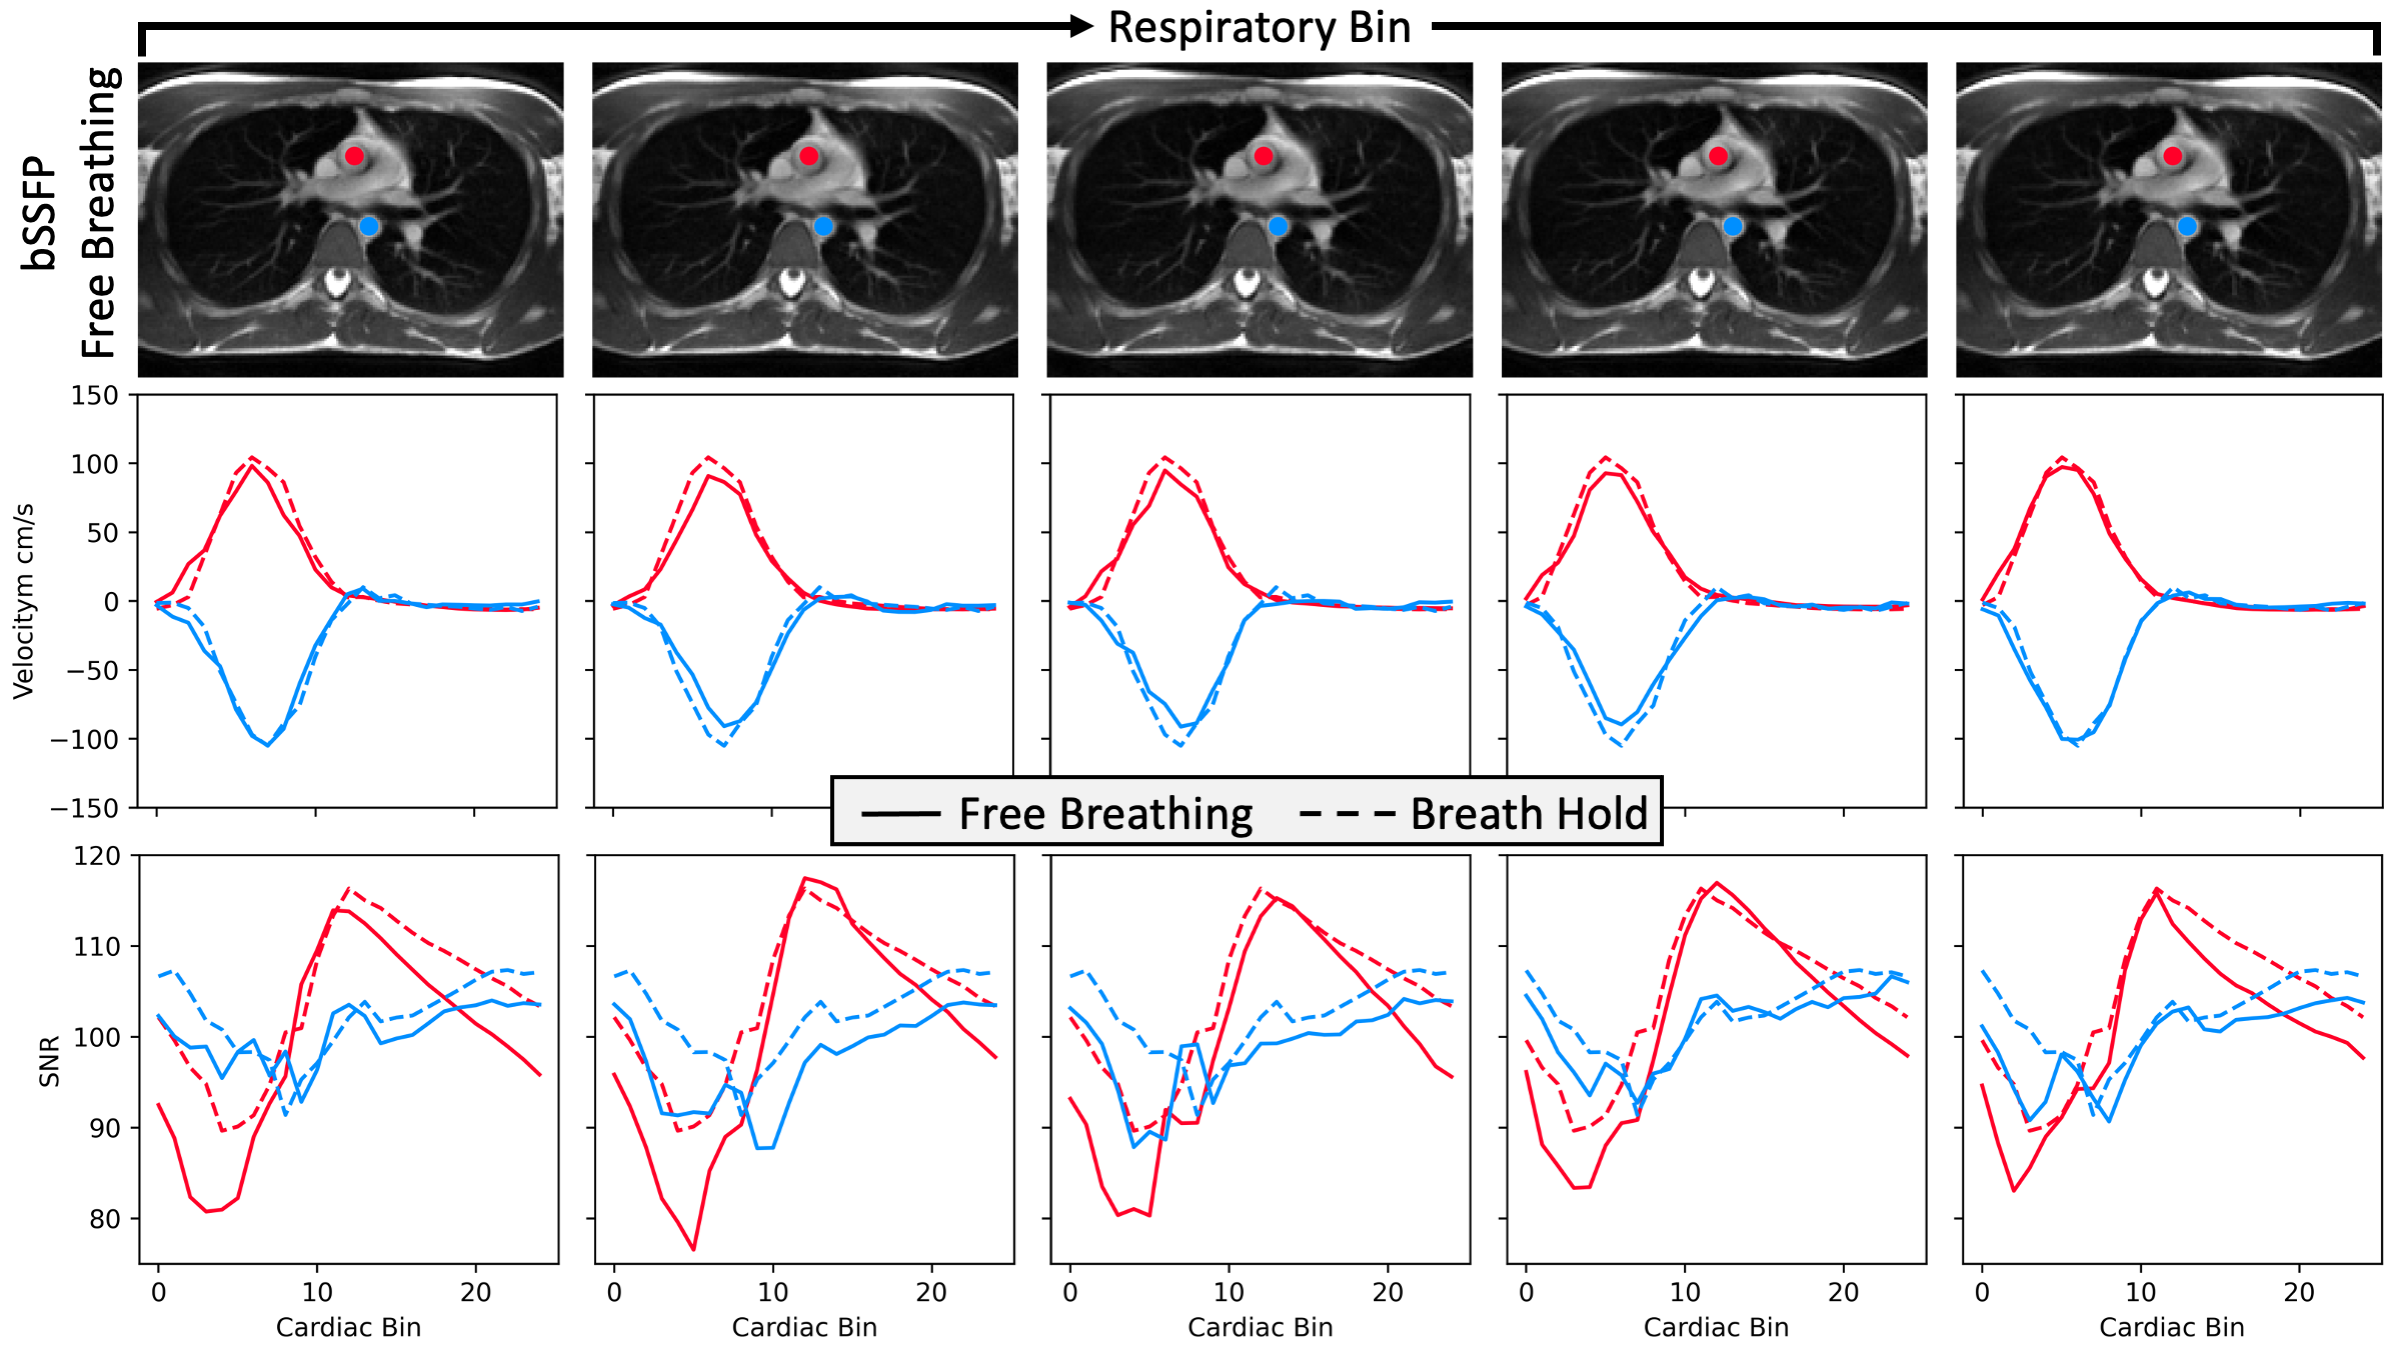
Figure 4: Comparison of free-breathing with breath-hold PC-bSSFP images for one volunteer. Columns are the five respiratory phases used in reconstruction. Curves show SNR and velocities for ascending aorta (red) and descending aorta (blue). Velocity shows good agreement, specifically for the 5th bin (last column). Differences between breath-hold and free-breathing magnitude images are minor.
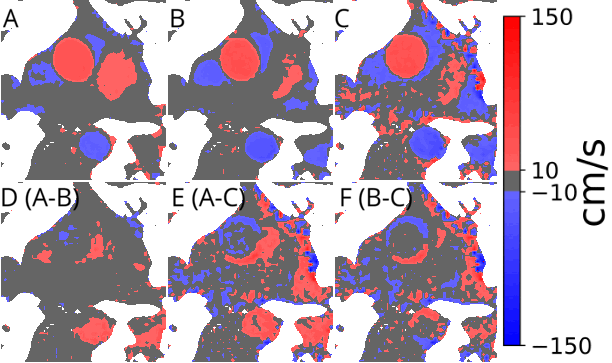
Figure 5: (GIF) Cropped and linearly interpolated velocity images for one volunteer showing breath hold PC-bSSFP (A), free-breathing PC-bSSFP (B) breath-hold PC-GRE (C) and their respective differences (D, E, F). The greatest similarity is between breath-hold and free-breathing PC-bSSFP, with PC-GRE differing mostly in velocity noise. Gray regions represent velocities less than 10cm/s (~7% Venc)
DOI: https://doi.org/10.58530/2023/0554