0543
Cartesian Ultrashort Echo Time (CUTE) Imaging of the Lung Parenchyma
Richard Thompson1, Christopher Keen1, Hefin Jones2, Richard Coulden2, Peter Seres1, and Justin Grenier1
1Biomedical Engineering, University of Alberta, Edmonton, AB, Canada, 2Radiology & Diagnostic Imaging, University of Alberta, Edmonton, AB, Canada
1Biomedical Engineering, University of Alberta, Edmonton, AB, Canada, 2Radiology & Diagnostic Imaging, University of Alberta, Edmonton, AB, Canada
Synopsis
Keywords: Pulse Sequence Design, Lung, UTE, Heart Failure, Cartesian
The Cartesian UTE (CUTE) sequence provides high quality three-dimensional imaging of the lung parenchyma (TE = 140 us) without the requirement for k-space gridding in a short breath-hold. Phantom validation and comparison to an existing UTE sequence (Spiral VIBE) is provided in 64 healthy subjects and in clinical examples.INTRODUCTION
Quantitative imaging of the lung parenchyma requires ultrashort echo time (UTE) acquisitions, typically with TE ≤ 150 µs to avoid excessive signal decay (T2* ~2ms at 1.5T and ~0.7ms at 3.0T)1, which necessitates non-Cartesian center-out k-space trajectories. The required Cartesian gridding of k-space prior to image reconstruction is computationally demanding and sensitive to gradient imperfections and timing errors that can give rise to artifacts and signal non-uniformity that may limit or preclude quantitative applications, in particular, quantitative imaging of lung water density.2 As an alternative, we propose a three-dimensional (3D) gradient-echo Cartesian UTE (CUTE) acquisition approach that combines two separate half-k-space readouts to enable UTE with k-space sampling directly on a Cartesian grid. The CUTE approach was compared to the available Spiral VIBE UTE3 method in phantoms, in a large cohort of healthy subjects and clinical examples.METHODS
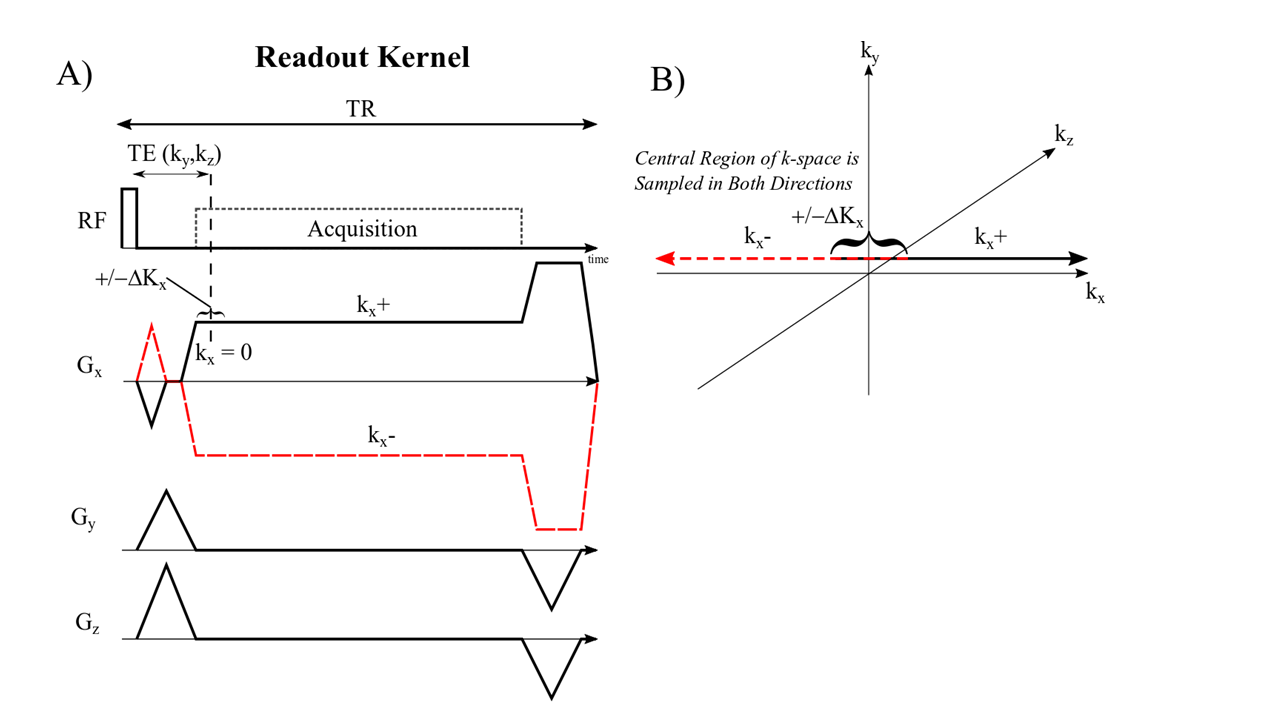
Figure 1 displays the proposed pulse sequence for the 3D gradient-echo CUTE approach. A non-selective rectangular radiofrequency (RF) excitation pulse enabled full-torso spatial excitation and minimal excitation duration. Each ky and kz phase-encoding step was acquired separately with both a positive (kx+) and a negative readout gradient, kx- (Fig. 1A). The readout gradient pre-phaser enabled 50%+ΔKx coverage of kx-space for both readout directions for sampling of the middle of k-space over a range ±ΔKx for both readouts (Fig. 1B). The minimum achievable TE was used for each k-space point, TE (ky,kz), with the shortest times at the middle of k-space. The repetition time (TR) was held constant. CUTE was compared to Spiral VIBE UTE1 approach for phantom and in-vivo acquisitions. MRI Acquisition: CUTE - 400x500x300 mm FOV (read-encoding superior-inferior), TE=140μs (260μs at edge of k-space), TR=1.7ms, 1595 Hz/pixel, GRAPPA=2, 128x160x64 matrix (3.125x3.125x5mm, reconstructed to 2.08mm isotropic), 2° flip angle, 13 seconds acquisition (breath-hold). 3T PRISMA and 1.5T AERA scanners (Siemens, Erlangen, Germany) using 18 chest/32 back coil array for reception. Spiral VIBE - 550x550x336mm FOV, TE=50 ms, TR=2.46 ms, 945 Hz/pixel, 192x192x96 (2.86x2.86x3.5mm reconstructed to 1.43x1.43x3.5mm) 10 seconds acquisition (only available at 3T). Phantom Experiments: CUTE and Spiral VIBE acquisitions were performed on a composite water and fat phantom with repeated studies using a 0Hz and 200Hz off-resonance field shift to evaluate off-resonance performance (3T). In-Vivo Experiments: CUTE and Spiral VIBE acquisitions were performed on 65 healthy subjects (end-expiration breath-hold) (3T). One healthy subject was imaged with the CUTE method at 1.5T and 3.0T with additional illustrative clinical cases also at 1.5T. In-Vivo Image Processing: A previously reported processing pipeline was used to perform image normalization to units of relative lung water density (rLWD) and segmentation of the lung parenchyma to provide lung water density quantification.2 In addition to average rLWD, total lung parenchyma water volume was calculated as rLWV = ΣrLWD·voxel_volume. Finally, segmented rLWD images for all 64 subjects were resampled on a grid (32(RL)x32(HF)x10(CB) pixels) to generate average regional rLWD maps. Airway signal intensities in the trachea, ideally a noise region, were measured to assess the artifact level, in the same units of rLWD.RESULTS
Phantom studies illustrate the superior performance of CUTE as compared to Spiral VIBE in terms of reduced sensitivity to blurring from off-resonance effects from global field shifts and fat (Fig. 2). Mean whole-lung values of rLWD and rLWV and total lung volume were similar for CUTE and Spiral VIBE (p>0.05) but with significantly higher artifact level (mean airway signal) for VIBE, p<0.05 (Fig. 3). Spiral VIBE had some cases of artifacts and consistent patterns of spatial heterogeneity in rLWD as compared to CUTE that were consistent in all 64 subjects (Fig. 3). Repeated CUTE scans in one volunteer at 1.5T and 3.0T showed consistent appearance and similar rLWD and rLWV values measured over the whole lung volume (Fig. 4). Clinical examples illustrated the measurement of increased water density, globally in a case of chronic heart failure, and regionally in cases of pulmonary hypertension and dilated cardiomyopathy (CUTE, 1.5T) (Fig. 4). Average values for lung water content and volumes were similar between CUTE and Spiral VIBE (Fig. 5). All CUTE image reconstruction was performed online (~25 seconds using the Siemens FIRE application).DISCUSSION
The Cartesian UTE (CUTE) sequence was shown to provide high quality three-dimensional imaging of the lung parenchyma without the requirement for k-space gridding in a short breath-hold (140μs echo time). In comparison to the available Spiral VIBE UTE sequence, CUTE was shown to have more uniform lung water density values over space and significantly less dependence on off-resonance frequencies. Acquisition of k-space on a Cartesian grid enabled fast on-scanner reconstruction and eliminated the signal non-uniformities observed with the non-Cartesian Spiral VIBE sequence. Image quality and quantitative lung water densities were illustrated to be similar at 1.5T and 3.0T (i.e. field-strength and gradient-performance independent) and clinical cases at 1.5T showed globally and regionally elevated lung water content.CONCLUSION
The Cartesian UTE (CUTE) sequence provides high quality quantitative three-dimensional imaging of the lung parenchyma without the requirement for k-space gridding in a short breath-hold acquisition.Acknowledgements
No acknowledgement found.References
1. Yu J, Xue Y and Song HK. Comparison of lung T2* during free-breathing at 1.5 T and 3.0 T with ultrashort echo time imaging. Magn Reson Med. 2011;66:248-54.
2. Meadus WQ, Stobbe RW, Grenier JG, Beaulieu C and Thompson RB. Quantification of lung water density with UTE Yarnball MRI. Magn Reson Med. 2021;86:1330-1344.
3. Qian Y and Boada FE. Acquisition-weighted stack of spirals for fast high-resolution three-dimensional ultra-short echo time MR imaging. Magn Reson Med. 2008;60:135-45.
Figures
Figure
1 – Cartesian UTE (CUTE) pulse sequence.
A) Spoiled gradient-echo acquisition of the positive (kx+) and
negative half (kx-) of k-space. A small
readout pre-phaser enables acquisition of 50%+ΔKx of
k-space in both readout directions, as illustrated in B).
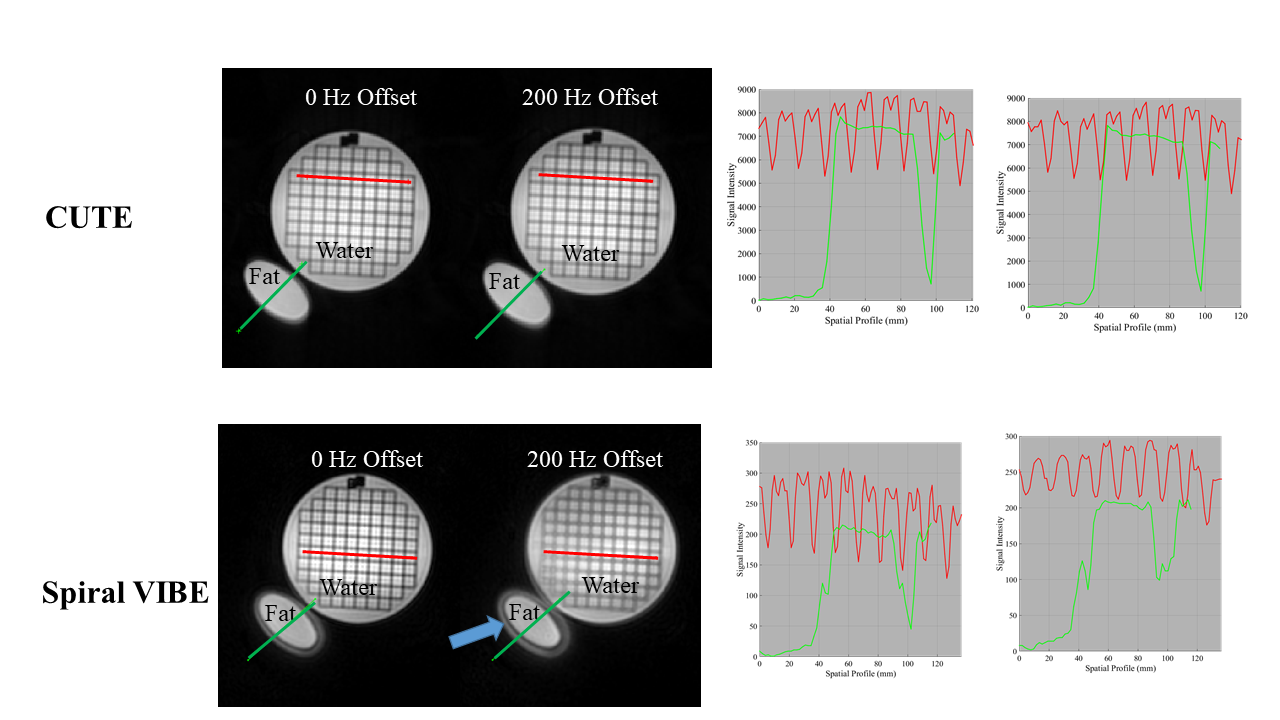
Figure 2
– Phantom Experiments (CUTE (top) and Spiral VIBE (bottom)). CUTE and
Spiral VIBE images of a mixed water
and fat phantom were repeated with a 0 Hz and 200 Hz off-resonance field
shift. Signal intensity profiles (Right)
show artifacts and blurring for the Spiral VIBE sequence around the fat container
and with off-resonance imaging, but consistent performance for CUTE with no
off-resonance dependence.
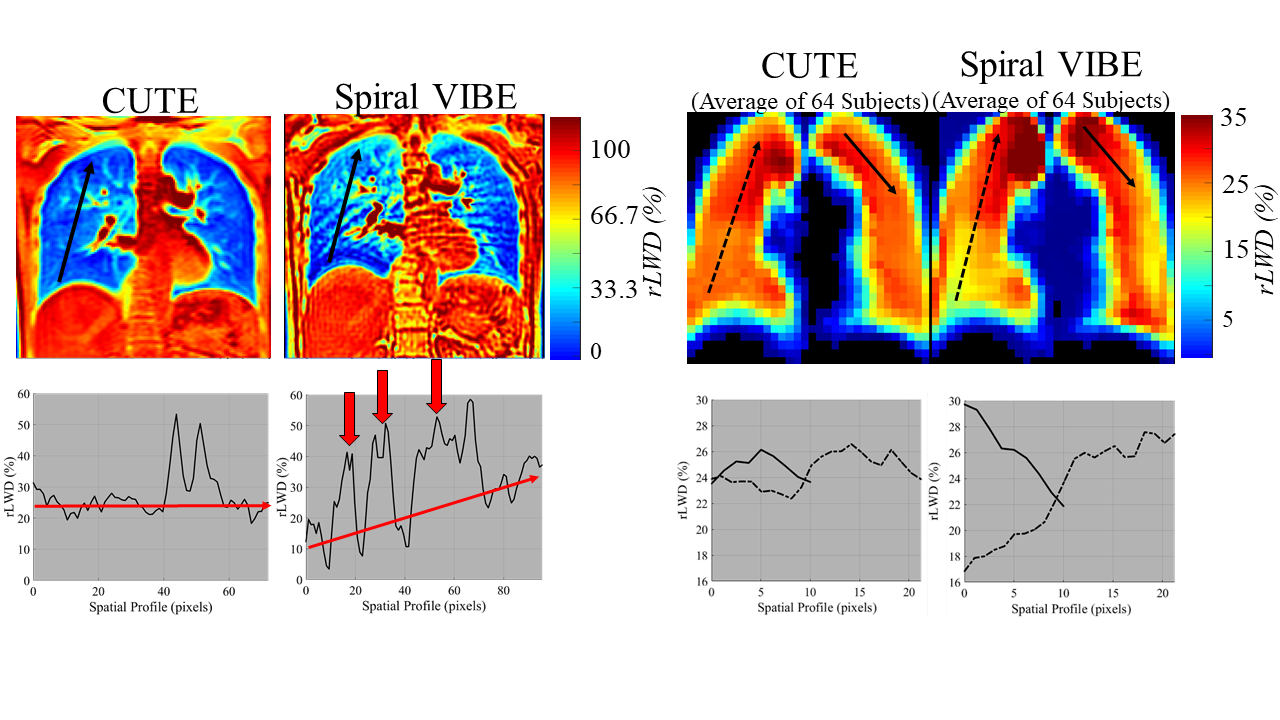
Figure 3
– In-Vivo Experiments. (Left) Comparison of CUTE
and Spiral VIBE relative lung water density (rLWD) images in one subject (one slice of ~100 coronal slices),
highlighting a case of high artifact level and an unexpected rLWD spatial gradient (inferior to
superior) for VIBE. (Right) Average rLWD
images for all 64 healthy subjects shows consistency of the unwanted spatial
gradient for VIBE. Uniform water content
in inferior-superior direction is expected.2
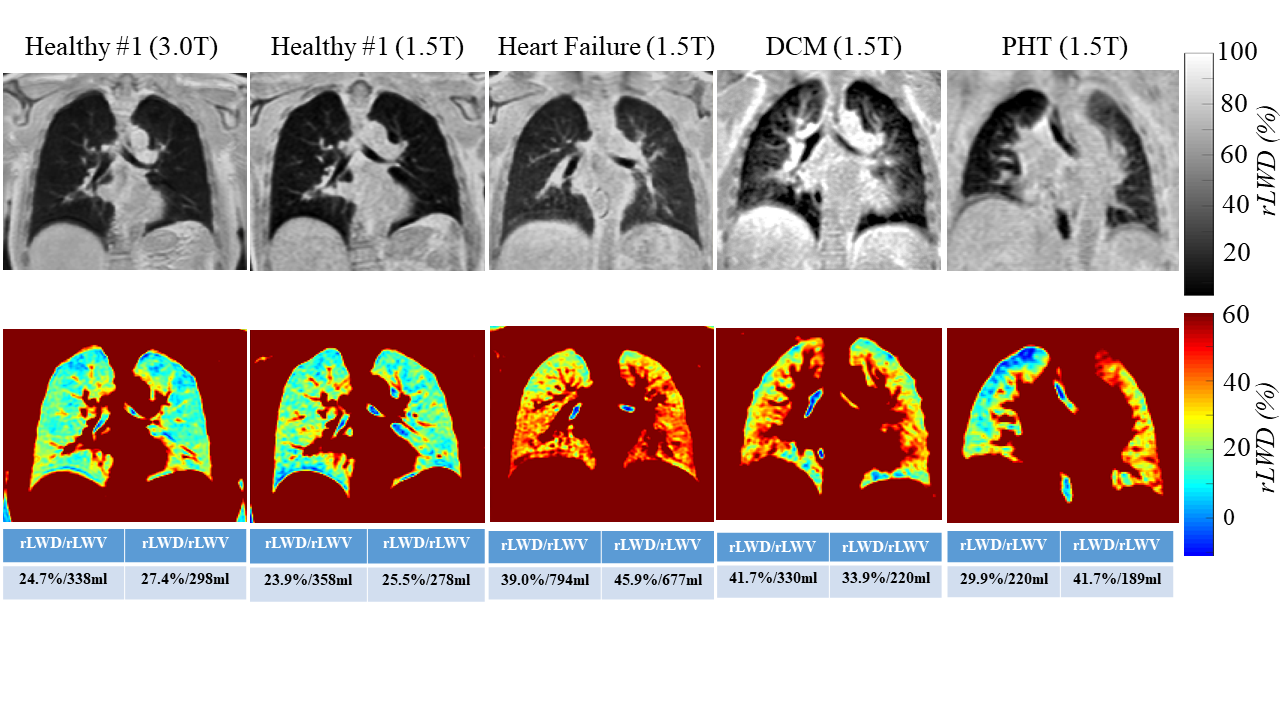
Figure 4
– In-Vivo Examples (CUTE rLWD images). Images acquired at 1.5T and 3.0T for the same
healthy subject (left). Clinical
examples from patients with heart failure, dilated cardiomyopathy (DCM) and
pulmonary hypertension (PHT) at 1.5T show different patterns of elevated lung
water density. Average whole lung rLWD
and rLWV values for the right/left
are shown.
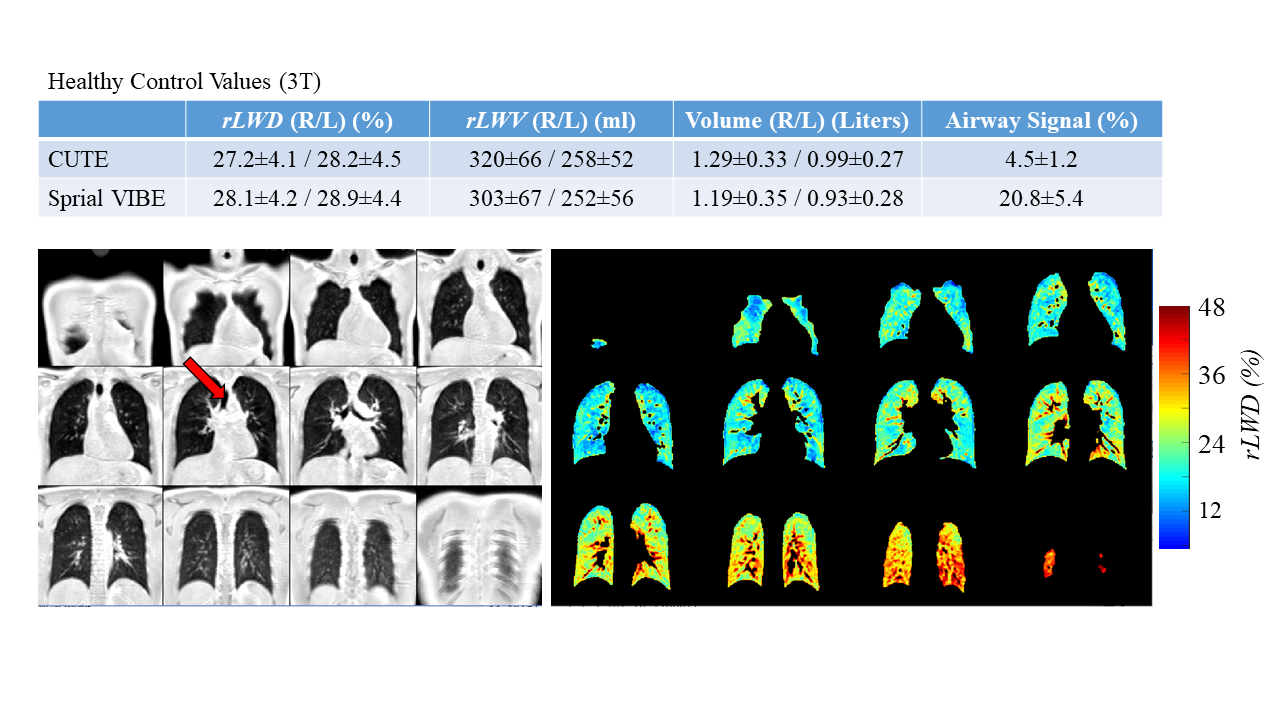
Figure 5 – (Top) Average values for relative lung water density (rLWD), relative lung water volume (rLWV), total lung volume and airway
signal intensity (red arrow, trachea) from the 64 healthy volunteers. (Bottom) Typical CUTE rLWD images (12 of ~100 coronal slices
shown). Images on the right show the
segmentation mask (machine learning approach) used for calculation of the lung
water values
DOI: https://doi.org/10.58530/2023/0543