0529
Pseudo Partition-encoded Simultaneous Multislab (pPRISM) for Submillimeter Diffusion Imaging Without Navigator and Slab-Boundary Artifacts1Radiology, UNC at Chapel Hill, Chapel Hill, NC, United States, 2Biomedical Research Imaging Center, UNC at Chapel Hill, Chapel Hill, NC, United States, 3Biomedical Engineering, UNC at Chapel Hill, Chapel Hill, NC, United States
Synopsis
Keywords: Pulse Sequence Design, Diffusion Tensor Imaging
The ability to achieve submillimter isotropic resolution diffusion MR imaging (dMRI) is critically important to study fine-scale brain structures. While the multi-shot approaches, including SMSlab and gSlider-SMS, have been proposed to mitigate the inherently low SNR, the SMSlab sequences require additional navigators for phase estimation and both SMSlab and gSlider-SMS suffered from the slab-boundary artifacts. This study proposed two new concepts: PRISM encoding and 2) pseudo slab in order to mitigate the slab-boundary artifacts and shorten the scan time. Together, this study achieved the dMRI with 0.86 mm isotropic resolution with 16.3%-43.6% reduction of scan time compared to gSlider.Introduction
One of the major challenges in submillimeter dMRI is the inherently low signal-to-noise ratio (SNR). While the multi-shot approaches, including simultaneous multi-slab (SMSlab) and generalized slice dithered enhanced resolution with simultaneous multislice (gSlider-SMS), have been proposed to mitigate the low SNR, limitations are associated with these approaches. The SMSlab sequences require additional phase navigators and both SMSlab and gSlider-SMS suffered from the slab boundary artifacts. In this work, I developed a novel acquisition method named pseudo Partition-encoded Simultaneous Multislab (pPRISM) which is not only free from slab-boundary artifacts and phase navigator but also flexible in setting SMS factor and number of shots. With pPRISM, this study achieved the dMRI with 0.86-mm isotropic resolution and whole-brain coverage. The performance was compared with gSlider imaging.Method
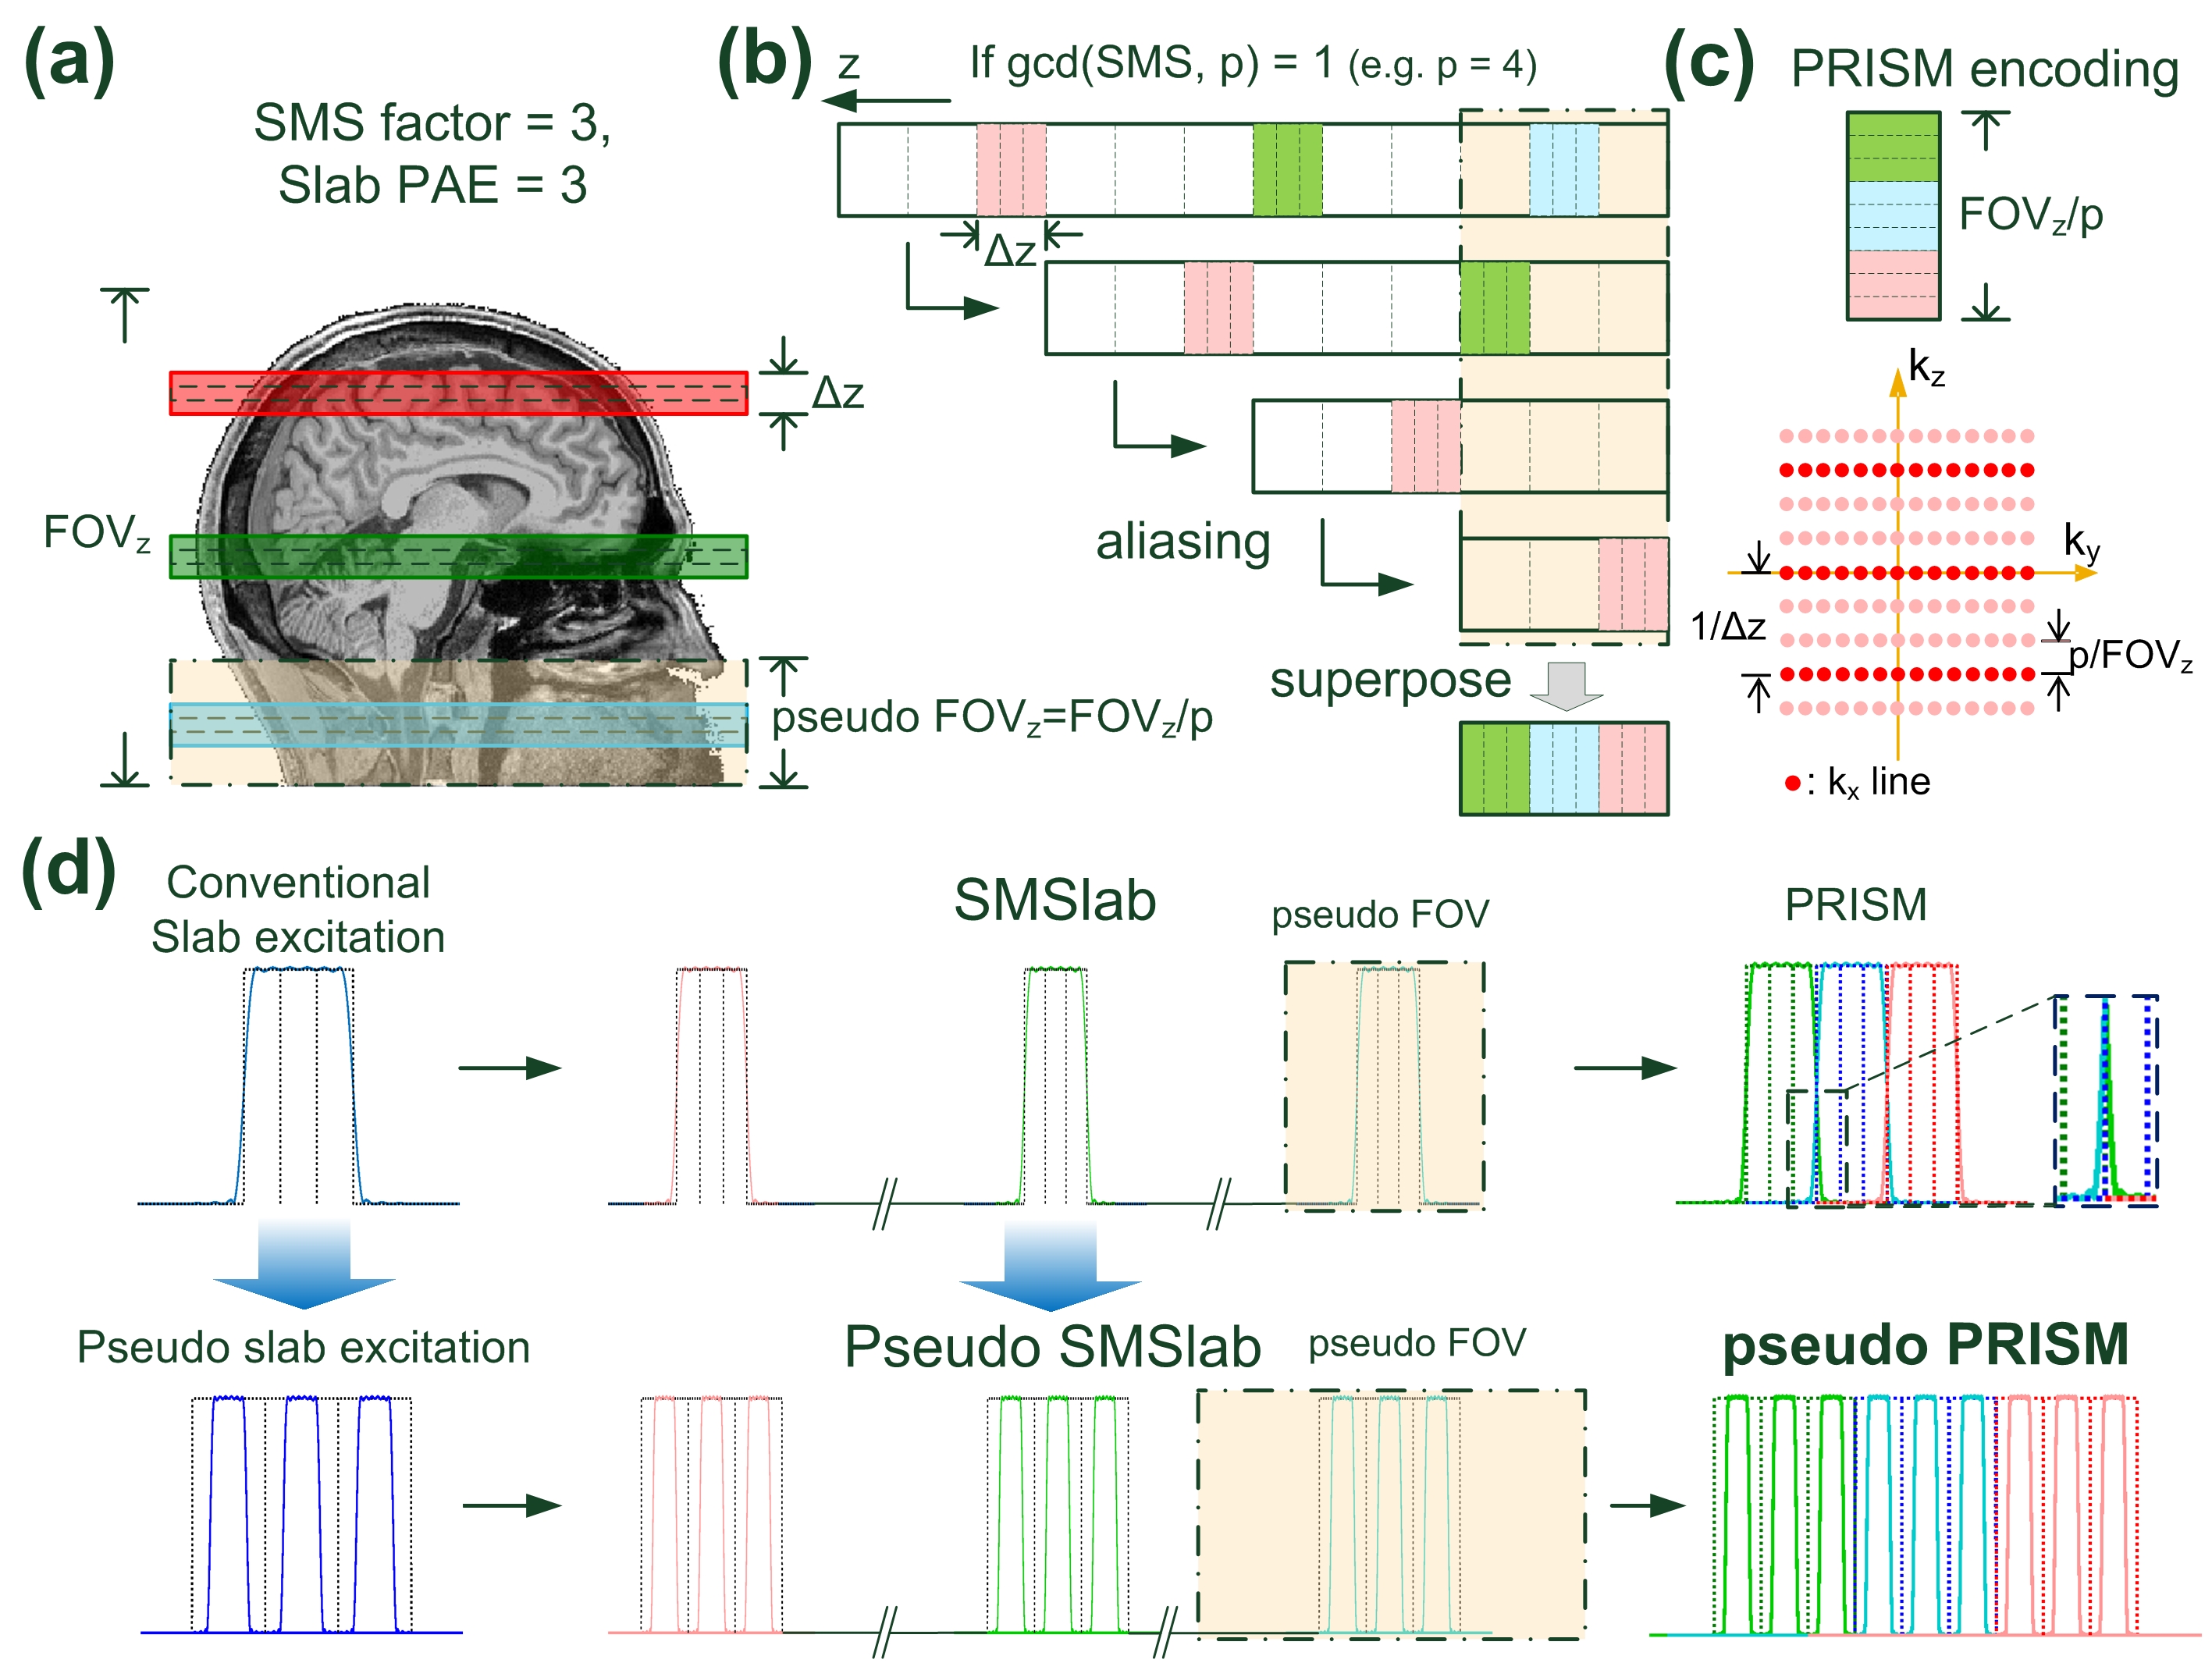
The proposed pseudo PRISM introduces two novel concepts: 1) PRISM encoding and 2) pseudo slab. The PRISM encoding is to describe the encoding of SMSlab in 3D k‐space. This problem is not straightforward because inter-slab and intra-slab encoding are not independent using only gradient encoding. To address this problem, joint RF and gradient encoding was proposed1. In this work, I demonstrated that the 3D encoding of SMSlab can be accomplished using only gradient encoding as shown in Figure 1. Instead of encoding full field-of-view (FOV), one can set a smaller FOV with the size along z direction=FOVz/p. As shown in Figure 1b, the use of smaller FOV will inevitably cause aliasing. However, the excited slab signal will not alias with each other due to the inter-slab gap. In the end, the 3 slabs will concatenate into a volume with thickness of FOVz/p. Therefore, the encoding for SMSlab is equivalent to the 3D encoding of a volume.The sampling pattern for SMSlab in 3D k-space is shown in Figure 1c. Note that slab concatenation after aliasing is not the necessary condition for PRISM encoding. Based on my mathematical derivation, the p could be any integer as long as p and SMS factor are co-prime. In practice, I used p = 1 to reduce the size of z blip. Additionally, the concept of pseudo slab is illustrated in Figure 1d. In reality, the slab profile will roll over to outside of the predefined slab position, causing signal overlapping as shown in the upper-right panel of Figure 1d. Here I proposed the pseudo slab that consists of multiple slices with a spacing of double slice thickness. By the in-slab gaps, the overlapping between slabs after PRISM encoding can be minimized.
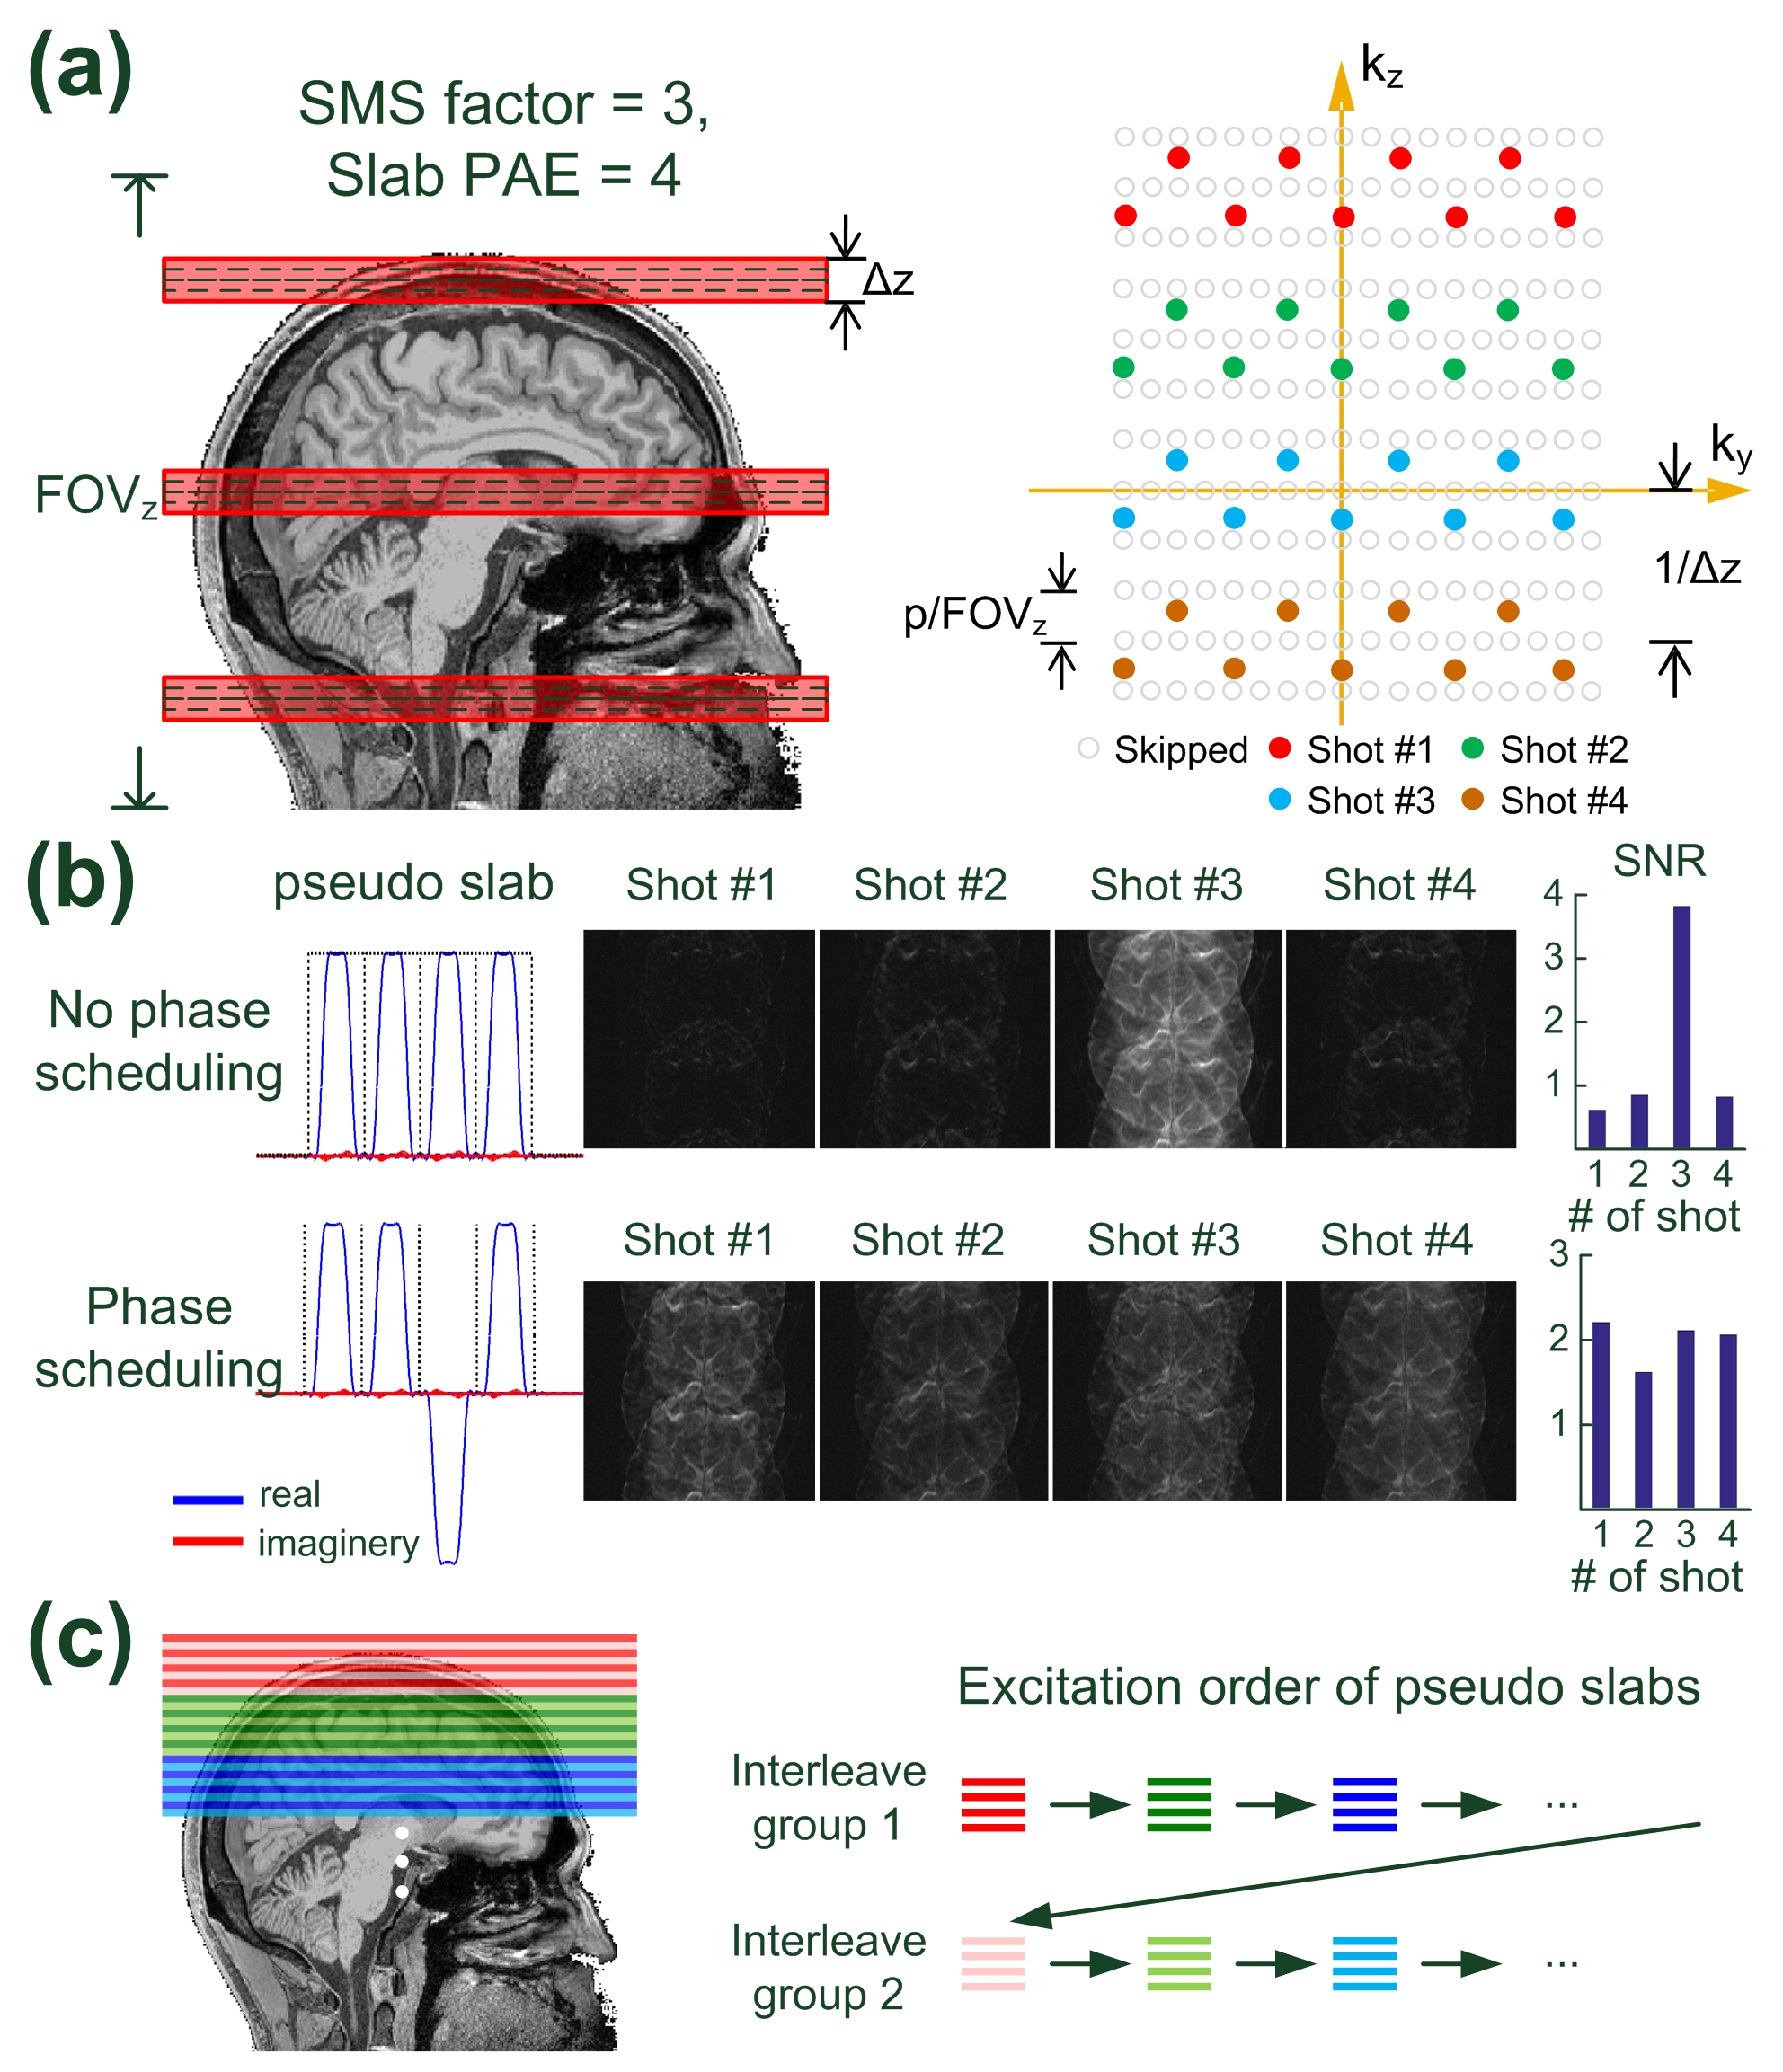
Based on the PRISM encoding, the accelerated sampling pattern can be easily designed, as shown in Figure 2a. I also applied the phase scheduling onto the pseudo slab, as shown in bottom row of Figure 2b. The phase scheduling distributed the signal strength uniformly across the shots. Instead of using phase navigator, this study estimated the image phase directly from the data using the low-rank reconstruction2,3 before performing SENSE reconstruction. The order of pPRISM acquisition is illustrated in Figure 2c.
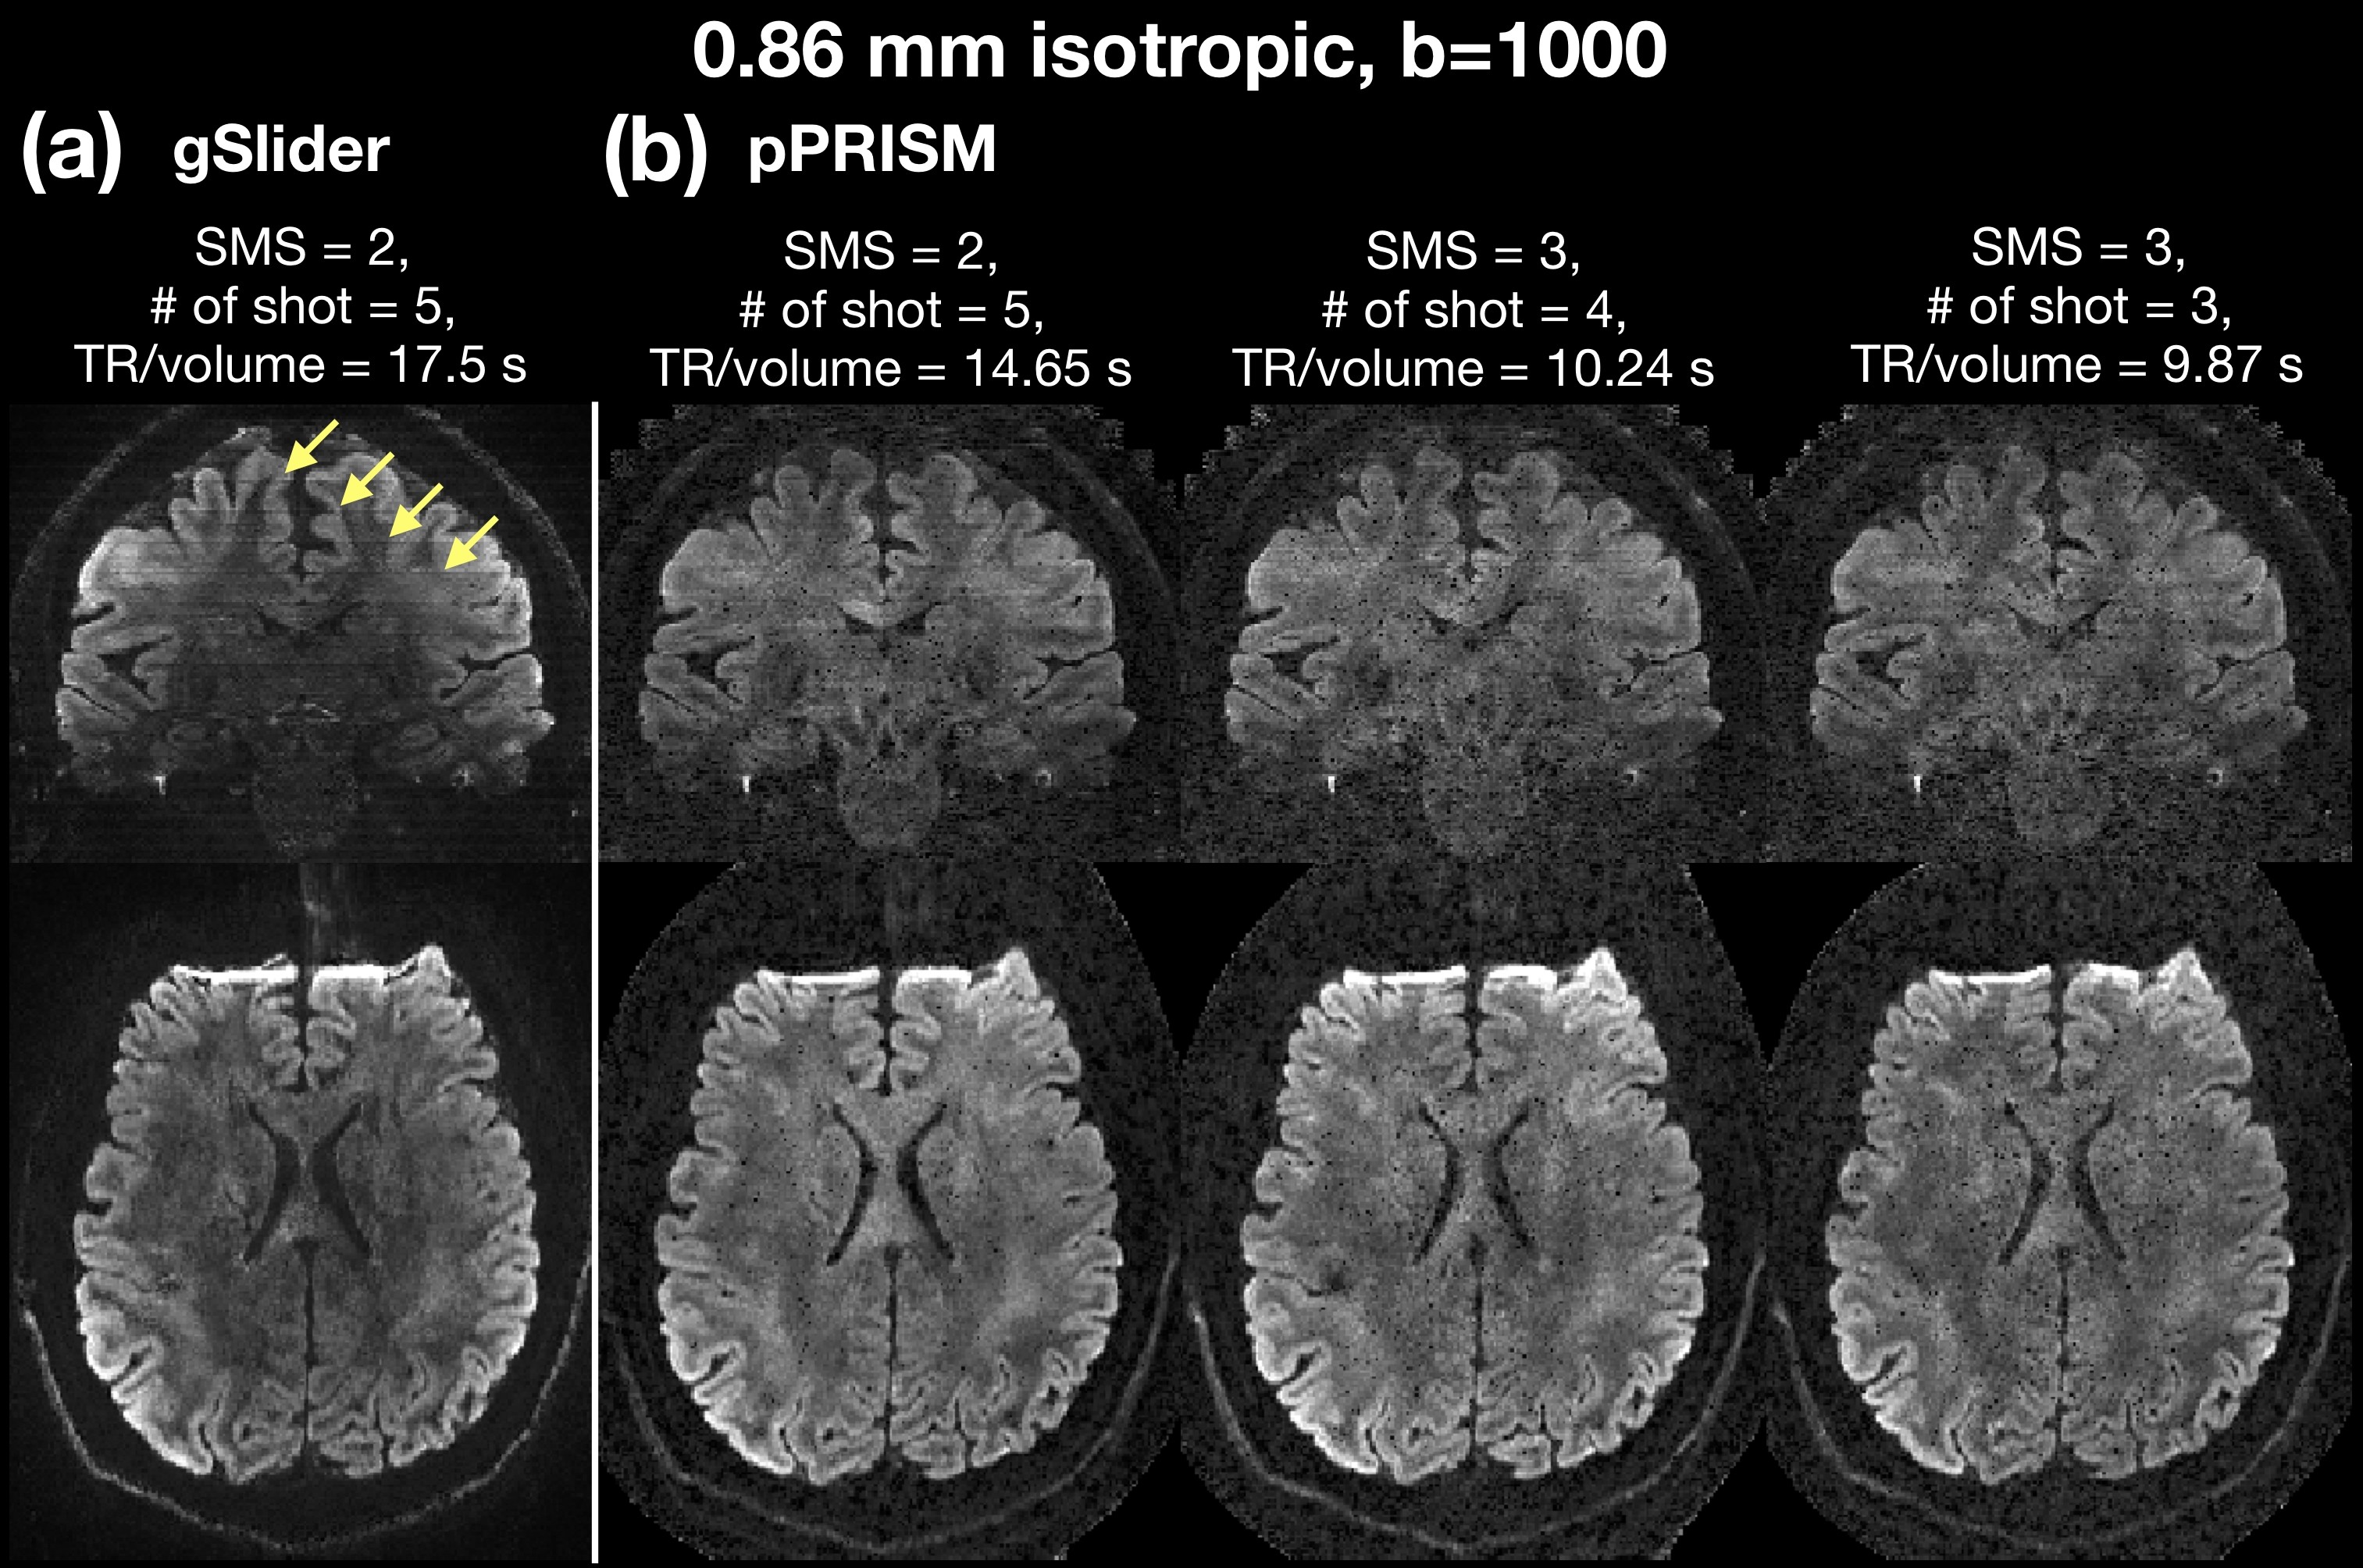
MR images were acquired using a 3T Prisma scanner (Siemens Healthcare, Erlangen, Germany). The common imaging parameters are: resolution=0.86 mm isotropic, iPAT=2, image matrix=256×256, TE=97ms, partial Fourier=6/8. For gSlider, SMS=2, number of shots=5, TR per shot=3.5s, FOV = 220x220x129 mm3. For pPRISM, different combinations of imaging parameters were used: 1) SMS=2, number of shots=5, TR per shot=2.93s, FOV=220x220x137.6 mm3; 2) SMS=3, number of shots=4, TR per shot=2.56s, FOV=220x220x144.5 mm3; 3) SMS=3, number of shots=3, TR per shot=3.29s, FOV=220x220x139.3 mm3. A SLR RF pulse with time-bandwidth product (TBWP) of 6 and pulse duration of 8 ms was used for excitation. A Sinc RF pulse with TBWP of 4 and pulse duration of 9.6 ms was used for refocusing. A monopolar diffusion acquisition with b=1000 was performed.
Results
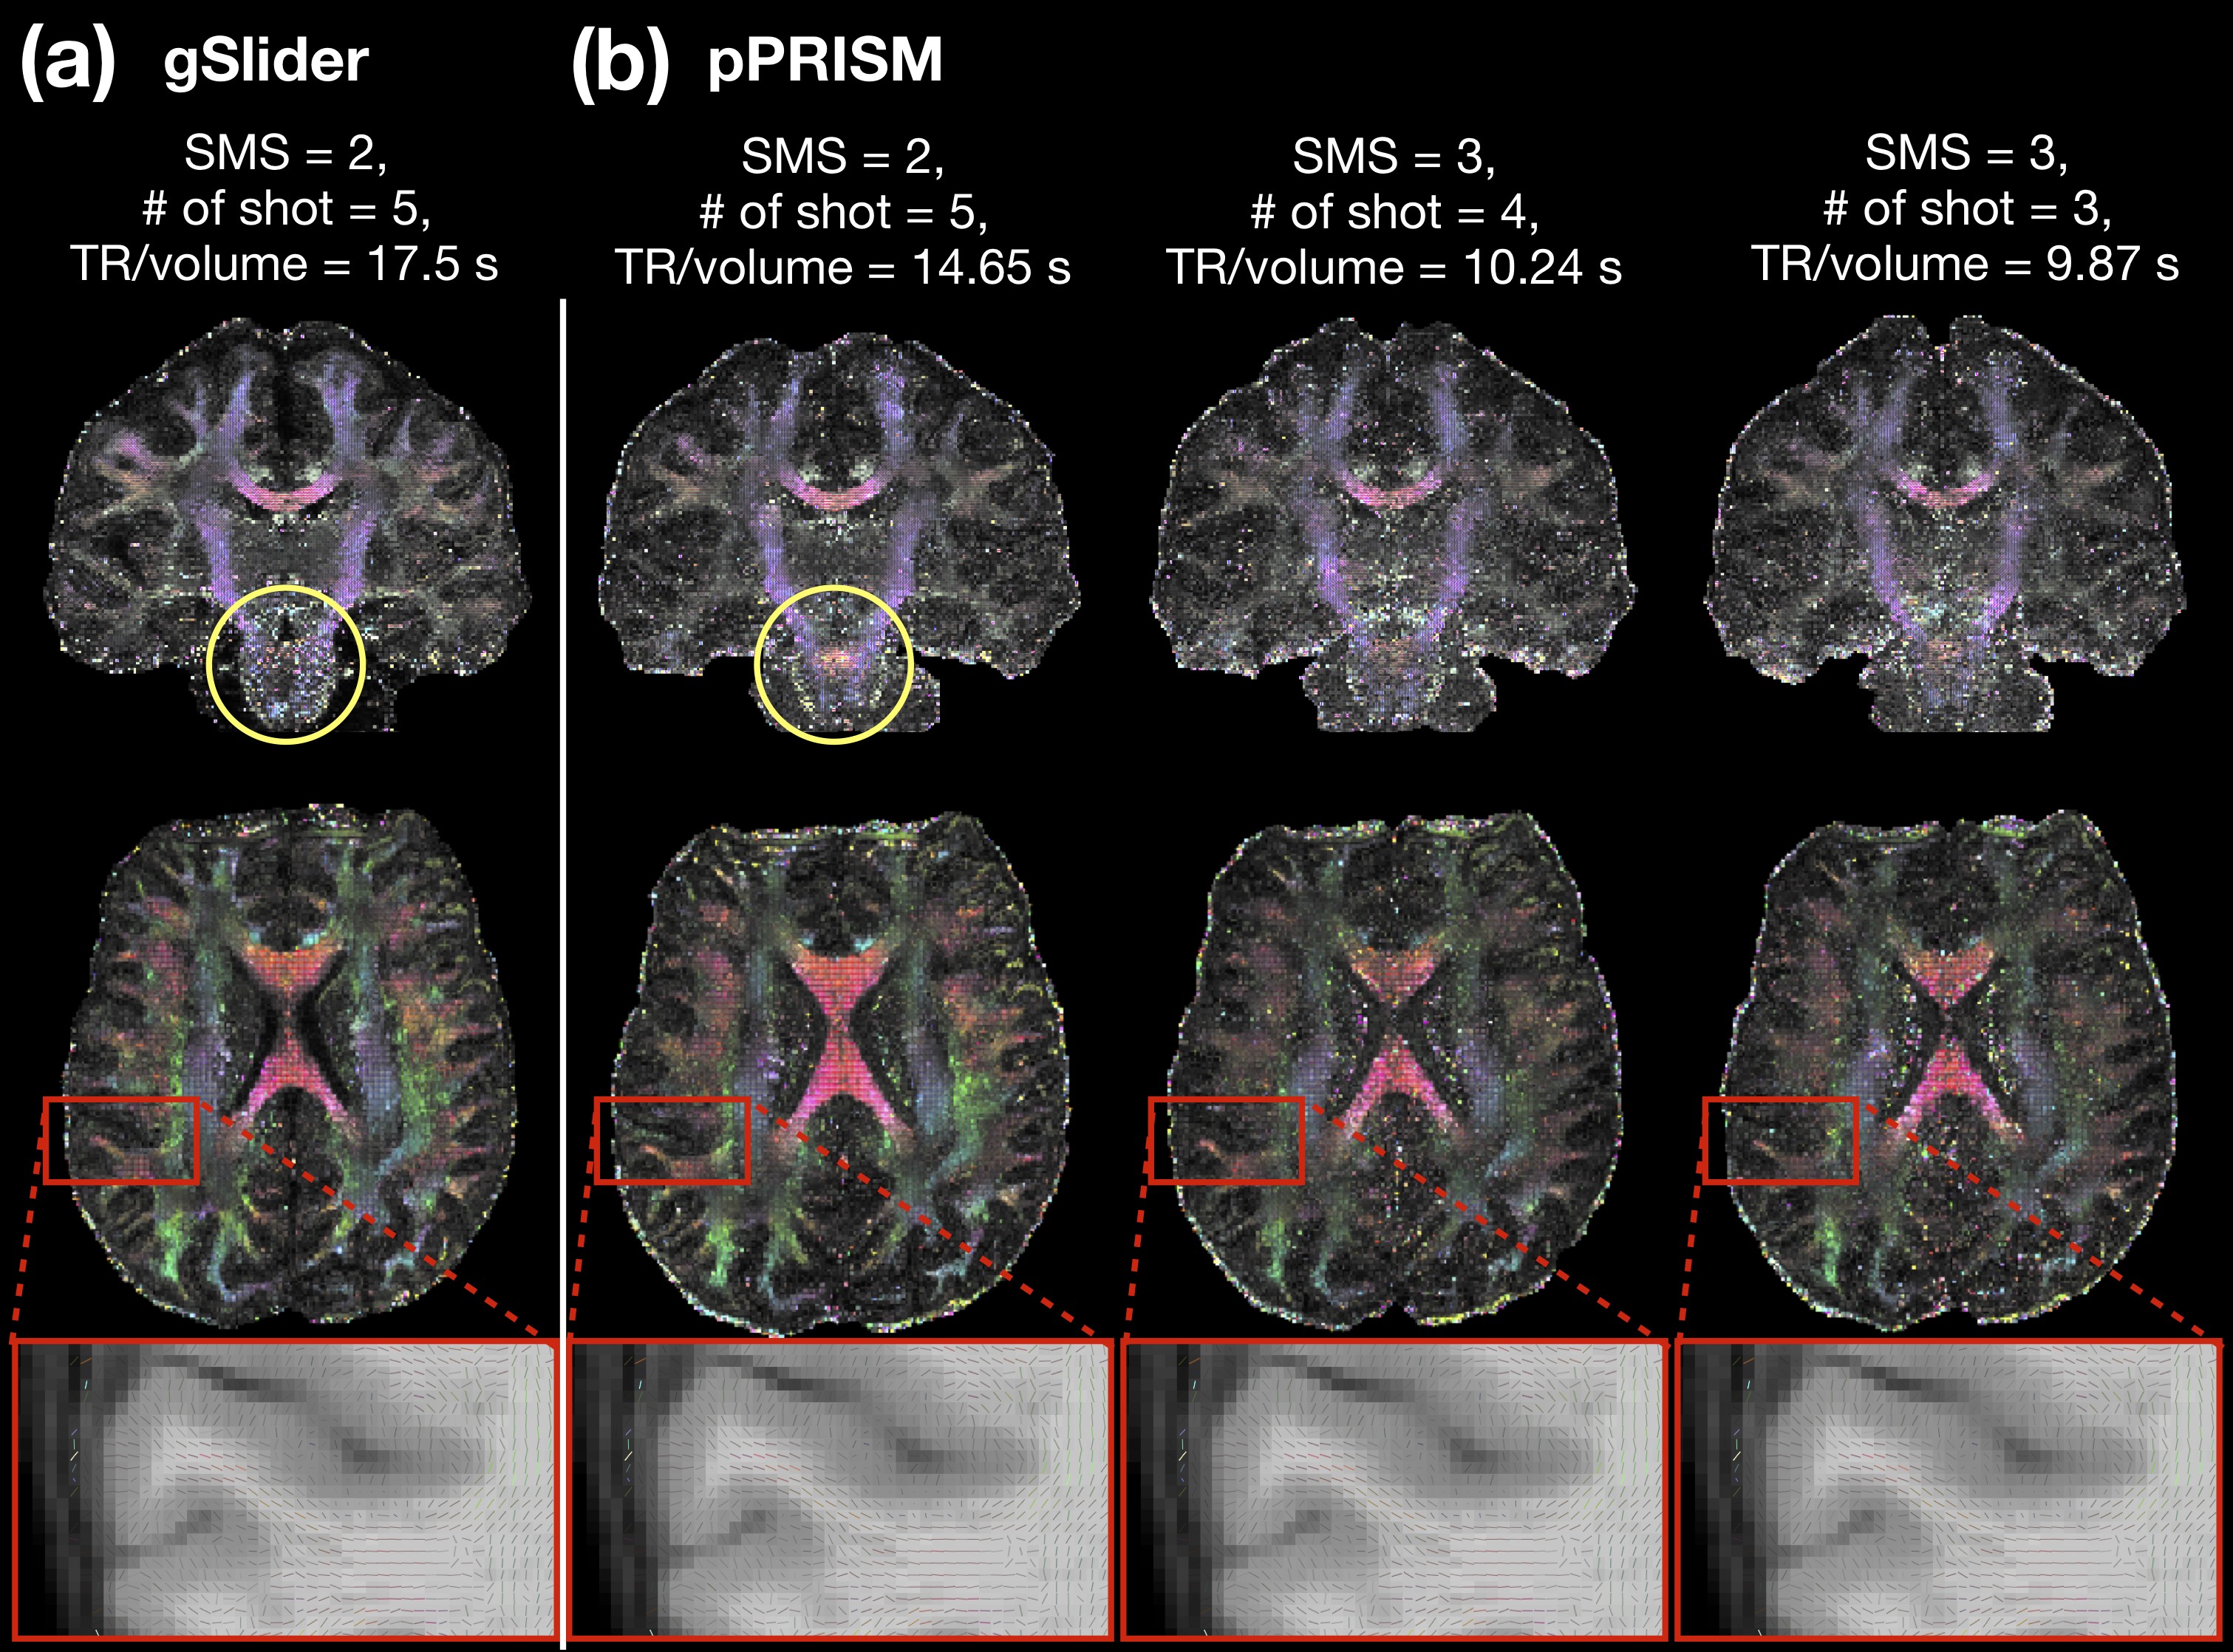
The submillimeter gSlider and pPRISM images were demonstrated in Figure 3. All the images were denoised by NOise reduction with DIstribution Corrected (NORDIC) PCA4. As shown in Figure 3a, the slab boundary artifacts were pronounced in gSlider but not in pPRISM images. With the flexibility in SMS and number of shots, pPRISM was able to increase the SMS factor to 3 and thereby reduced the scan time by up to 43.6% at the cost of slightly-degraded signal strength.Figure 4 showed the colored FA maps of gSlider and pPRISM. The pPRISM showed higher tensor signal at the brain stem than gSlider. This is probably due to the use of variable-rate selective excitation (VERSE) in gSlider during RF excitation, which caused the sequence vulnerable to field inhomogeneity. Similar to Figure 3, the pPRISM images with SMS=3 showed slightly weaker FA values. Nevertheless, the corresponding tensors in the cortex remained spatially stable, showing the orientation perpendicular to the cortical surface.
Discussion
With the proposed pPRISM method, the dMRI in this study achieved 0.86-mm isotropic resolution with the following advantages: 1) 16.3%-43.6% of scan time reduction compared to gSlider, 2) minimal slab boundary artifacts, 3) free from the use of VERSE and phase navigator, 4) free from Gibbs effect, and 5) better signal quality at brain stem. Hence, the proposed pPRISM imaging is a promising approach to achieve submillimeter diffusion imaging within clinically feasible scan time.Acknowledgements
This work was supported in part by NIH grants R21AG060324.References
1. Dai, E. et al. A 3D k‐space Fourier encoding and reconstruction framework for simultaneous multi‐slab acquisition. Magn. Reson. Med. mrm.27793 (2019) doi:10.1002/mrm.27793.
2. Mani, M. et al. SMS MUSSELS: A navigator‐free reconstruction for simultaneous multi‐slice‐accelerated multi‐shot diffusion weighted imaging. Magn. Reson. Med. 83, 154–169 (2020).
3. Haldar, J. P. Low-Rank Modeling of Local $k$-Space Neighborhoods (LORAKS) for Constrained MRI. IEEE Trans. Med. Imaging 33, 668–681 (2014).
4. Vizioli, L. et al. Lowering the thermal noise barrier in functional brain mapping with magnetic resonance imaging. Nat. Commun. 12, 5181 (2021).
Figures