0527
Predicting Post-Stereotactic Radiotherapy Magnetic Resonance Images: A Proof-of-Concept Study in Breast Cancer Metastases to the Brain1Electrical Engineering, University of South Florida, Tampa, FL, United States, 2Department of Cancer Physiology, H.Lee Moffitt Cancer Center and Research Institute, Tampa, FL, United States, 3Department of Radiation Oncology, Baptist Health South Florida, Miami, FL, United States, 4Department of Radiation Oncology, H.Lee Moffitt Cancer Center and Research Institute, Tampa, FL, United States, 5Quantitative Imaging Shared Service, H.Lee Moffitt Cancer Center and Research Institute, Tampa, FL, United States
Synopsis
Keywords: Tumors, Radiotherapy, Image Prediction
Stereotactic radiosurgery (SRS) can provide effective local control of breast cancer metastases to the brain while limiting damage to surrounding healthy tissues. Knowledge-based algorithms have been reported that can alleviate the manual aspects of radiation dose planning, but these do not currently provide voxel-level dose prescriptions that are optimized for tumor control and avoidance of radionecrosis and associated toxicity. On the assumption that a voxelwise relationship exists between pre-SRS MR images, the RT dose map, and the resulting post-SRS MR images, we have investigated a deep learning framework to predict the latter from the former two.Purpose
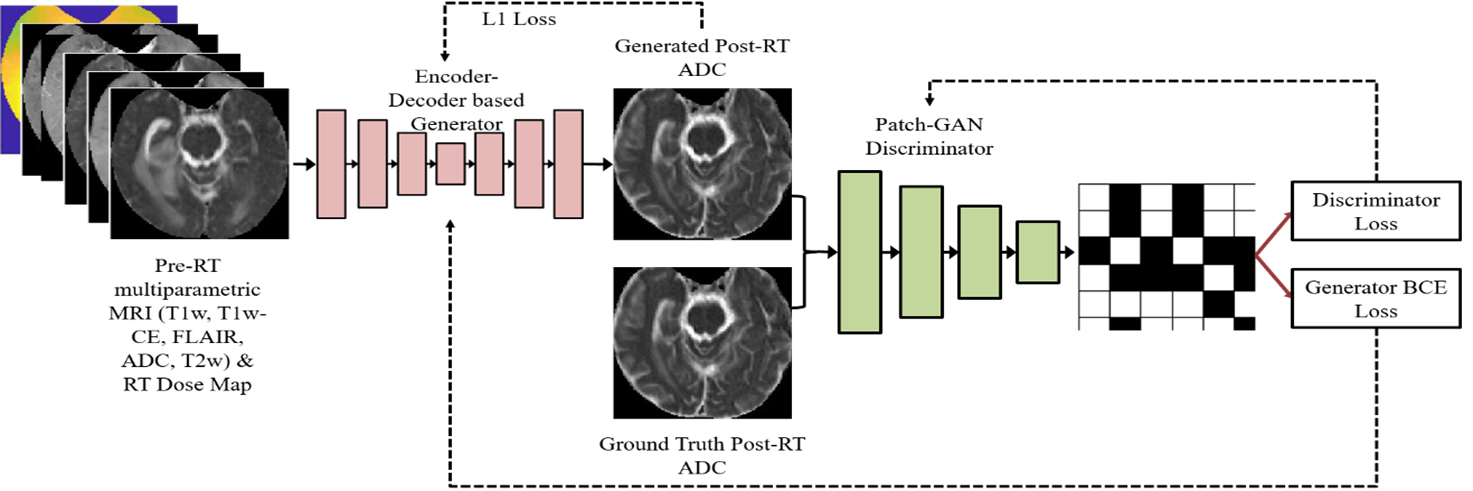
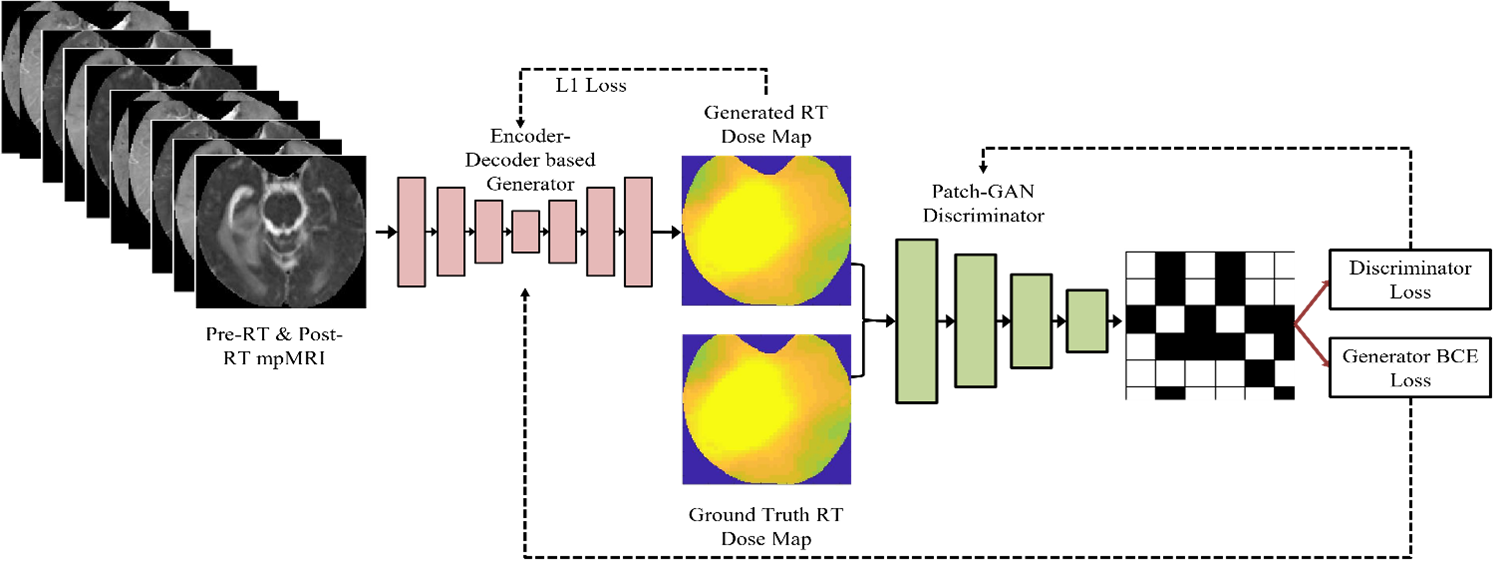
Stereotactic radiosurgery (SRS) provides high local control rates for the management of Breast Cancer Metastases to the Brain (BCMB). Damage to surrounding normal tissue is generally limited in SRS, though radiation necrosis is a rare but potentially devastating long-term toxicity. There is a clinical need for automated/semi-automated methods to predict tumor response to prescribed radiation treatment (RT) dose plans and help optimize the RT plans for local tumor control with minimal long-term toxicity. Knowledge-based methods are being developed to assist with RT dose planning while sparing organs-at-risk (OAR), though such automated treatment planning solutions typically do not provide voxel-level predictions of RT dose that would be optimal for specific outcomes [1-6]. We have explored a deep learning framework to predict post-SRS MR images of BCMB from pre-SRS MR images and the prescribed RT dose map. The goal is to enable the radiation oncologist to simulate radiologic outcomes and iteratively optimize RT plans for local control of BCMB. A pix2pix model [7] was trained on the RT dose map and T1-weighted unenhanced (T1w) and contrast-enhanced (T1wCE), T2-weighted (T2w), Fluid-Attenuated Inversion Recovery (FLAIR) images and ADC maps acquired pre-SRS, to predict the corresponding post-SRS MR images (the “forward model”). We have also explored an “inverse model” using the pix2pix framework to predict the RT dose map from pre-SRS and post-SRS T1w, T1wCE, T2w, FLAIR and ADC images.Method
In this retrospective IRB-approved study, planning CT images and associated RT dose maps, and T1w, T1wCE, T2w, FLAIR images and ADC maps acquired pre-RT, post-RT (15-158 days for 18 training patients), and at tumor recurrence (54-831 days for 18 training patients) in 28 BCMB patients were curated from our Radiology and Radiation Oncology databases. These patients received a mean SRS dose of 21 Gy (range:15-30 Gy) in 1-5 fractions. mpMRI images from all scan dates were co-registered to the planning CT using MIRADA-RTx (Mirada Medical, Denver, CO, USA). Gross tumor volume (GTV) contours and the RT dose map associated with the planning CT could be applied to the mpMRI images after co-registration. Voxel intensities on T2w, FLAIR, T1w and T1wCE images were calibrated using two reference normal tissues [8]. ADC, T2w, FLAIR, T1w, and T1wCE were variance-normalized using the mean and standard deviation of corresponding images from the training cohort. Calibrated and normalized images were then scaled between -1 and +1 using the global low and high pixel values from the training cohort (all voxels within Brain Mask, 18 patients). Figure 1 depicts the pix2pix framework used to predict post-SRS MRIs from pre-SRS MRIs and the RT dose map (the forward model). Figure 2 shows the architecture of the inverse model to predict the RT dose map from pre-SRS and post-SRS MRIs.Results and Discussion
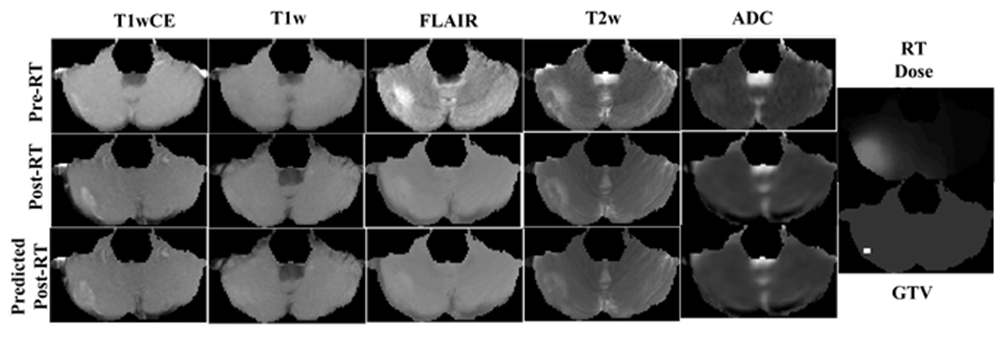
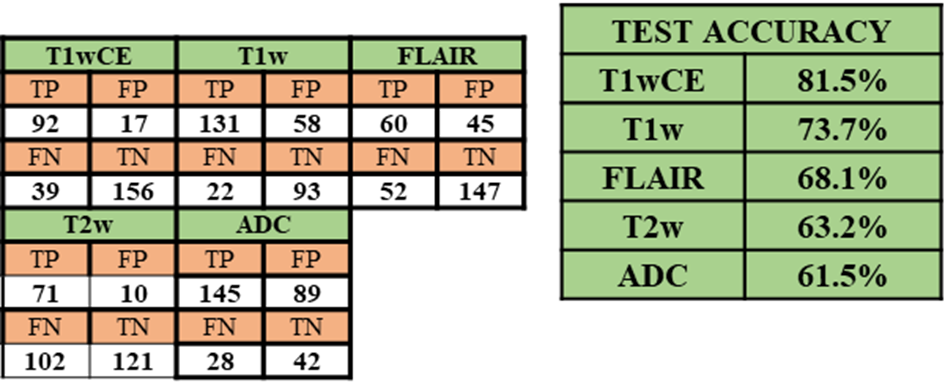
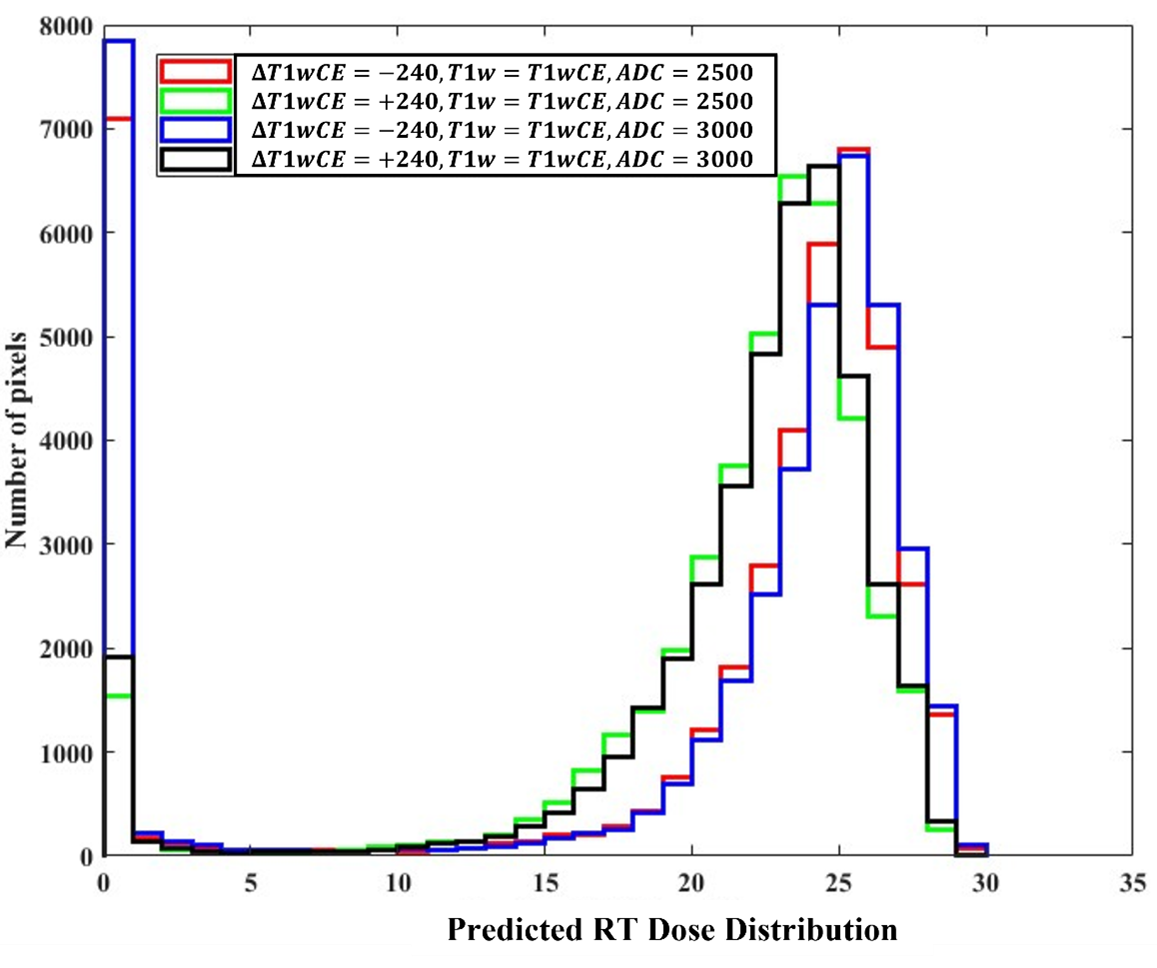
Figure 3 shows post-RT MRIs predicted using the trained forward model on a test sample. The corresponding pre-SRS and ground-truth post-SRS MRIs are also shown. In this example the predicted MR images are similar to the corresponding ground truth post-SRS MR images. We have evaluated test performances of the 5 forward models over all test samples by interrogating the ability of each model to predict the direction of change post-SRS within the gross tumor volume (GTV), namely, whether the mean post-SRS intensity within the GTV will be higher than or lower than the corresponding mean pre-SRS intensity within the GTV. The resulting confusion matrix is presented in Figure 4. The forward models for predicting post-SRS T1wCE and T1w images performed relatively well on testing, while the forward models for predicting post-SRS T2w, FLAIR and ADC achieved only modest accuracies (figure 4). In this preliminary study, the performance of the trained inverse model was evaluated by simulating the RT dose maps predicted to achieve suppression of intensity within the GTV on post-SRS T1wCE (i.e., decreased contrast enhancement post-SRS) coupled with increased ADC (i.e., increased water mobility post-SRS). In agreement with expectations, high RT dose values are predicted to be required to suppress contrast enhancement by 240 calibrated units and increase ADC to 3000 μm2/s within the GTV (Figure 5).Conclusion
A pix2pix based forward and inverse model are implemented in this work. This preliminary study provides proof-of-concept that it is possible to predict the RT dose maps directly from the pre-SRS and post-SRS MR images. A major challenge was the small size of the training and test cohorts (18 and 10 patients, respectively). This challenge was exacerbated by the need to exclude curated data due to inconsistent use of spin-echo and gradient echo pulse sequences, particularly for the T1w and T1wCE acquisitions. Another significant challenge is the presence of small misregistrations between the different MR images, both within and between scan dates. Further experiments with additional data and the use of 3D deep learning models are planned to address these challenges.Acknowledgements
No acknowledgement found.References
[1] Lee H et al., "Fluence-map generation for prostate intensity-modulated radiotherapy planning using a deep-neural-network," Scientific Reports (2019) 9:15671.
[2] Nguyen D et al., "A feasibility study for predicting optimal radiation therapy dose distributions of prostate cancer patients from patient anatomy using deep learning," Scientific Reports (2019) 9:1076. [3] Meerbothe T, "A physics guided neural network approach for dose prediction in automated radiation therapy treatment planning," Master of Science thesis at the Delft University of Technology, 2021.
[4] Ahn SH et al., "Deep learning method for prediction of patient-specific dose distribution in breast cancer,” Radiation Oncology (2021) 16:154.
[5] Ma M et al., "Dose distribution prediction in isodose feature‐preserving voxelization domain using deep convolutional neural network,” Medical Physics 46(7):2978-2987, 2019.
[6] Murakami Y et al., "Fully automated dose prediction using generative adversarial networks in prostate cancer patients," PLoS ONE (2020) 15(5):e0232697.
[7] Isola, P., Zhu, J. Y., Zhou, T., & Efros, A. A. (2017). Image-to-image translation with conditional adversarial networks. In Proceedings of the IEEE conference on computer vision and pattern recognition (pp. 1125-1134).
[8] Stringfield O et al., "Multiparameter MRI predictors of long-term survival in glioblastoma multiforme," Tomography (2019) 5(1):135-144.
Figures