0526
Defining radiation target volumes for glioblastoma from predictions of tumor recurrence with AI and diffusion & metabolic MRI1Department of Radiology and Biomedical Imaging, University of California, San Francisco, San Francisco, CA, United States, 2UC Berkeley - UCSF Graduate Program in Bioengineering, University of California, San Francisco, San Francisco, CA, United States, 3Center for Intelligent Imaging, University of California, San Francisco, San Francisco, CA, United States, 4Department of Radiation Oncology, University of California, San Francisco, San Francisco, CA, United States, 5Department of Neurological Surgery, University of California, San Francisco, San Francisco, CA, United States
Synopsis
Keywords: Tumors, Radiotherapy
Using pre-radiotherapy anatomical, diffusion, and metabolic MRI from 42 patients newly-diagnosed with GBM, we first used Random Forest models to identify voxels that later exhibit either contrast-enhancing or T2 lesion progression. We then applied convolutional encoder-decoder neural networks to pre-radiotherapy imaging to segment subsequent tumor progression and found that the resulting predicted region better covered the actual tumor progression while sparing normal brain compared to the standard uniform 2cm expansion of the anatomical lesion to define the radiation target volume. This shows that multi-parametric MRI with deep learning has the potential to assist in future RT treatment planning.INTRODUCTION
Standard-of-care (SOC) treatment of glioblastoma (GBM) is maximal safe surgical resection, followed by external beam radiation therapy (RT) and adjuvant chemotherapy1,2. Current RT treatment planning involves purely a uniform 2cm isotropic expansion of the post-contrast T1-weighted and T2-weighted FLAIR MRI lesion volume to generate the clinical target treatment volumes without considering the spatial heterogeneity and infiltrative nature of the disease. This has the unintended consequences of undertreating subclinical disease as well as unnecessarily irradiating normal brain tissue, adversely affecting clinical outcome, and increasing toxicity3,4. Previous studies have shown that markers from physiologic and metabolic MRI can help identify voxels at risk for progression5,6. This study aims to use multi-parametric MRI with machine learning to predict regions of subsequent tumor progression and compare the resulting predicted maps to standard clinical 2cm uniform expansions of anatomical lesion volumes.METHODS
Subjects: 42 patients newly-diagnosed with GBM and scanned after surgical resection but before subsequent therapy were included in this study. 19 patients received SOC treatment plus concomitant Avastin and Tarceva (ATT), while 23 patients received SOC treatment and Enzastaurin (Enza).Image Acquisition: MR examinations were performed on a 3T GE Signa scanner using an eight-channel phased-array head coil. Standard anatomical imaging included T2-weighted-FLAIR and 3D T1-weighted IR-SPGR imaging pre- and post- the injection of a gadolinium-based contrast agent. Diffusion-tensor images (DTI) were obtained with b=1000s/mm2, 6 gradient directions and 4 excitations (TR/TE=1000/108ms, voxel size=1.7-2.0×1.7-2.0×2.0-3.0mm). Lactate-edited 3D 1H-MRSI were acquired using PRESS volume localization and VSS pulses for lipid signal suppression [excited-volume =80×80×40mm, TR=1100-1250ms, TE=144ms, overpress-factor=1.5, nominal voxel-size=1×1×1cm], flyback-echo-planar readout in SI, 988Hz sweep-width, and 712 dwell-points.
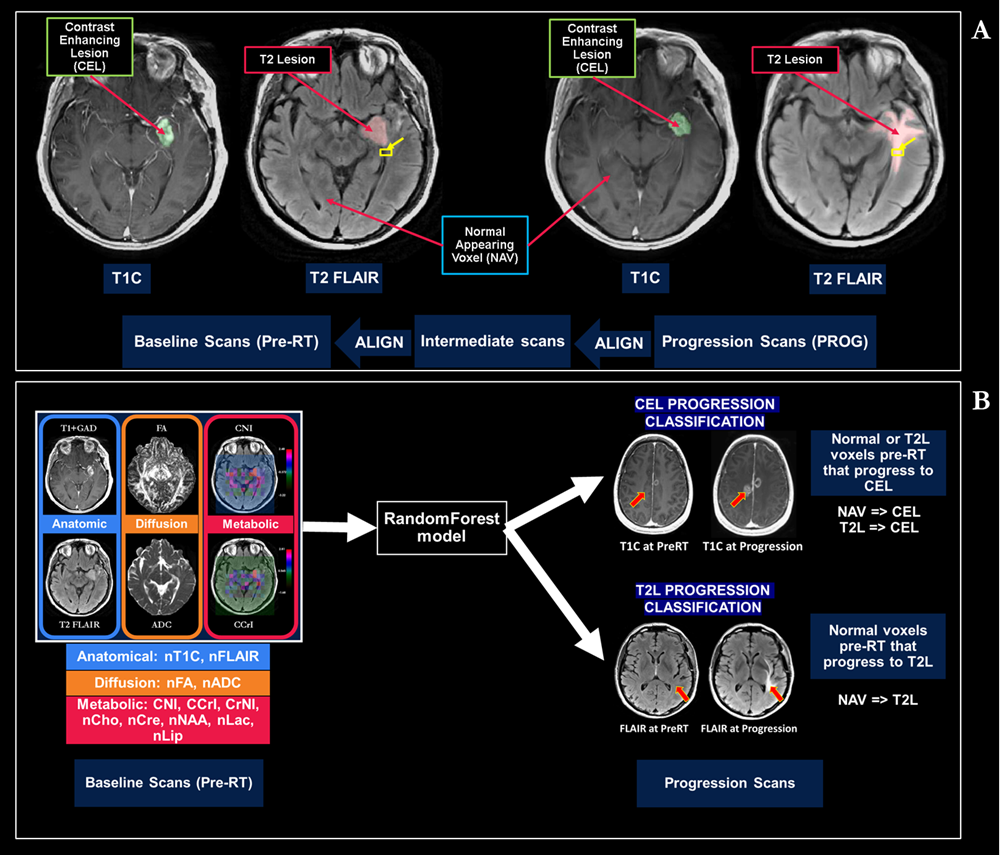
Processing: After aligning all baseline images and parametric maps to the T1-post-contrast images, anatomical images from the progression scan were rigidly aligned to the pre-RT exam, with additional non-rigid registration (Figure 1A) to a 2-month intermediate scan if tissue shift was present. All images and parametric maps were normalized to normal-appearing-white-matter and resampled to 3x3x3mm to account for alignment error. ROIs of the T2-lesion (T2L) and contrast-enhancing lesion (CEL) were semi-automatically segmented on both baseline and progression scans and subtracted to generate ROIs of progression within 4cm of the baseline T2L according to Figure 1A. All anatomical images and physiologic and metabolic maps quantified (Figure 1B) were normalized according to normal-appearing brain tissue.
Machine Learning: Random forest models predicting voxel-wise progression by either new contrast-enhancement or T2-hyperintensity (Figure 1B) were constructed and tested using 5-fold patient-wise-stratified-random-splitting with train/test ratio of 70/30%. Averaged ROC-AUC score was used to compare models. We then stratified patients by median progression time (11 months) and retrained our models for each group.
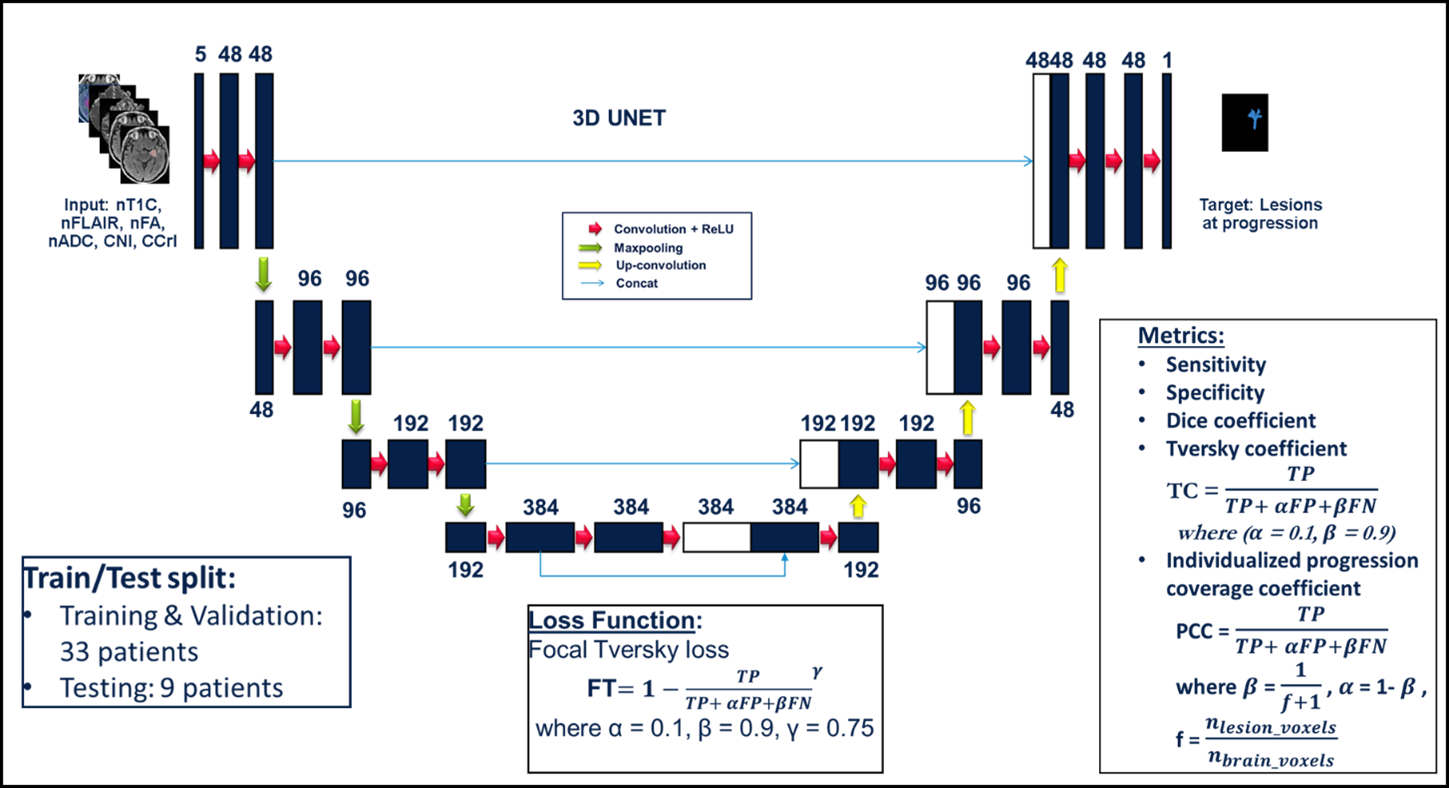
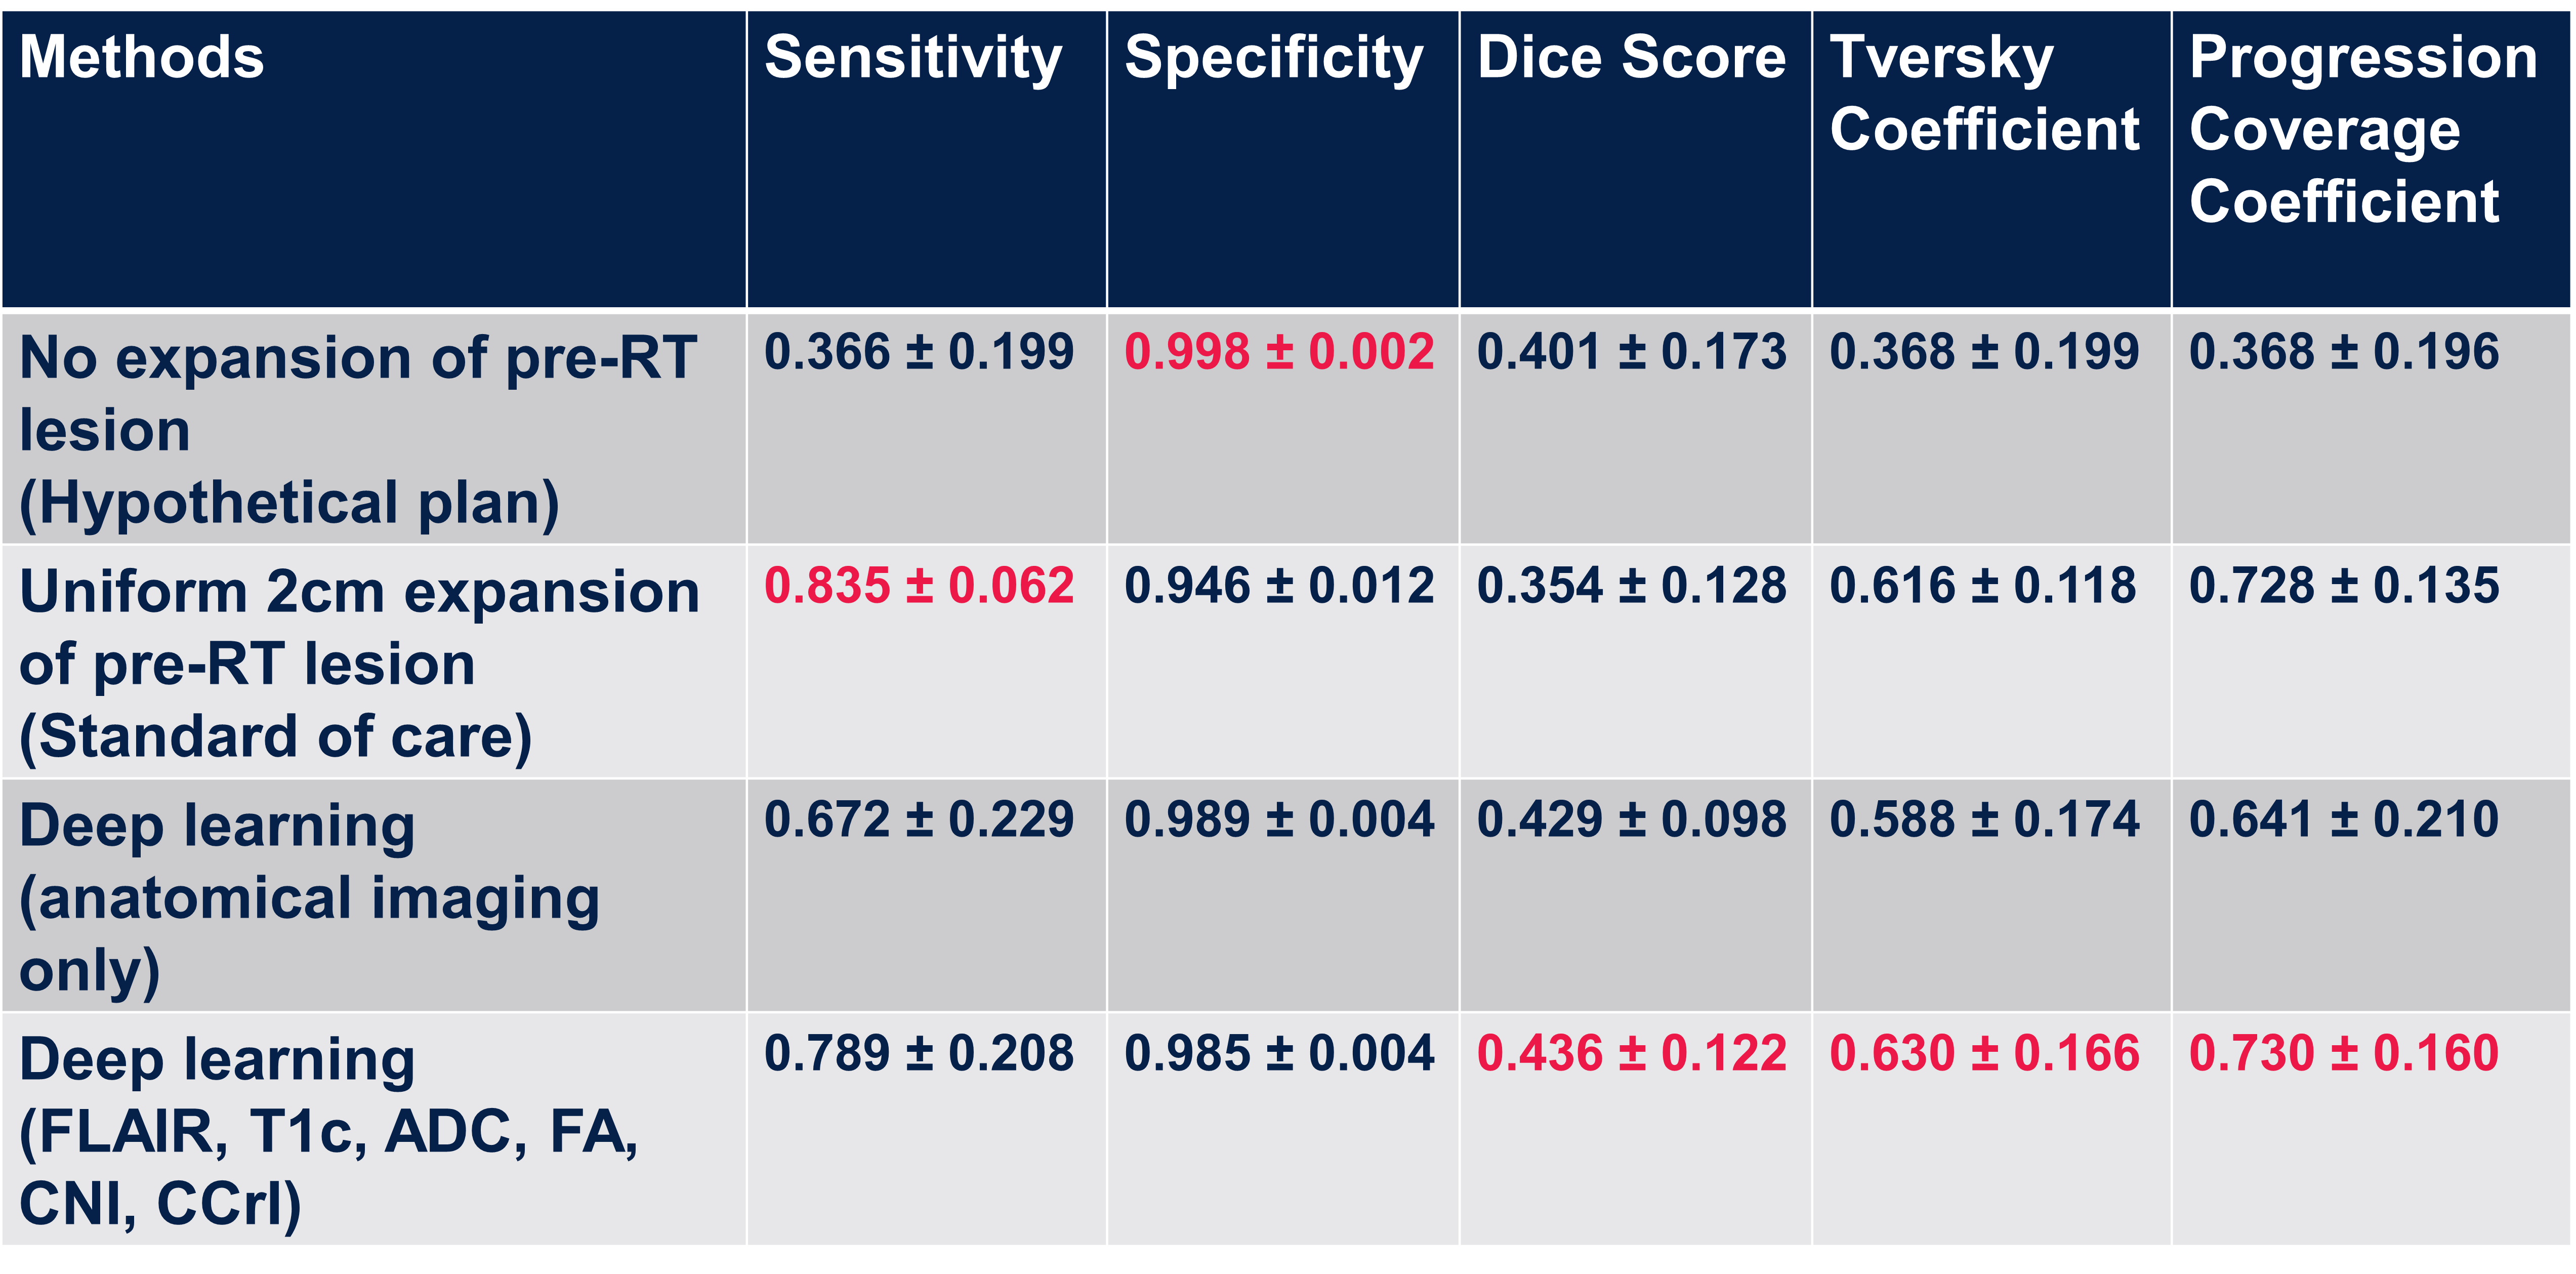
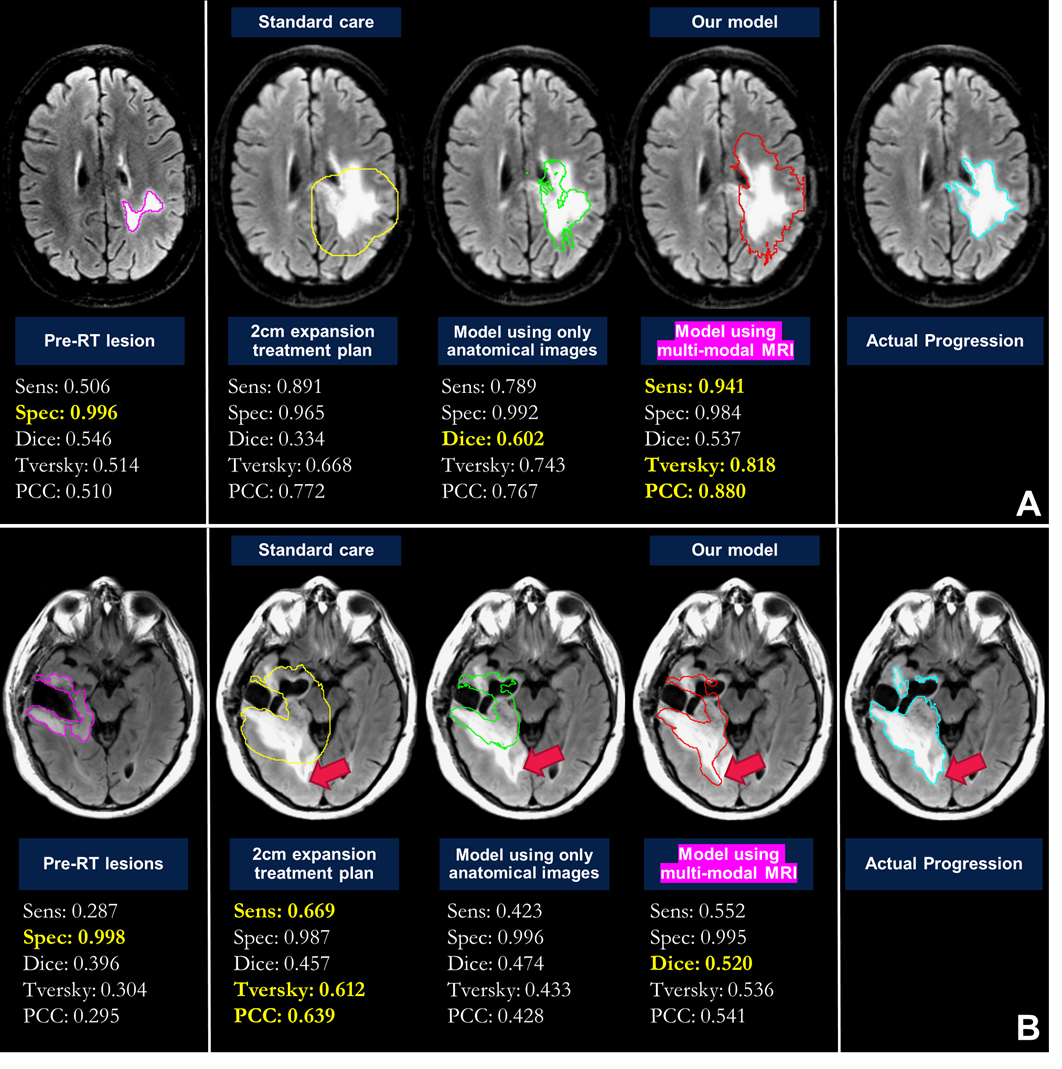
Deep learning: Maps of nADC, nFA, CNI, CCrI, and nFLAIR and tumor ROI from pre-RT scan were used as input for the convolutional encoder-decoder neural networks, a 3D 4-stages-UNET architecture7,8 (Figure 2). The output was the tumor ROI (including the CEL and T2L) at the progression time point. We trained the network using dice loss, Tversky loss, focal Tversky loss, and binary cross-entropy loss. The best performing model was obtained using focal Tversky loss with 5e-5 learning rate. Models were trained and validated on 33 patients and tested on the remaining 9 patients. Sensitivity, specificity, dice coefficient, Tversky coefficient (TC, Figure 2), and the newly derived Individualized progression coverage coefficient (PCC, Figure 2) between the model output and the ground truth progression were used to evaluate the deep learning model compared to: 1) a hypothetical treatment plan that only treats the pre-RT lesion; 2) the standard-of-care 2cm expansion of pre-RT lesion; and 3) the output of a separate model trained using only anatomical images.
RESULTS & DISCUSSION
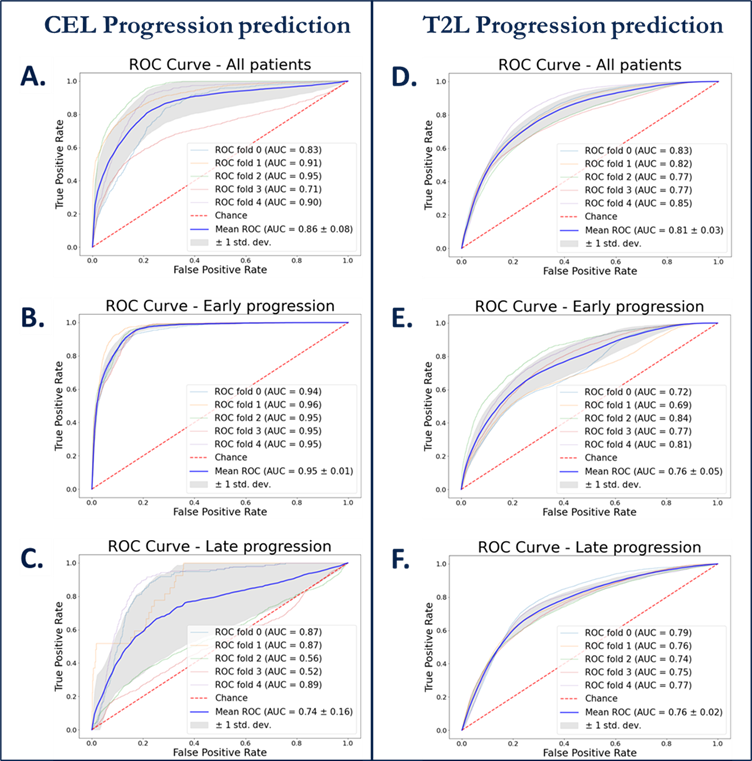
Machine learning: Figure 3 shows ROC curves for voxel-based predictions of CEL (A-C) and T2L (D-F) progression. Although similar performance was observed across time when predicting T2-lesion progression, the CEL model performed very well for patients who progressed before 11 months (AUC=0.95), but performed poorly (AUC=.074) for patients who progressed later. This suggests that time to progression should be accounted for in subsequent modeling. While baseline choline, creatine, and NAA were all relevant in predicting either type of progression, ADC and lipid were relevant only in CEL progression and baseline T2-FLAIR for only T2L progression.Deep learning: Figure 4 summarizes the results of all models. The SOC 2cm expansion achieves the highest sensitivity but also the lowest specificity, overtreating the normal-appearing brain. Our deep learning model outperformed all other target volumes covering the progressed lesion, with the highest Dice, Tversky, and PCC scores. Visual comparison of resulting target volumes in 2 example patients are shown in Figure 5, with our model performing the best at covering the extent of progression.
CONCLUSION
This study demonstrated the feasibility of using pre-treatment diffusion-weighted and metabolic MRI with machine learning to predict future regions of tumor progression. CEL progression was more challenging to predict with a longer time from treatment, suggesting that time to progression should be added in subsequent modeling. Our deep learning model using multi-parametric MRI performed better than the current practice of uniform 2cm expansion for RT treatment planning and no expansion, suggesting that multi-parametric MRI with deep learning predictive model has the potential to improve RT treatment planning.Acknowledgements
-UCSF Cancer League and Helen Diller Family Comprehensive Cancer Center
-Noyce Initiative - UCSF Initiative for Digital Transformation in Computational Biology & Health Data Science Fellowship
References
[1] Wen PY, Kesari S. Malignant gliomas in adults. New England Journal of Medicine. 2008; 359(5):492-507
[2] Simpson JR, Horton J, Scott C, et al. Influence of location and extent of surgical resection on survival of patients with glioblastoma multiforme: Results of three consecutive radiation therapy oncology group (RTOG) clinical trials. International Journal of Radiation Oncology, Biology, Physics. 1993; 26(2):239-244.
[3] Stummer W, Reulen H-J, Meinel T, et al. Extent of Resection and Survival in Glioblastoma Multiforme: Identification of and Adjustment for Bias. Neurosurgery. 2008; 62(3):564-576.
[4] Park I, Tamai G, Lee MC, Chuang CF, Chang SM, Berger MS, Nelson SJ, Pirzkall A. Patterns of recurrence analysis in newly diagnosed glioblastoma multiforme after three-dimensional conformal radiation therapy with respect to pre-radiation therapy magnetic resonance spectroscopic findings. Int J Radiat Oncol Biol Phys 2007;69(2):381-389.
[5] Rapp M, Baernreuther J, Turowski B, Steiger HJ, Sabel M, Kamp MA. Recurrence Pattern Analysis of Primary Glioblastoma. World Neurosurg. 2017 Jul;103:733-740.
[6] Anwar, M. et al. Identifying voxels at risk for progression in glioblastoma based on dosimetry, physiologic and metabolic MRI. Radiat Res 188, 303–313 (2017).
[7] Çiçek, O., Abdulkadir, A., Lienkamp, S.S., Brox, T., Ronneberger, O.: 3D U-Net: learning dense volumetric segmentation from sparse annotation. Proc. International Conference on Medical Image Computing and Computer-Assisted Intervention (MICCAI), Springer (2016), pp. 424-432, 10.1007/978-3-319-46723-8_49
[8]
Henry, T., Carre, A., Lerousseau, M., Estienne, T., Robert, C., Paragios, N.,
& Deutsch, E., 2020. Top 10 BraTS 2020 challenge solution: Brain tumor
segmentation with self-ensembled, deeply supervised 3D-Unet like neural
networks. arXiv:2011.01045
Figures