0520
Predicting FDG PET from Multi-contrast MRIs using Deep Learning in Patients with Brain Neoplasms1Stanford University, Stanford, CA, United States, 2National Taiwan University, Taipei, Taiwan
Synopsis
Keywords: Machine Learning/Artificial Intelligence, PET/MR
PET is a widely used imaging technique, but it requires exposing subjects to radiation and is not offered in the majority of medical centers in the world. Here, we proposed to synthesize FDG-PET images from multi-contrast MR images using a U-Net-based network with attention modules and transformer blocks. The experiments on a dataset with 87 brain lesions in 59 patients demonstrated that the proposed method was able to generate high-quality PET from MR images without the need for radiotracer injection. We also demonstrate methods to handle potential missing or corrupted sequences.Introduction
Positron emission tomography (PET) is a widely used molecular imaging technique with many clinical applications, including tumor detection. To obtain high-quality images, the amount of injected radiotracer in current protocols leads to the risks associated with radiation exposure in scanned subjects. Moreover, PET is expensive and not offered in the majority of medical centers in the world while MRI is a more widely available and non-invasive technique. Therefore, it is of great value to achieve zero-dose PET reconstruction, meaning synthesizing high-resolution and diagnostic-quality PET from multi-contrast MRIs.Methods
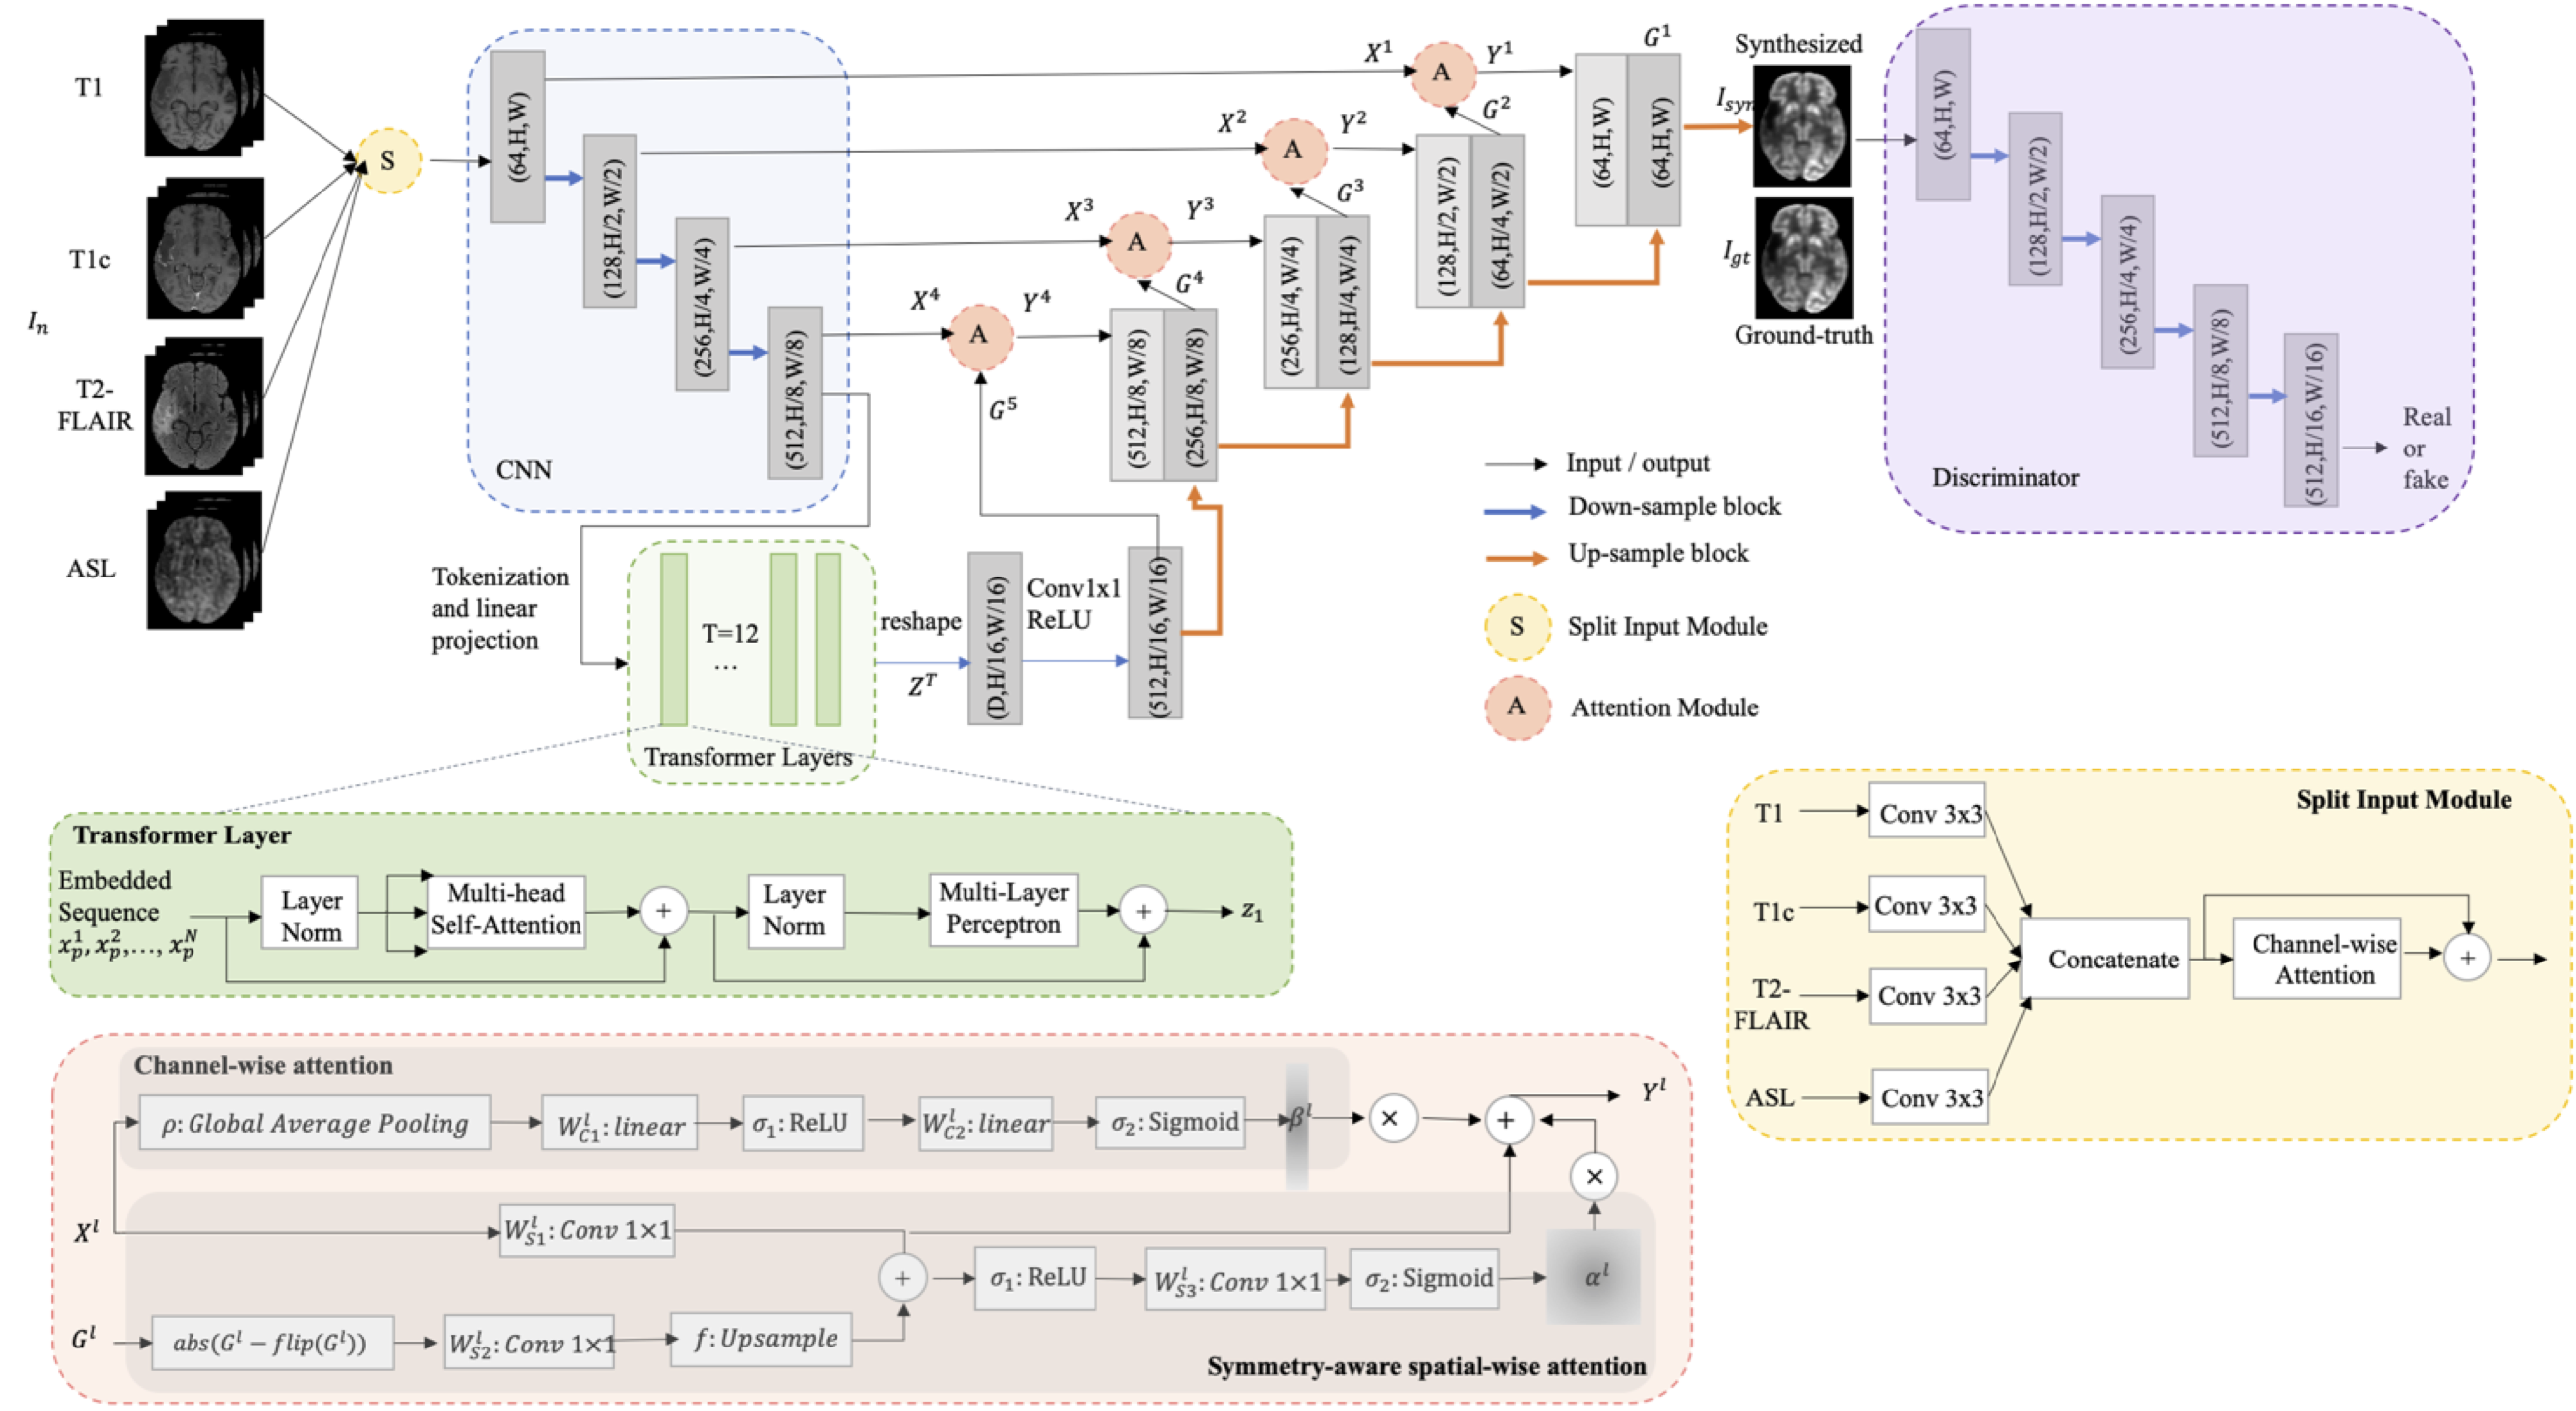
Data Acquisition and Preprocessing: With retrospective IRB approval, 59 patients who underwent either contemporaneous or simultaneous 18F-FDG PET and MRI (T1-weighted (T1), T1-weighted with contrast (T1c), T2 fluid-attenuated inversion recovery (T2-FLAIR), and arterial spin labeling (ASL)) ordered as part of clinical care for the purpose of determining residual or recurrent brain tumor (glioma or metastasis) were included in this study. ASL was first co-registered to PET. Then all images were co-registered to T1, placed in standard template space, and padded to the size of 192 x 160 x 156. Intensities of the volumes was normalized by dividing by the mean of the non-zero regions. The top and bottom 20 slices were omitted. Three adjacent slices from each MR contrast were concatenated as the input. Random flipping of brain hemispheres was used as augmentation during training. Case-wise 5-fold cross-validation was conducted with 10% of the training cases used for validation.Model: As shown in Figure 1, a 2.5D U-Net [1] worked as the backbone, with four components added on top of it. First, a split-input module was developed to better utilize multi-contrast inputs, enhancing the important channels and suppressing redundant information. Second, spatial-wise attention [2] and channel-wise attention modules [3] were added on the shortcuts to leverage detailed high-resolution spatial information. Note, the spatial-wise attention module was specially designed for brain neoplasm by taking advantage of the asymmetry of the left and the right lobe to detect abnormalities. Lastly, Transformer blocks [4] were added at the end of the encoder to utilize global context information. Moreover, a discriminator was included for adversarial training to synthesize visually realistic PET images.
Evaluation: The “zero-dose” synthesized PET images were evaluated with image quality metrics (peak signal-to-noise ratio (PSNR), structural similarity (SSIM), and root mean square error (RMSE)) measured in both whole brain and tumor ROIs, which were automatically segmented by a pre-trained CNN model. Three board-certified physicians scored image quality on a five-point Likert scale (1=poor, 5=excellent) and performed a clinical task to determine the presence of viable tumors (87 lesions in total). Statistical analysis was conducted to evaluate the reader agreement of image quality and tumor recurrence on the actual and synthesized PET.
Results
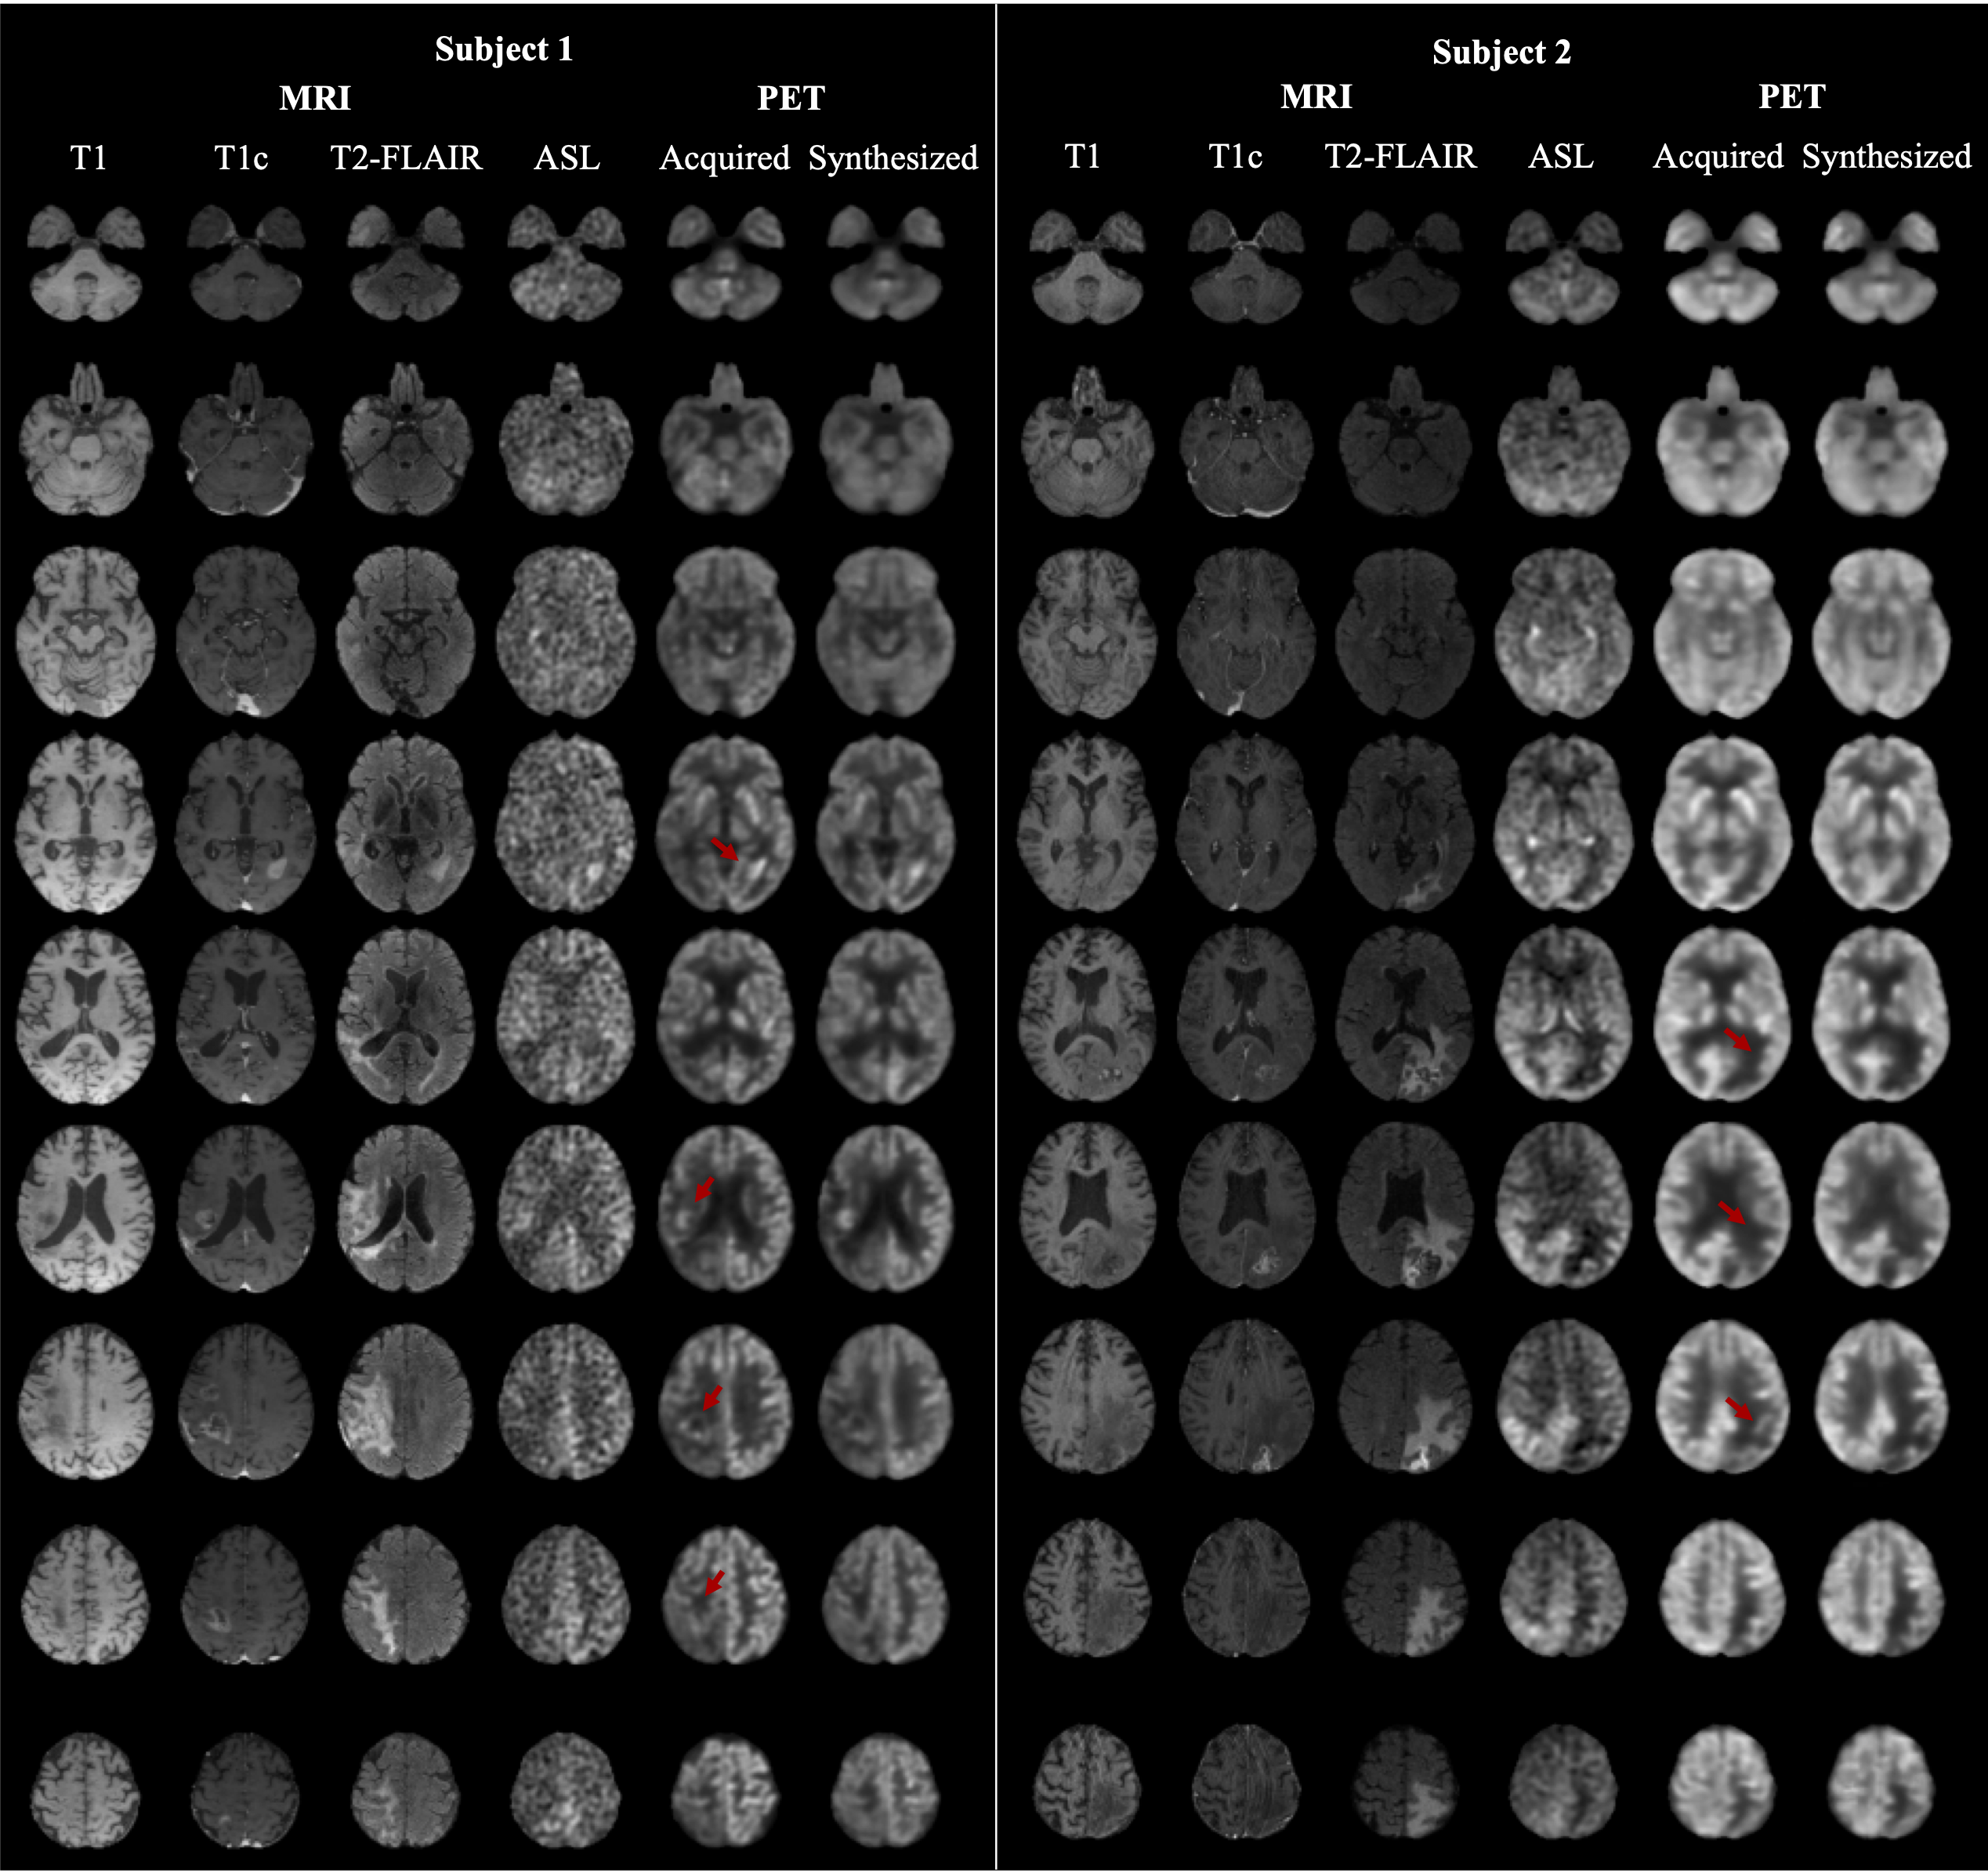
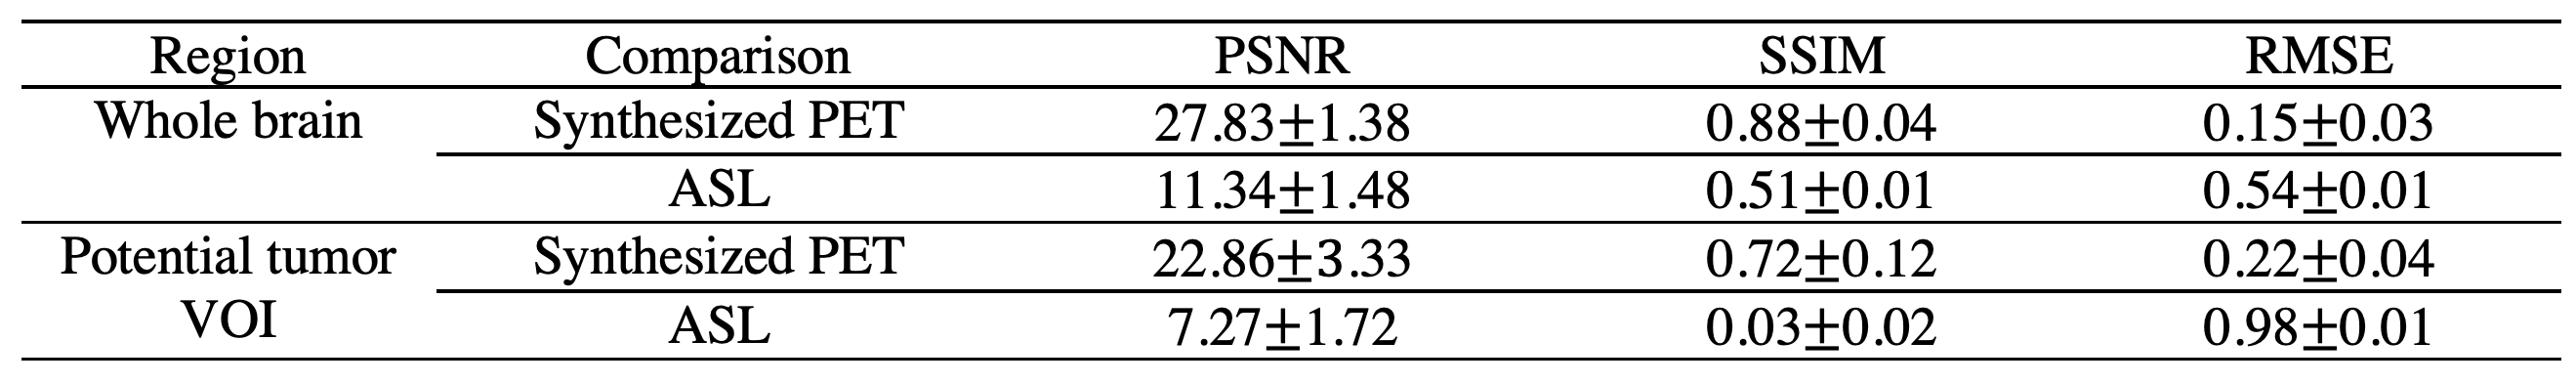
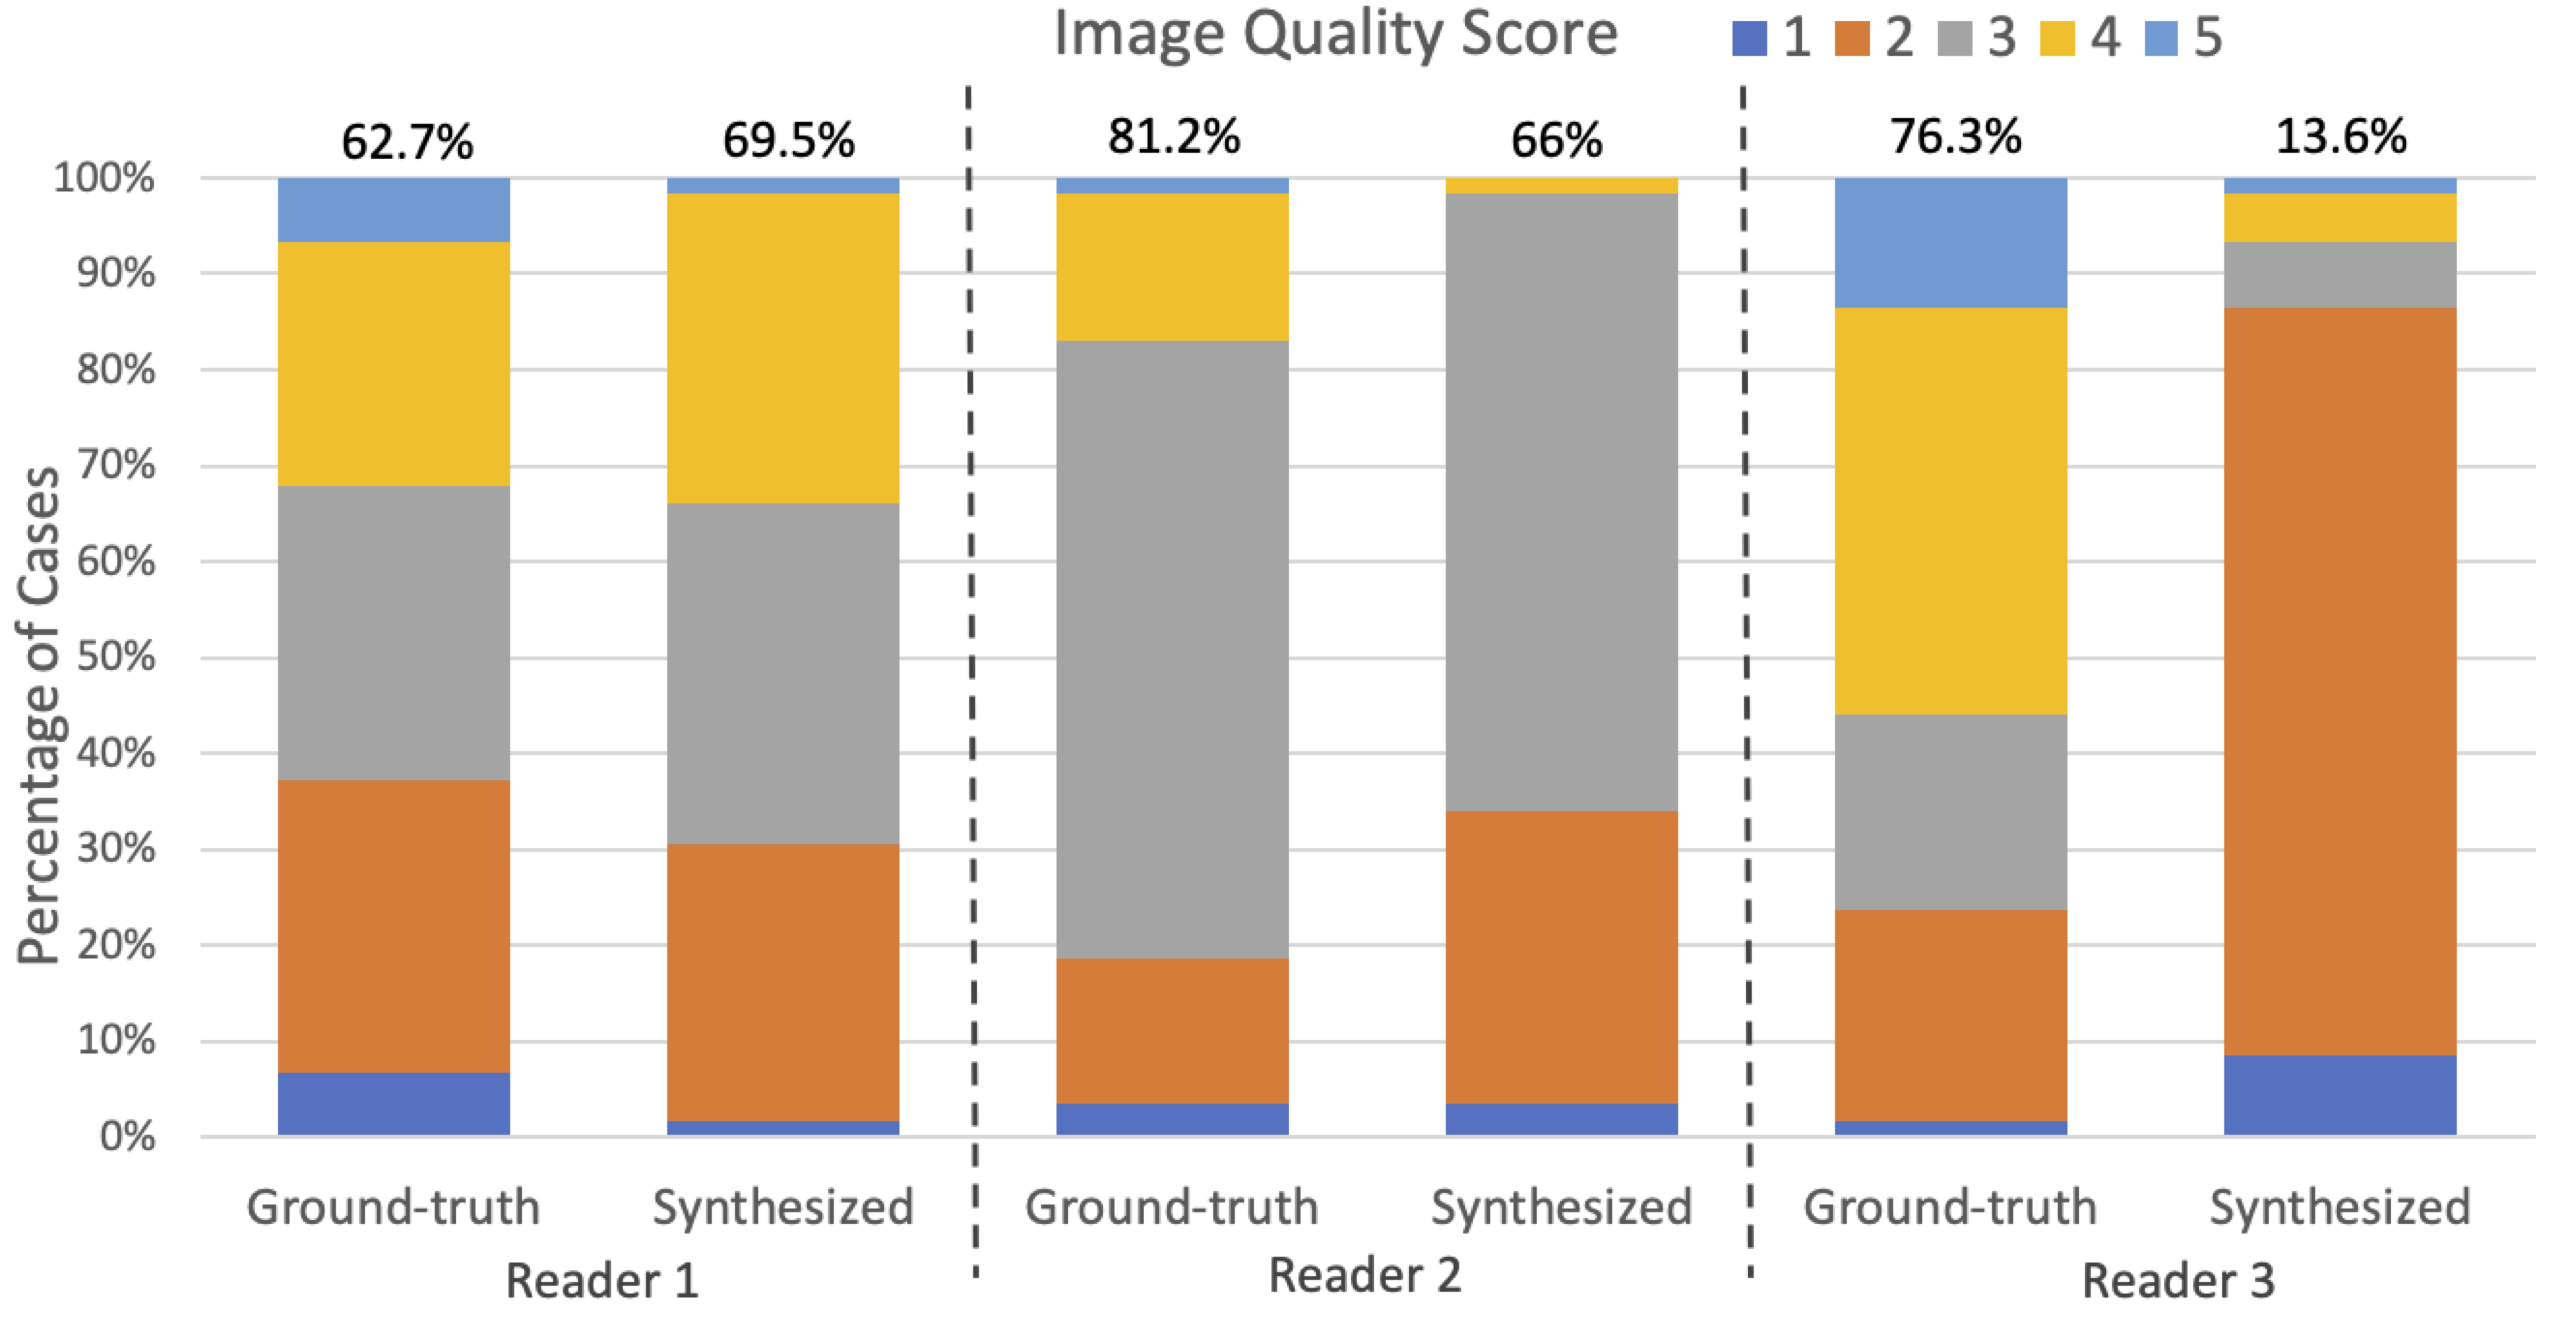
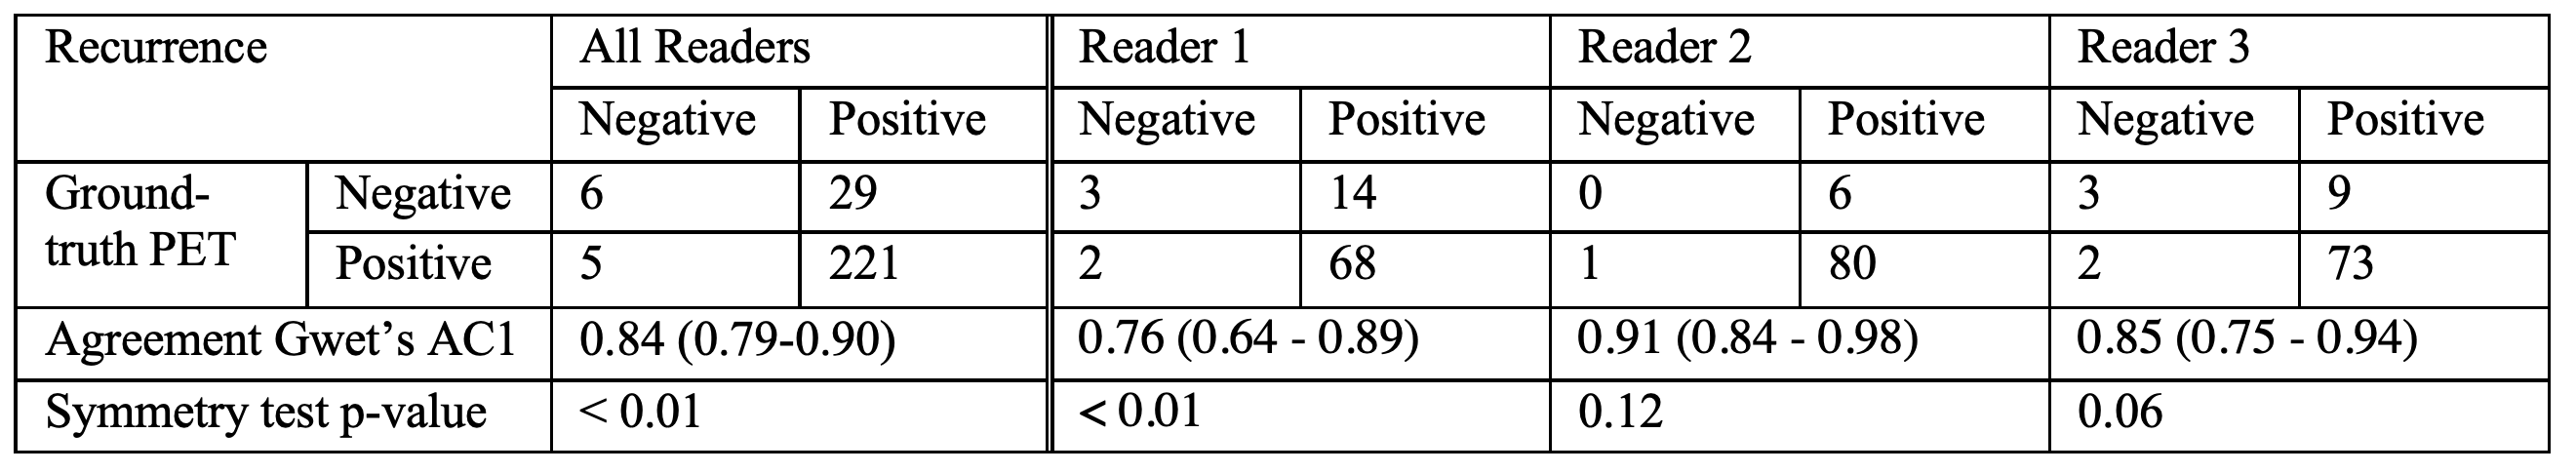
Qualitatively, as illustrated by multiple slices from two representative subjects in Figure 2, the synthesized images visually resembled the ground-truth PET. Quantitatively, as shown in Figure 3, the synthesized PET showed marked improvement (PSNR of 27.83 and SSIM of 0.88) in image quality compared with ASL (PSNR of 11.34 and SSIM of 0.51). This performance gap increased when evaluating on potential tumor VOIs, where ASL was not able to resemble structural abnormality (SSIM of 0.03). For clinical readings on the quality score (Figure 4), there is no significant difference between the agreement among readers on ground-truth and synthesized PET (p-value = 0.14). Reader 3 tended to be an outlier who strongly preferred the ground-truth PET, while the other two readers had the percentage of satisfied quality (i.e., quality score >= 3) of 62.7% vs. 69.5% and 81.2% vs. 66.1%, respectively for the ground-truth vs. the synthesized PET. For clinical readings on recurrence, 255 of 261 readings on the ground-truth PET were scored as positive. Among readers, agreement on ground-truth and synthesized PET was high. Confusion matrices for all readers are shown in Figure 5. Three readers achieved an overall accuracy of 87.0%. However, there was an asymmetry on the readings with a tendency that the lesions on synthesized PET were scored as more likely to represent recurrence, which was primarily caused by the overcalling of reader 1.Discussion
Compared with ASL, the synthesized PET had higher similarity to the ground-truth PET on the whole brain and the abnormality. Reading results on the quality score suggested readers have preferences for the ground-truth PET, but the inter-reader agreement is low; thus, more readers may be needed to make a firm conclusion on image quality. Despite the skewed distribution of recurrence, the reading results suggested good diagnostic quality of the synthesized PET, though the readers had a tendency to overcall recurrence on synthetic PET.Conclusion
We propose a U-Net-based network with several novel components to synthesize FDG PET from multi-contrast MRIs. The quality metrics and the reader study illustrate the potential of synthesizing diagnostic quality FDG-PET images without the use of radiotracers.Acknowledgements
This work was supported by funding from the National Institute of Health R01-NS123025.References
1. Ronneberger, Olaf, Philipp Fischer, and Thomas Brox. "U-net: Convolutional networks for biomedical image segmentation." International Conference on Medical image computing and computer-assisted intervention. Springer, Cham, 2015.
2. Oktay, Ozan, et al. "Attention u-net: Learning where to look for the pancreas." Proceedings of the IEEE Medical Imaging with Deep Learning. 2018.
3. Hu, Jie, Li Shen, and Gang Sun. "Squeeze-and-excitation networks." Proceedings of the IEEE conference on computer vision and pattern recognition. 2018.
4. Chen, Jieneng, et al. "Transunet: Transformers make strong encoders for medical image segmentation." arXiv preprint arXiv:2102.04306 (2021).
Figures