0519
Two-Stage Deep Learning with Multi-Pathway Network for Brain Tumor Segmentation and Malignancy Identification From MR Images1Yonsei University, SEOUL, Korea, Republic of, 2Sejong Univiersity, Seoul, Korea, Republic of, 3Seoul National University Hospital, Seoul, Korea, Republic of
Synopsis
Keywords: Tumors, Brain
Accurately segmenting contrast-enhancing brain tumors plays an important role in surgical planning of high-grade gliomas. Also, precisely stratifying malignancy risk within non-enhancing T2 hyperintense area helps control the radiation dose according to the malignancy risk and prevent normal brain tissue from being unnecessarily exposed to radiation. In this work, we 1) segment brain tumors using deep learning, and 2) provide more detailed segmentation results that can show the malignancy risk within the T2 high region. We utilize a two-stage framework where we make images with restricted ROI through foreground cropping so that the model can focus on only tumor part.Introduction
Following the surgical excision of contrast-enhancing tumors, radiation therapy is usually administered to treat residual infiltrative tumor cells within non-enhancing T2 hyperintense areas in high-grade gliomas1. Thus, it is crucial to accurately differentiate high-grade tumor clusters (with high malignancy risk) from low-grade or edema components (with relatively lower malignancy risk) among the non-enhancing T2 hyperintense area in order to improve the efficiency of radiation treatment, while minimizing radiation-induced side effects due to unwanted radiation exposure to the normal tissue. Conventional thresholding methods may be used to decide the malignancy risk within the non-enhancing T2 hyperintense area. However, such approaches show a lot of failure at the boundary of the Edema (ED) region as shown in the second column of Fig 4, which results in laborious manual corrections to the clinicians. To tackle this deficiency, we propose a two-stage framework that can show the level of tumor malignancy using Fluid-Attenuated Inversion Recovery (FLAIR), T1 Contrast-Enhanced (T1CE), Apparent Diffusion Coefficient (ADC), and Cerebral Blood Volume (CBV). This can assist to irradiate an appropriate amount of radiation according to the malignancy risk when performing radiation therapy for the residual non-enhancing T2 hyperintense area.Methods
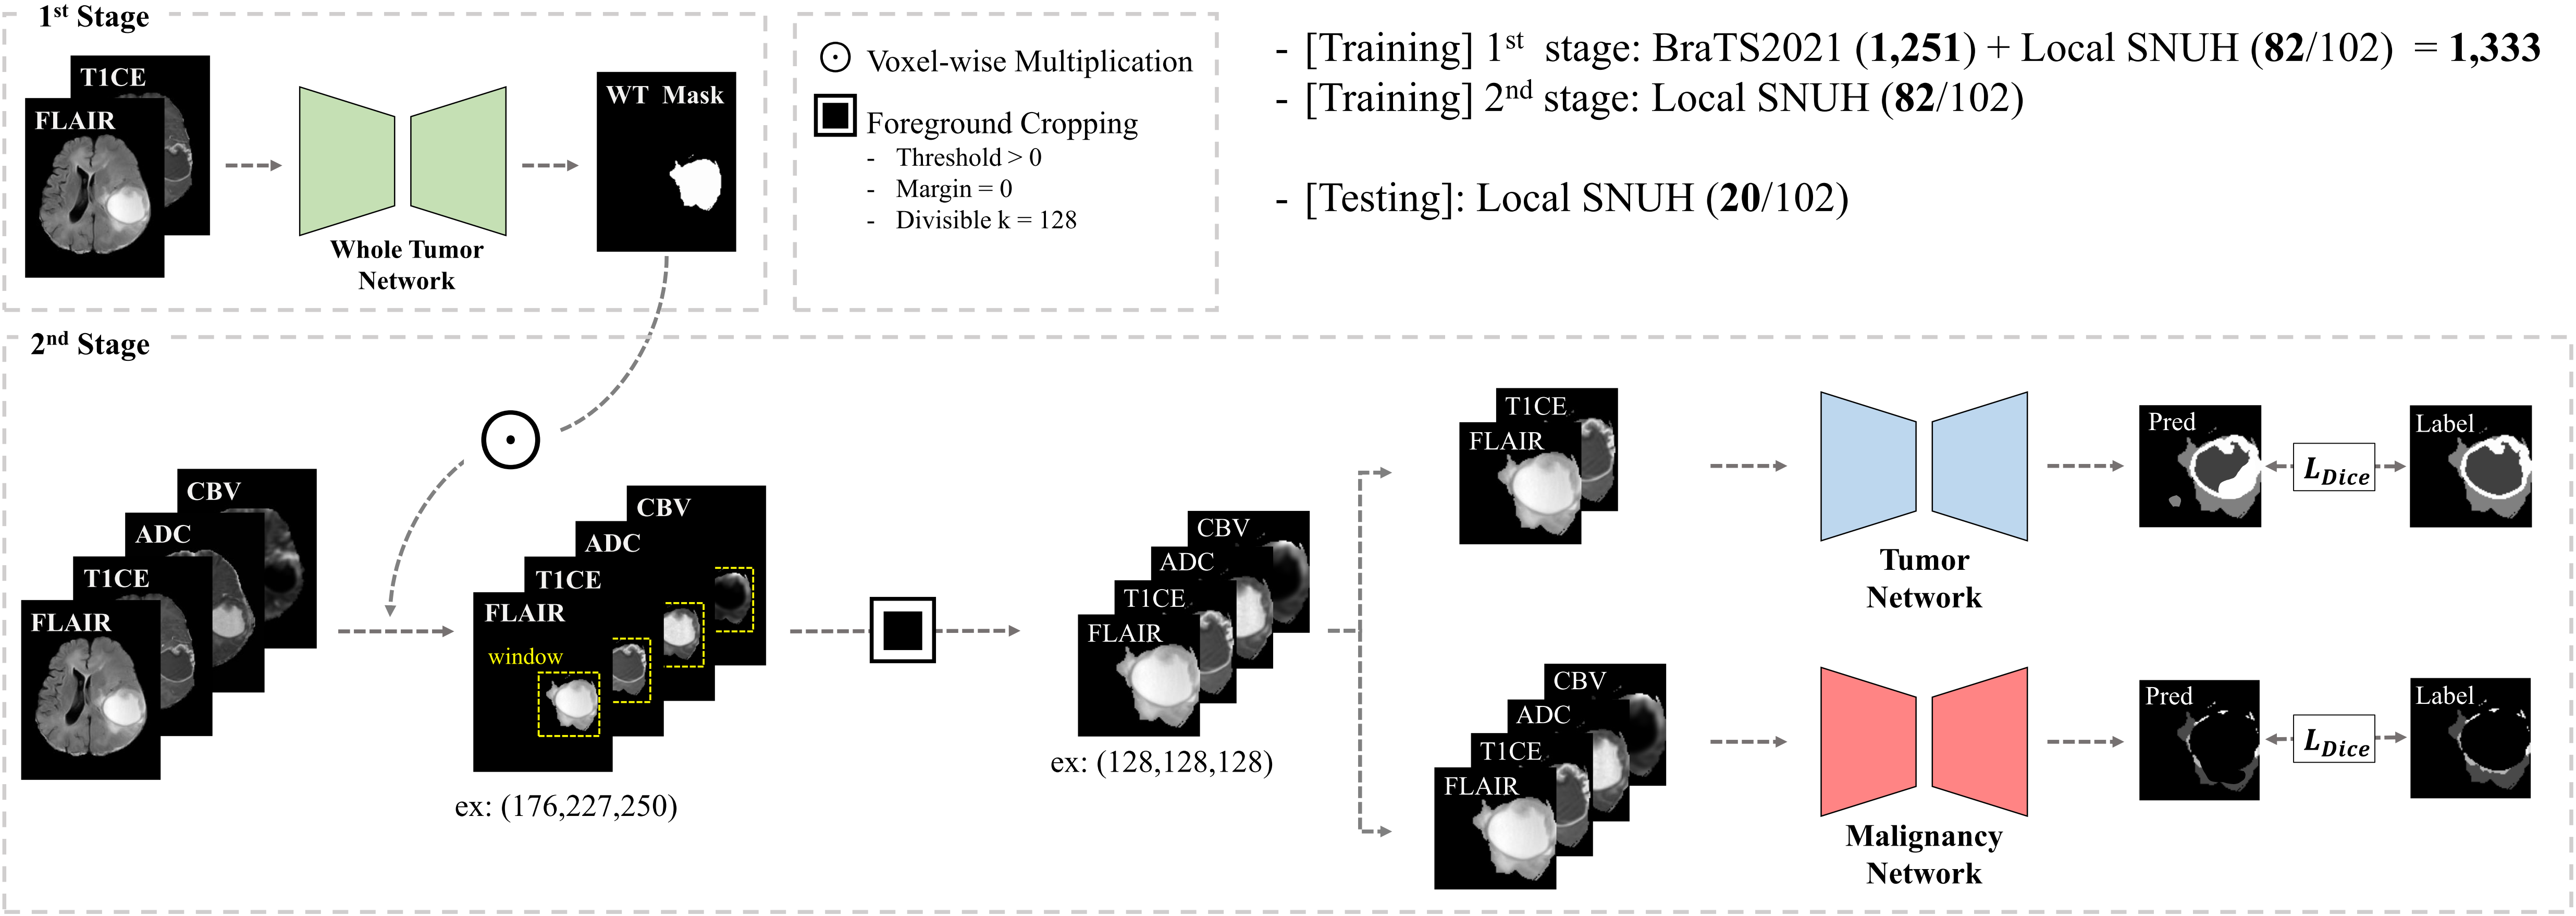
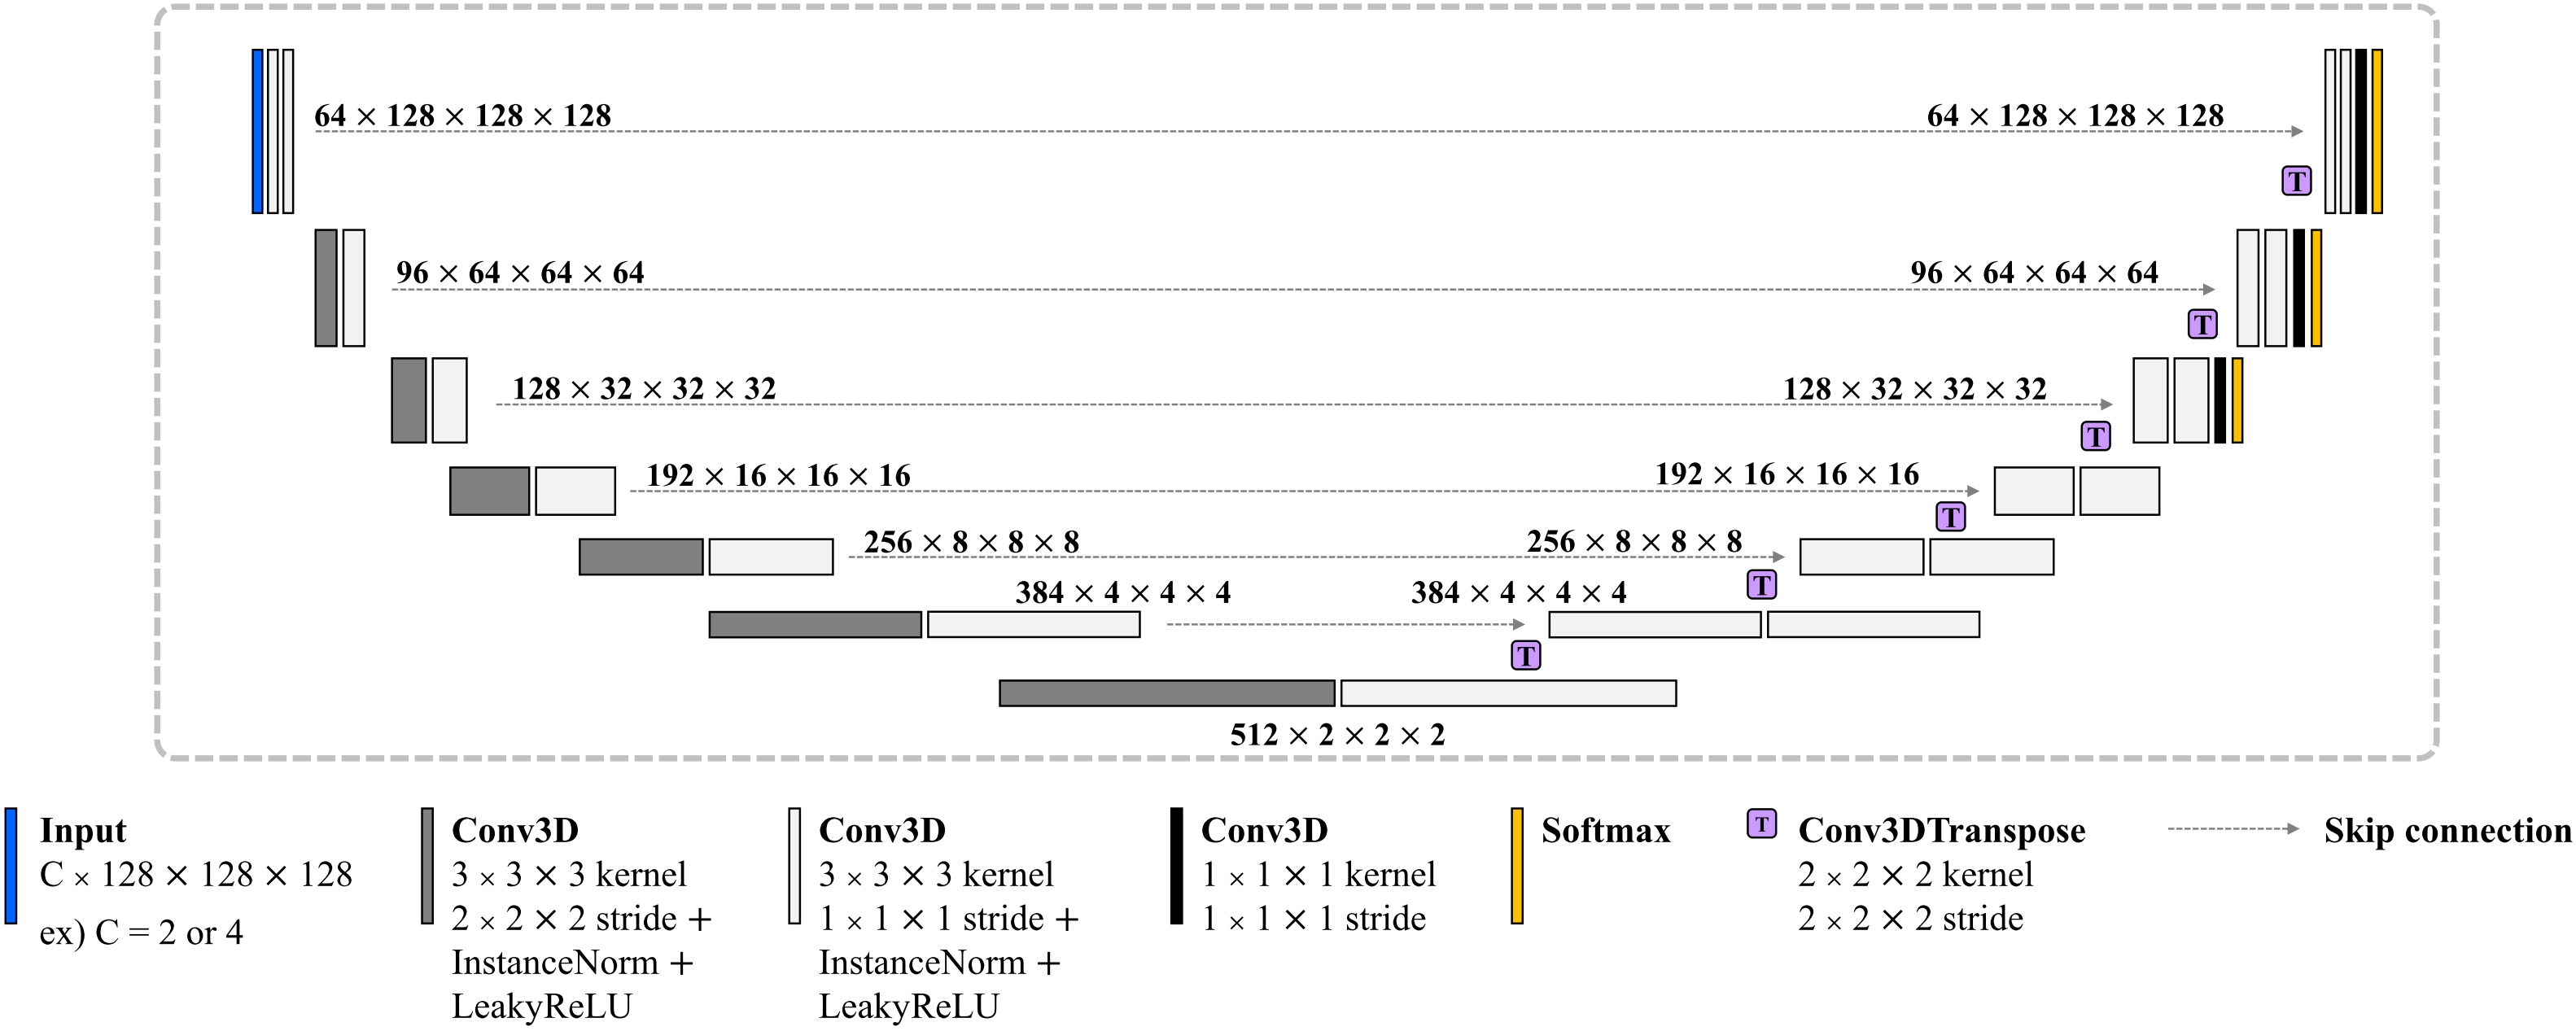
[Proposed Framework]We designed a two-stage framework to segment not only brain tumors but also their malignancy. To this end, we trained the first stage network (NWT) to predict only the Whole Tumor (WT) region using FLAIR and T1CE, which have the most informative information about the tumor2. The input images of the second stage are voxel-wisely multiplied with the segmented WT mask. After that, we set the window size to 128 and crop the foreground of the images so that the network can better focus on the tumor. Note that FLAIR and T1CE are utilized as inputs to the tumor network (NTU), while FLAIR, T1CE, ADC, and CBV are used as inputs to the malignancy network (NMAL). We normalized all 3D input images utilizing zero mean and unit standard deviation. Note that ADC and CBV images were employed as additional inputs of NMAL because they have beneficial features in determining the malignancy risk within the T2 high region3. An overview of the proposed two-stage framework and the employed dataset are illustrated in Fig 1. The proposed framework employed a total of three networks: NWT, NTU, and NMAL, which have the same structure except for the number of input channels. We used an optimized nnU-Net, which has shown excellent performance in the recent segmentation tasks. In addition, the deep supervision concept4 is applied to the last three resolutions of each decoder. A detailed description of the network structure is presented in Fig 2.
Results
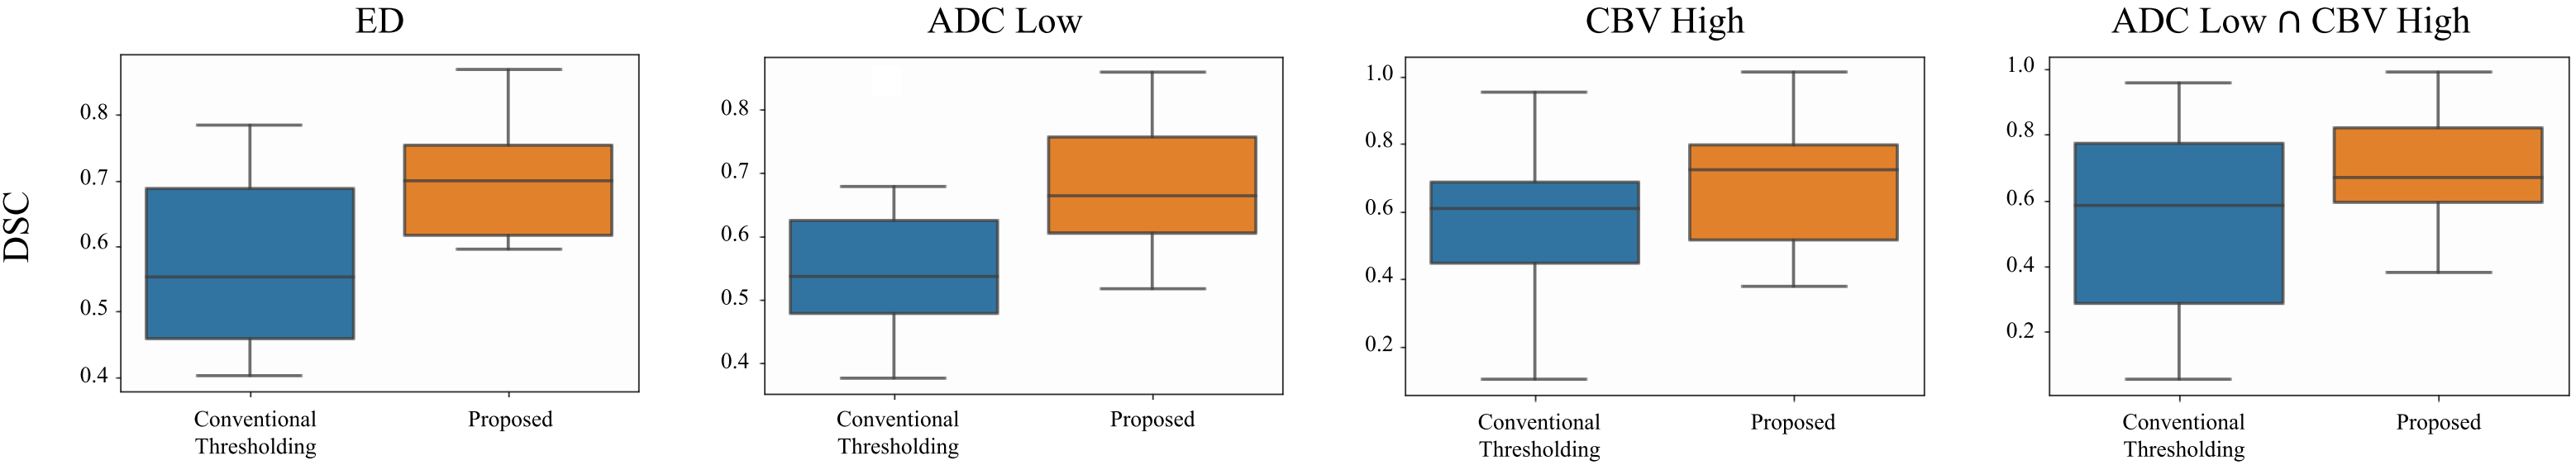
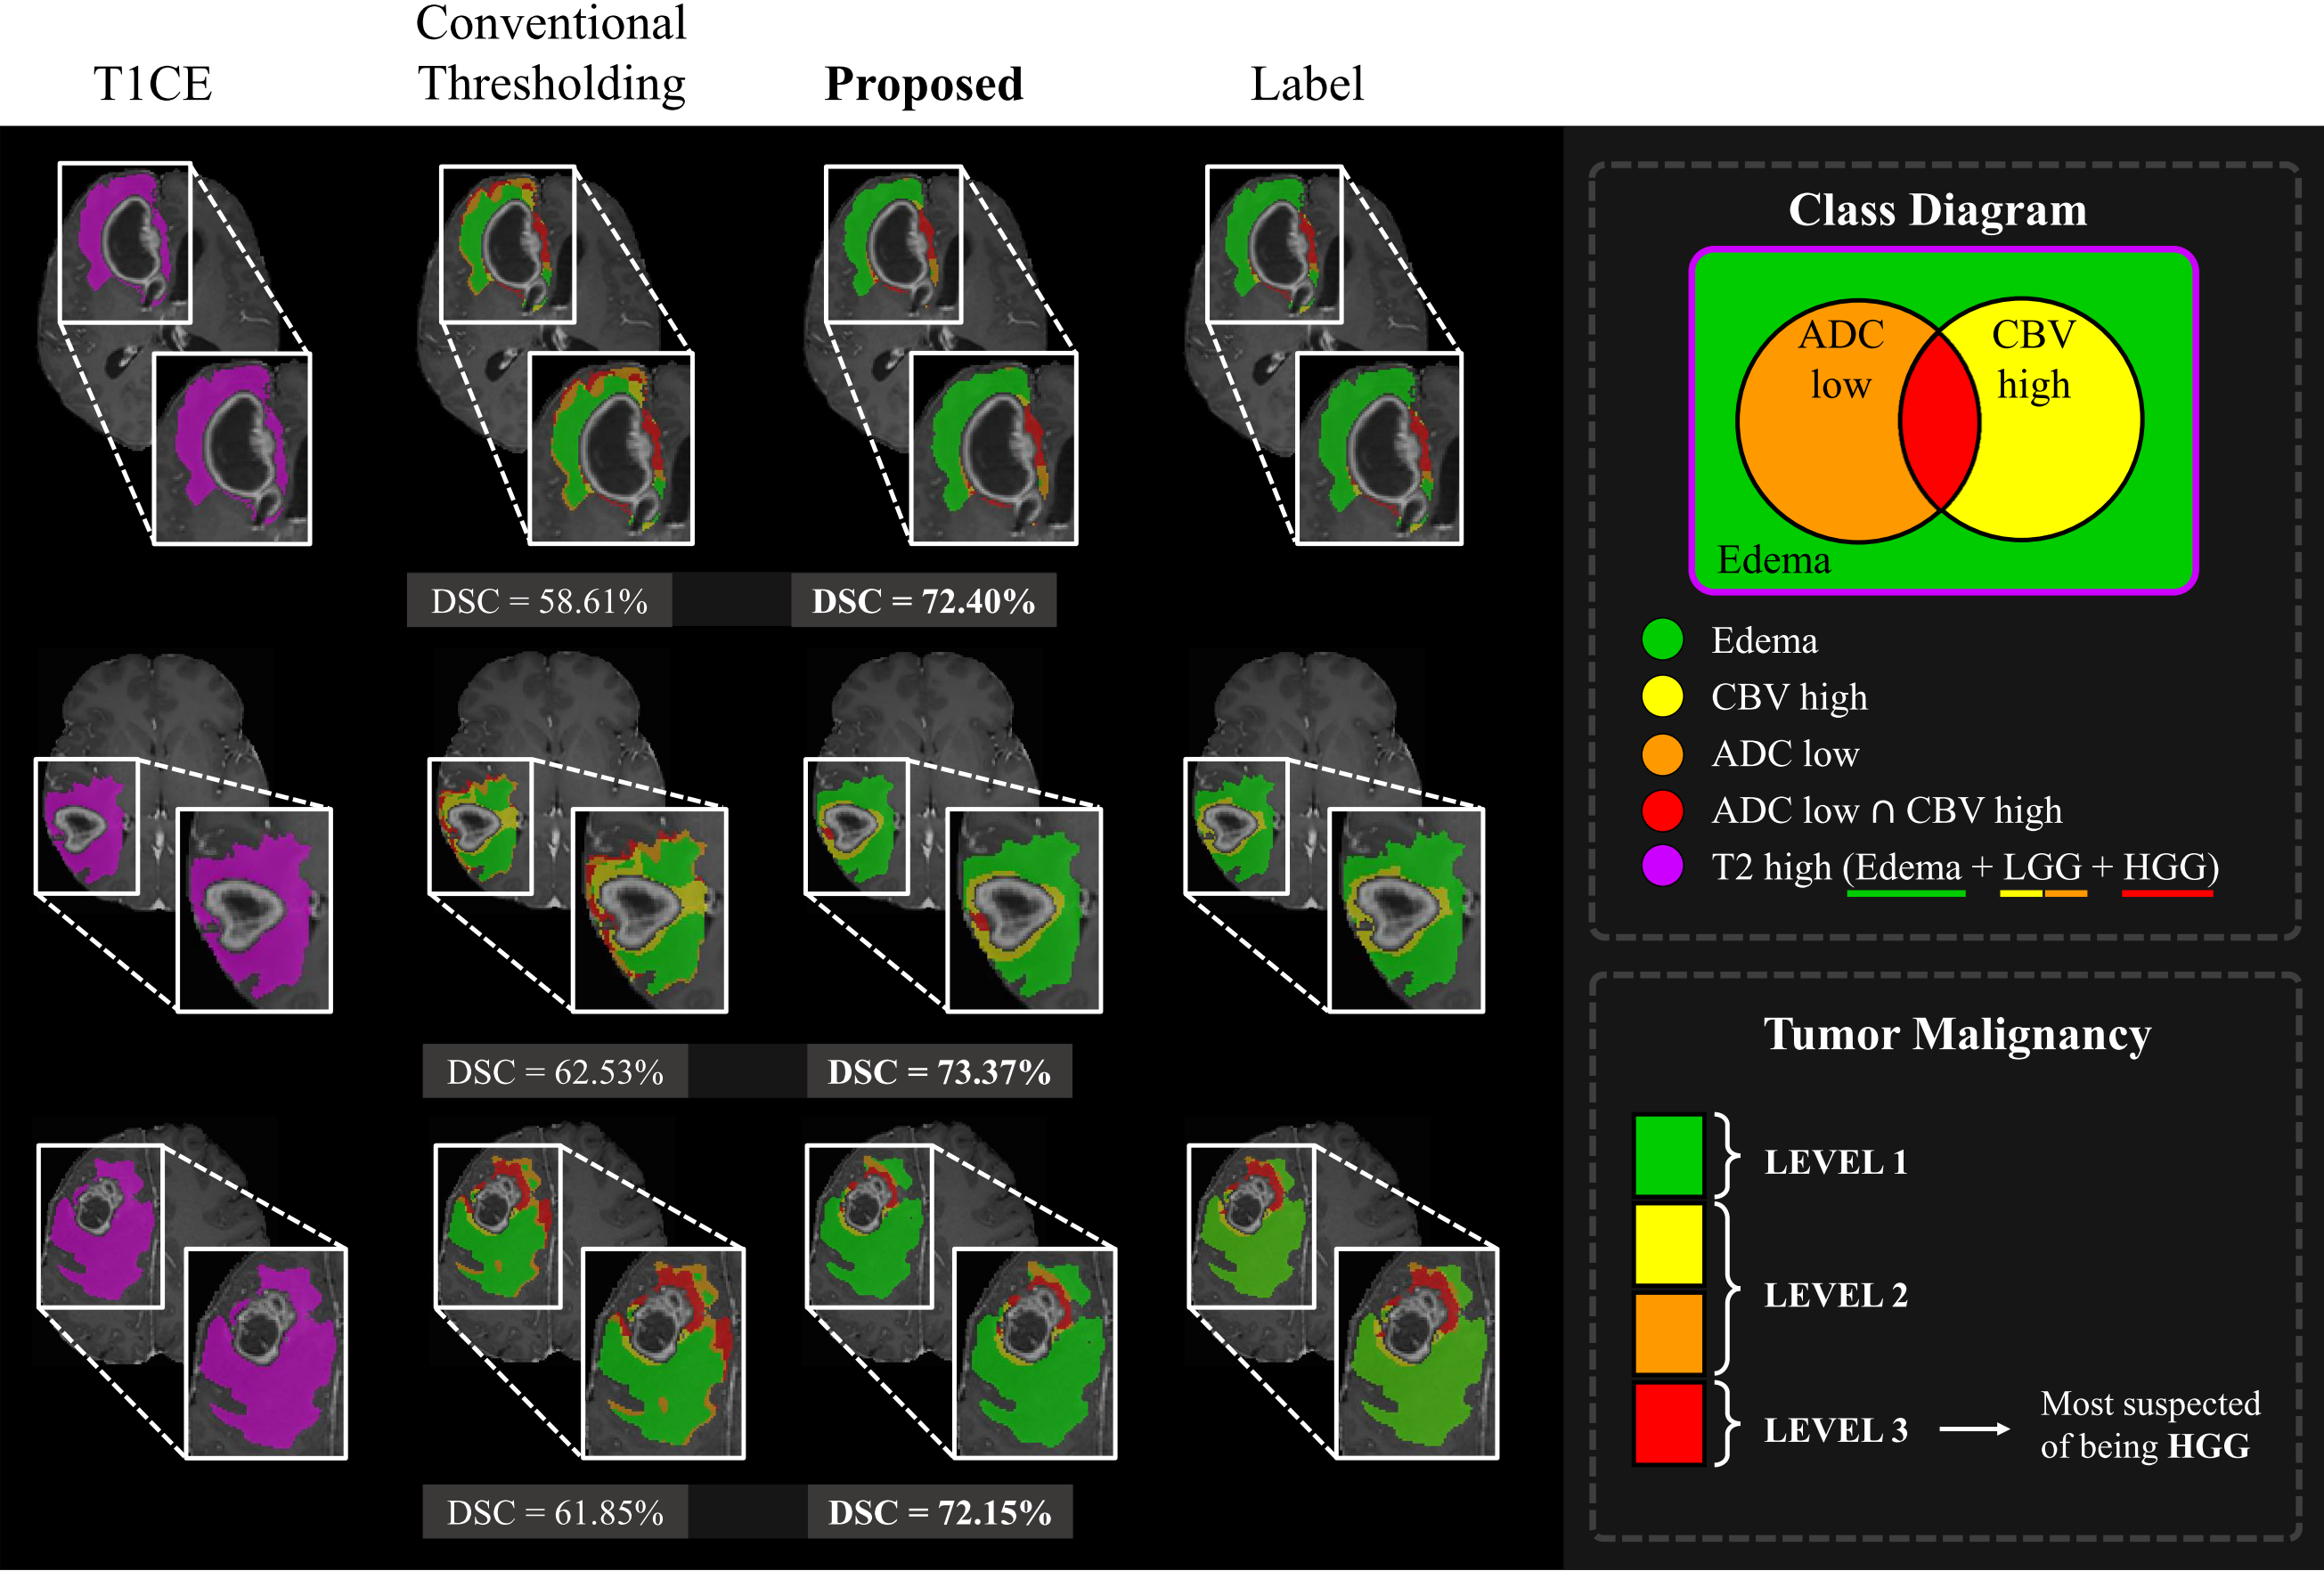
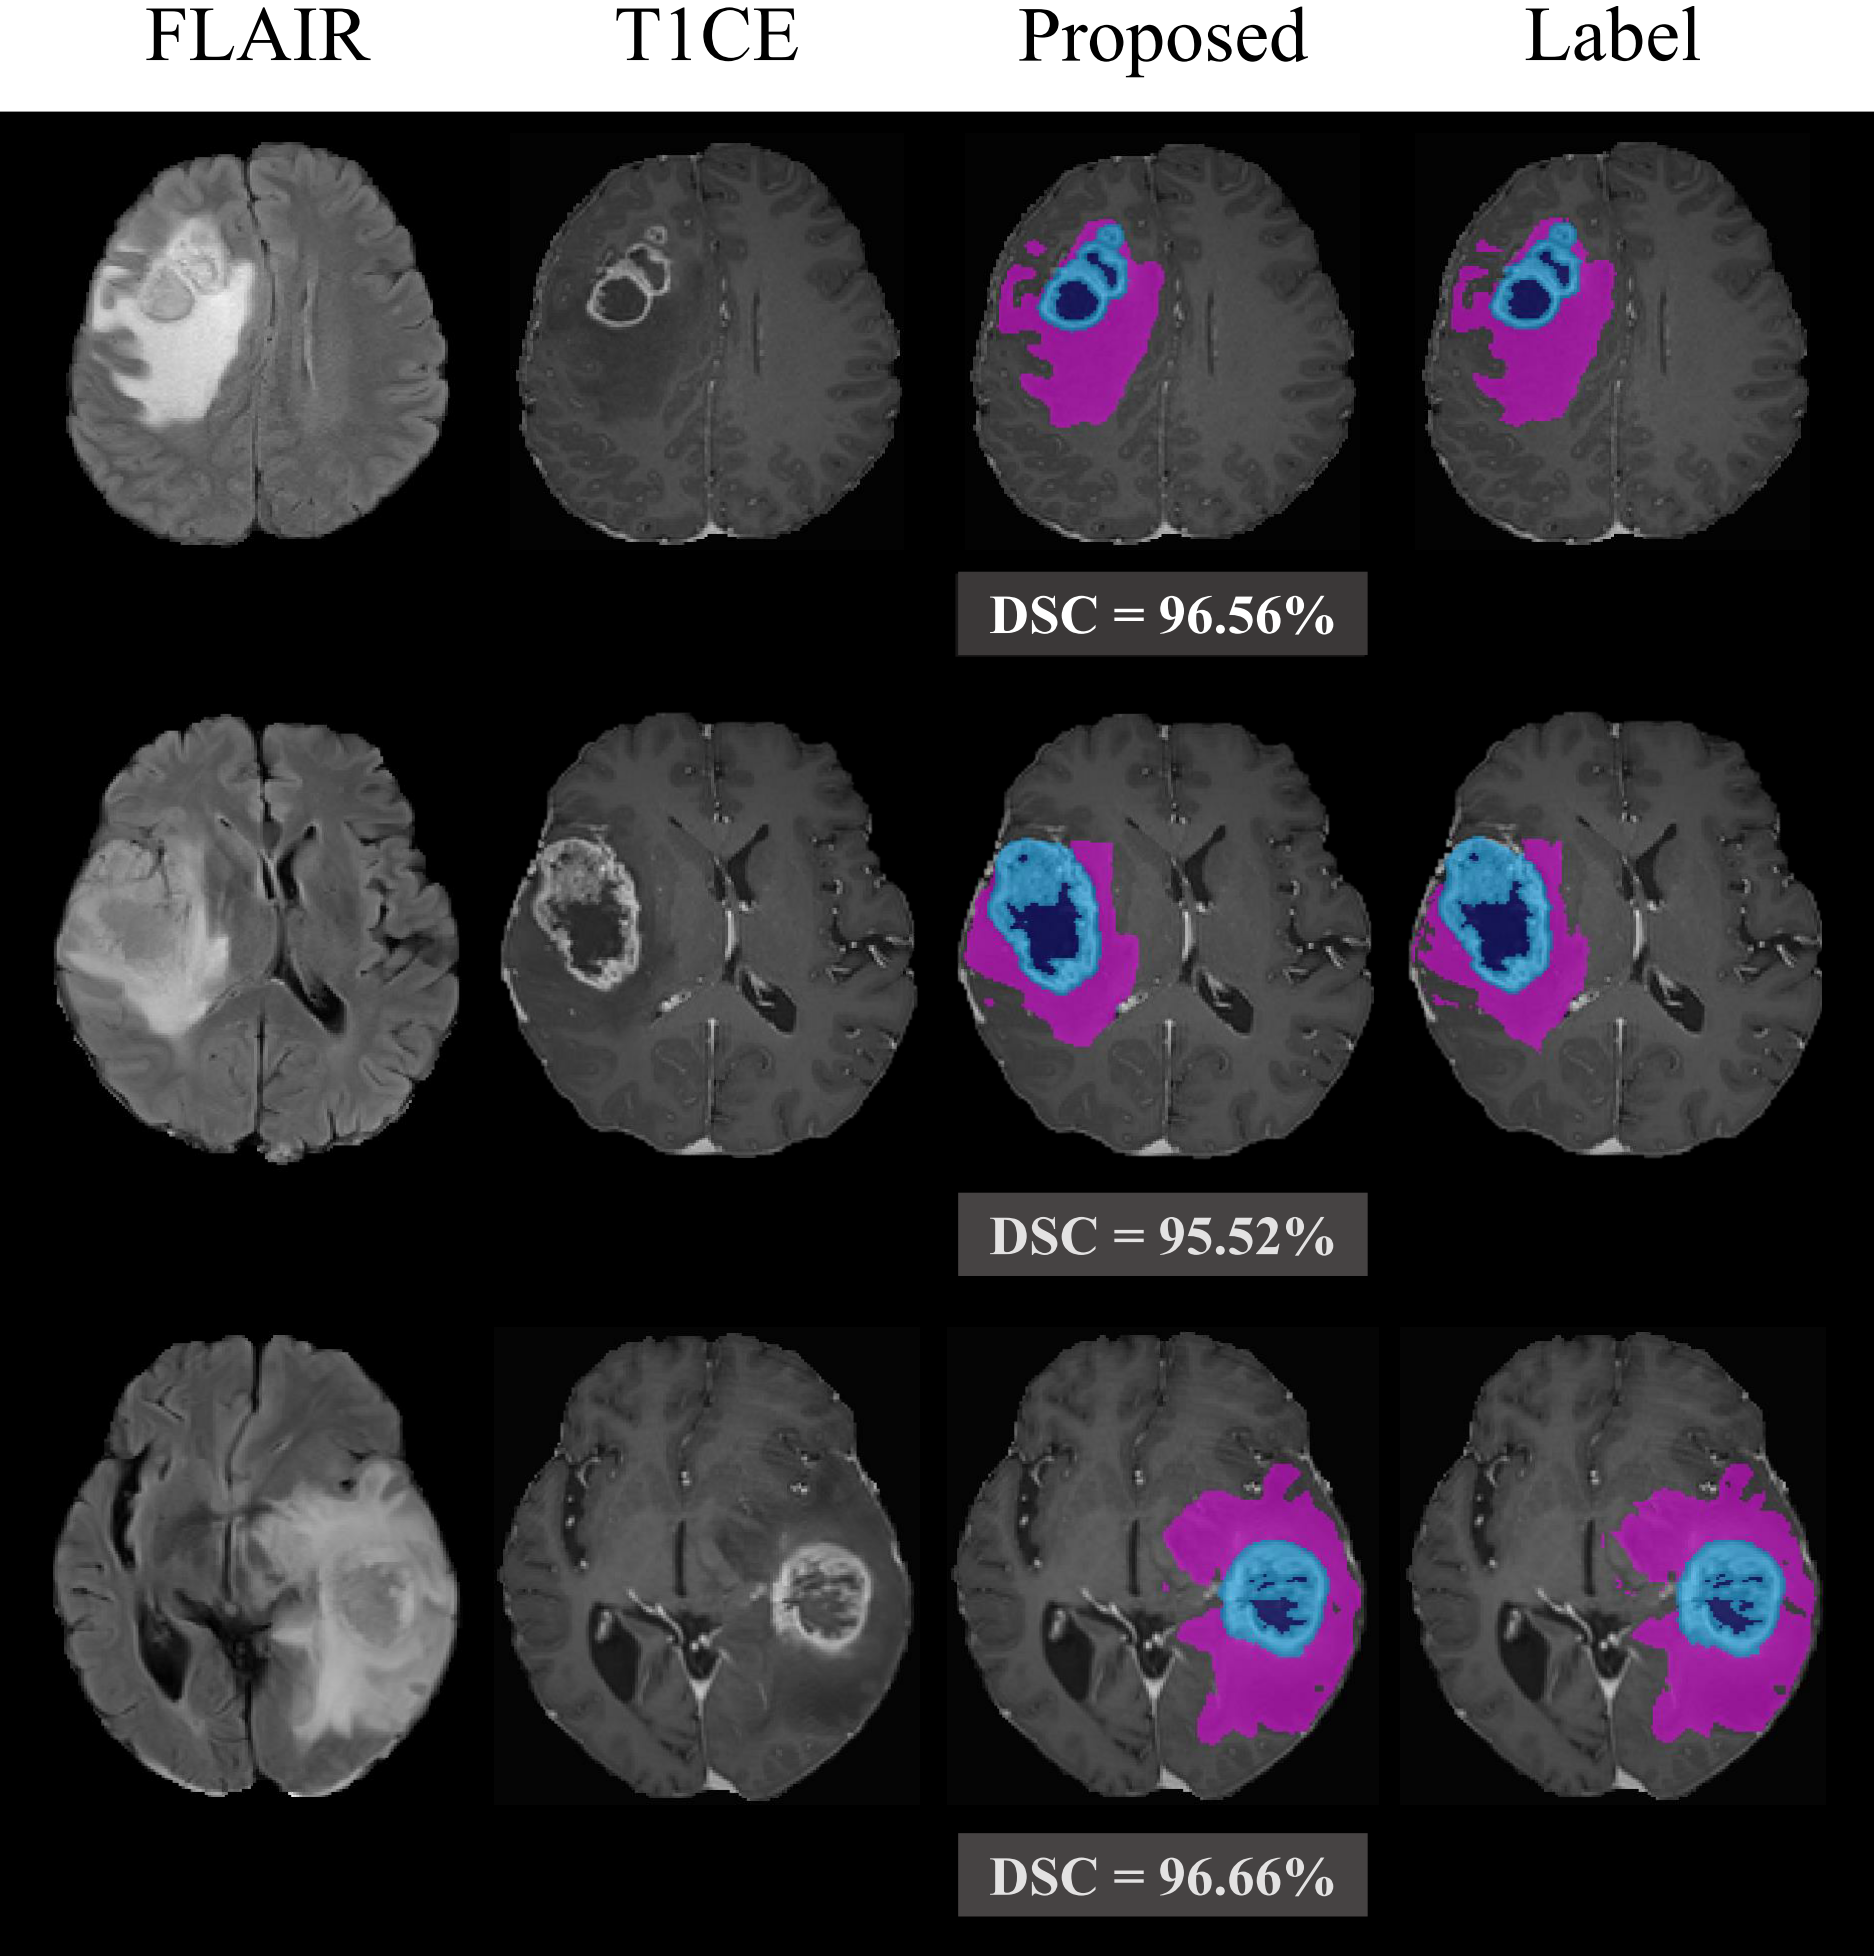
This section shows the brain tumor and malignancy segmentation performance of the proposed two-stage framework on 20 patients of the local Seoul National University Hospital (SNUH) dataset. NWT in the first stage achieved an overall Dice Similarity Coefficient (DSC) of 94.28% for the WT mask. We illustrate a comparison of the quantitative malignancy risk segmentation performances for two methods in Fig 3. These boxplots present the DSC for each class of malignancy risk segmentation. NMAL was able to learn beneficial features related to tumor malignancy from ADC and CBV images as well as FLAIR and T1CE, leading to achieving enhanced results in the malignancy risk segmentation task. NMAL achieved promising results in malignancy risk segmentation with DSC improvement rates of 12.29%, 10.24%, 10.11%, and 7.37% on ED, ADC Low, CBV High, and ADC Low CBV High class, respectively, compared to the conventional thresholding method.Fig 4 illustrates some examples of the malignancy risk segmentation results of NMAL and conventional method compared to the label. This figure obviously presents how the proposed approach can significantly improve the segmentation quality. Especially, NMAL dramatically reduces the errors that appear a lot at the boundary of the ED. Furthermore, Fig 4 shows how malignant the tumors are based on the results of malignancy risk segmentation divided into three levels. Fig 5 delineates that high-quality tumor segmentation is also possible in the proposed framework.
Discussion
The experimental results demonstrated the consequence of utilizing deep learning for malignancy risk segmentation to reduce errors occurring at the boundary of ED. The conventional thresholding method was good at distinguishing malignancy for tumor cells located near the ET, but the problem was that it showed many errors at the boundary of the ED. NMAL in the proposed two-stage framework overcomes this issue, resulting in a more accurate classification of the malignancy risk within the non-enhancing T2 high region in high-grade gliomas. The main limitation of this work is that even though the proposed two-stage framework was beneficial to improve malignancy segmentation by employing deep learning, given that the performance of malignancy risk segmentation is lower than that of tumor segmentation, it seems difficult for the model to extract the features necessary to stratify the malignancy risk within T2 hyperintensity.Conclusion
In this work, we present not only contrast-enhancing and non-enhancing tumor segmentation for surgical planning, but also malignancy risk segmentation within residual T2 hyperintensity, which may enable risk-adapted radiotherapy planning.Acknowledgements
This work was supported by the Korea Medical Device Development Fund grant funded by the Korea government (the Ministry of Science and ICT, the Ministry of Trade, Industry and Energy, the Ministry of Health & Welfare, Republic of Korea, the Ministry of Food and Drug Safety) (Project Number: 202011D23) and by the MSIT(Ministry of Science and ICT), Korea, under the ITRC(Information Technology Research Center) support program(IITP-2022-2020-0-01461) supervised by the IITP(Institute for Information & communications Technology Planning & Evaluation).References
1 Mazzara, G. P., Velthuizen, R. P., Pearlman, J. L., Greenberg, H. M. & Wagner, H. Brain tumor target volume determination for radiation treatment planning through automated MRI segmentation. International Journal of Radiation Oncology* Biology* Physics 59, 300-312 (2004).
2 Zhou, T., Canu, S., Vera, P. & Ruan, S. Latent correlation representation learning for brain tumor segmentation with missing MRI modalities. IEEE Transactions on Image Processing 30, 4263-4274 (2021).
3 Sadeghi, N. et al. Apparent diffusion coefficient and cerebral blood volume in brain gliomas: relation to tumor cell density and tumor microvessel density based on stereotactic biopsies. American journal of neuroradiology 29, 476-482 (2008).
4 Zhu, Q., Du, B., Turkbey, B., Choyke, P. L. & Yan, P. in 2017 international joint conference on neural networks (IJCNN). 178-184 (IEEE).
Figures