0518
Correlations between adipose tissue volume changes and its baseline MR-characteristics in people with obesity undergoing a caloric restriction1Department of Diagnostic and Interventional Radiology, School of Medicine, Technical University of Munich, Munich, Germany, 2Institute for Nutritional Medicine, School of Medicine, Technical University of Munich, Munich, Germany
Synopsis
Keywords: Endocrine, Fat
Results of weight loss interventions differ individually. MRI-based quantification and characterization of adipose tissue (AT) offers methods to identify possible AT-phenotypes that facilitate AT loss. The purpose of this analysis was to evaluate how, in people with obesity undergoing an 8-week formula-based weight loss intervention, the relative AT and lipid volume loss of the subcutaneous and visceral AT depot correlate to the proton density fat fraction (PDFF) and the total volume of AT as well as the volume of lipids in each depot at the beginning of the diet.Introduction
One of the strategies to deal with obesity are lifestyle interventions aiming at the reduction of excess adipose tissue (AT) and ectopic fat through a more balanced energy homeostasis. However, results of those efforts differ individually, and the success of the intervention does not seem to be only dependent on adherence to the intervention program. Several studies found a high baseline amount of visceral adipose tissue (VAT) or a high ratio of visceral to subcutaneous or total AT to favor weight- and VAT loss [1-5]. MRI-based quantification and characterization of AT offers methods to identify possible AT-phenotypes facilitating AT loss. The purpose of this analysis was to evaluate how, in people with obesity undergoing an 8-week formula-based weight loss intervention, the relative AT- and lipid volume loss of the subcutaneous and visceral AT depot correlate to the proton density fat fraction (PDFF), the total volume of AT and the volume of lipids in each depot at the beginning of the diet.Methods
We recruited 127 persons with obesity from the lifestyle intervention study (LION study [6]) to undergo an MRI of the abdomen/pelvis on a 3T scanner (Elition, Philips Healthcare). Of those, 82 participants (49 female, median age 46 years) completed the follow-up MRI scan after an 8-week caloric restriction (low caloric formula-based diet with 200g non-starchy vegetables per day). For PDFF and volume measurements of AT, a 6-echo multi-echo gradient echo sequence with bipolar gradients was used in four stacks, covering the abdomen/pelvis from the liver dome to the femoral heads: TR=7ms, TE1=1.14ms, ΔTE=0.8, flip angle=3°, bandwidth=2367Hz/pixel, 132x180x19 acquisition matrix size, FOV=400x543x144mm³, 3x3x6mm3 acquisition voxel size, acceleration factor R=3.5 and reconstructed using Compressed SENSE. PDFF maps were generated using the online complex-based fat quantification algorithm, accounting for known confounding factors including the presence of multiple fat peaks, a single T2* correction and phase errors. VAT and subcutaneous adipose tissue (SAT) were segmented using a deep learning-based automated segmentation pipeline after [7, 8]. VAT and SAT volumes and mean AT PDFF values (in %) were extracted. Lipid volume was calculated as PDFF*volume for both AT compartments. Relative AT and lipid volume losses were calculated as (volumeafter diet -volumebaseline)/volumebaseline and expressed in %. Body weight was measured in light clothing before each MRI scan using MPD 250K100M (Kern and Sohn), height was measured in a standing position without shoes using a stadiometer (Seca 214, Seca) and body mass index (BMI) was calculated as weight/height in m². Spearman Rank correlation coefficient was used to evaluate associations between the parameters.Results
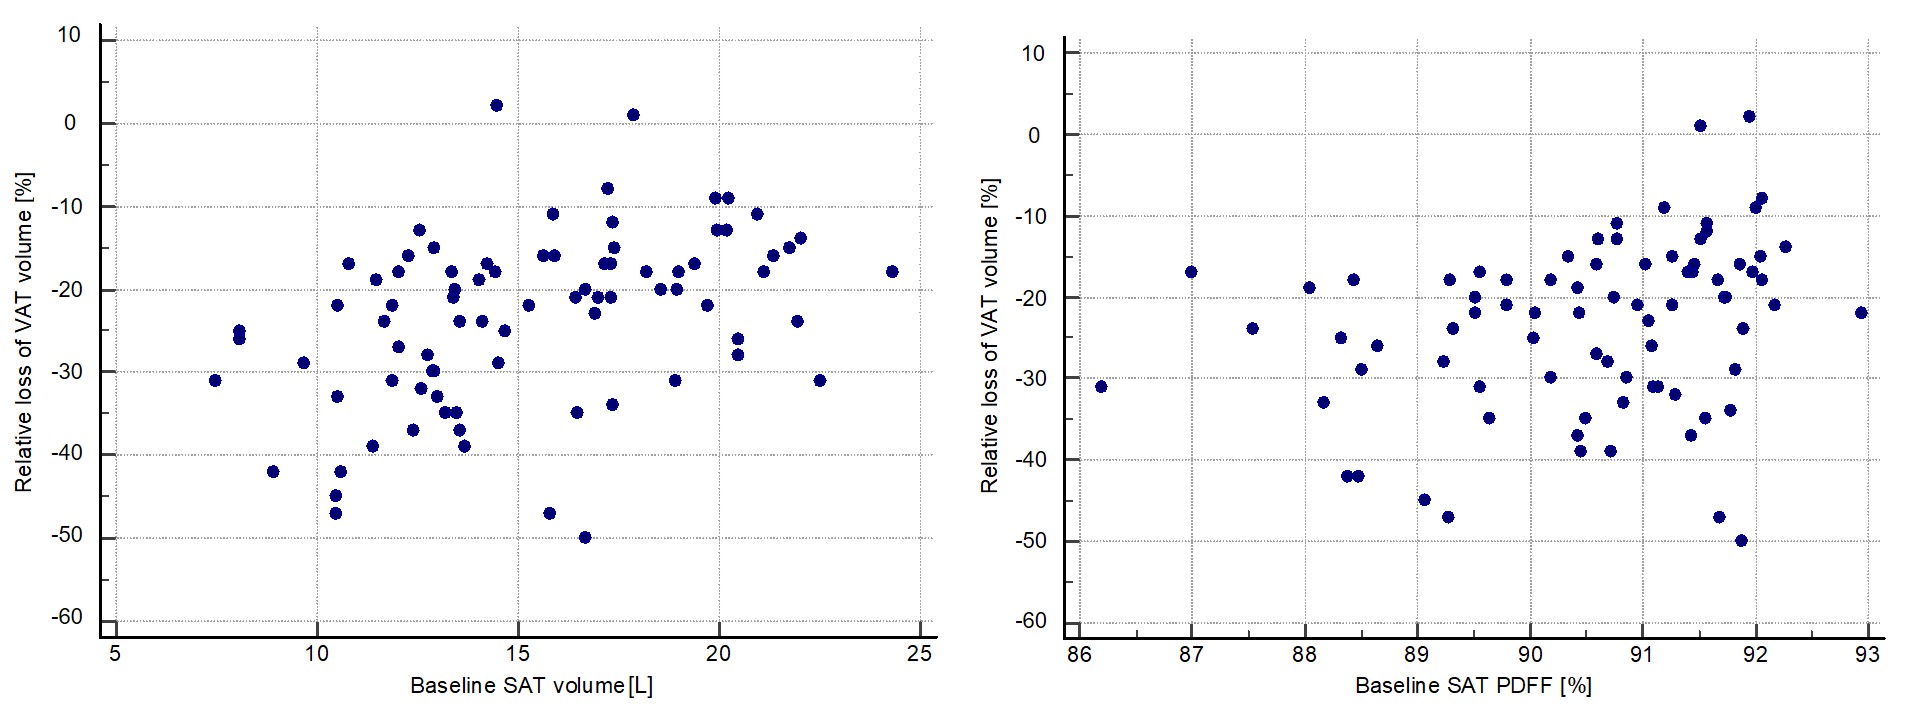
At baseline, median BMI was 33.7kg/m², SAT volume 15.5L, VAT volume 4.89L and VAT/SAT ratio 0.29. Median PDFF values were 90.7% for SAT and 84.1% for VAT. Median lipid volumes were 14.1L in SAT and 4.3L in VAT. In those participants with follow-ups, median BMI decrease was 3.7kg/m². In absolute numbers, participants lost a median of 3.3L of SAT (3.1L lipids) and 1.1L of VAT (1.0L lipids). Relative to baseline, median loss of total SAT volume was 20.5% (22% SAT lipid volume), and of VAT volume 21.5% (25.3% VAT lipid volume).Relative SAT volume loss correlated with baseline SAT PDFF (rho=0.25, p=0.02), baseline SAT volume (rho=0.39, p<0.01) and baseline SAT lipid volume (rho=0.39, p<0.01). There was no correlation of SAT loss with VAT characteristics or VAT/SAT ratio at baseline. Relative VAT volume loss also correlated with baseline SAT PDFF, baseline SAT volume and baseline SAT lipid volume (rho=0.33, rho=0.46 and rho=0.46, p<0.01) [Figure 1] and borderline with baseline VAT volume and baseline lipid volume (rho=0.22, p=0.045 and rho=0.22, p=0.048), but not with baseline VAT PDFF or VAT/SAT ratio.
Relative SAT lipid volume loss showed correlations with baseline SAT PDFF, SAT volume and SAT lipid volume (rho=0.24, p=0.03; rho=0.42 and rho=0.41, each p<0.01). Relative VAT lipid volume loss correlated strongest with baseline SAT PDFF, baseline SAT volume and baseline SAT lipid volume (rho=0.34, rho=0.5 and rho=0.48, each p<0.01) as well as with baseline VAT volume and baseline VAT lipid volume (rho=0.25, p=0.03 and rho=0.23, p=0.04).
Discussion
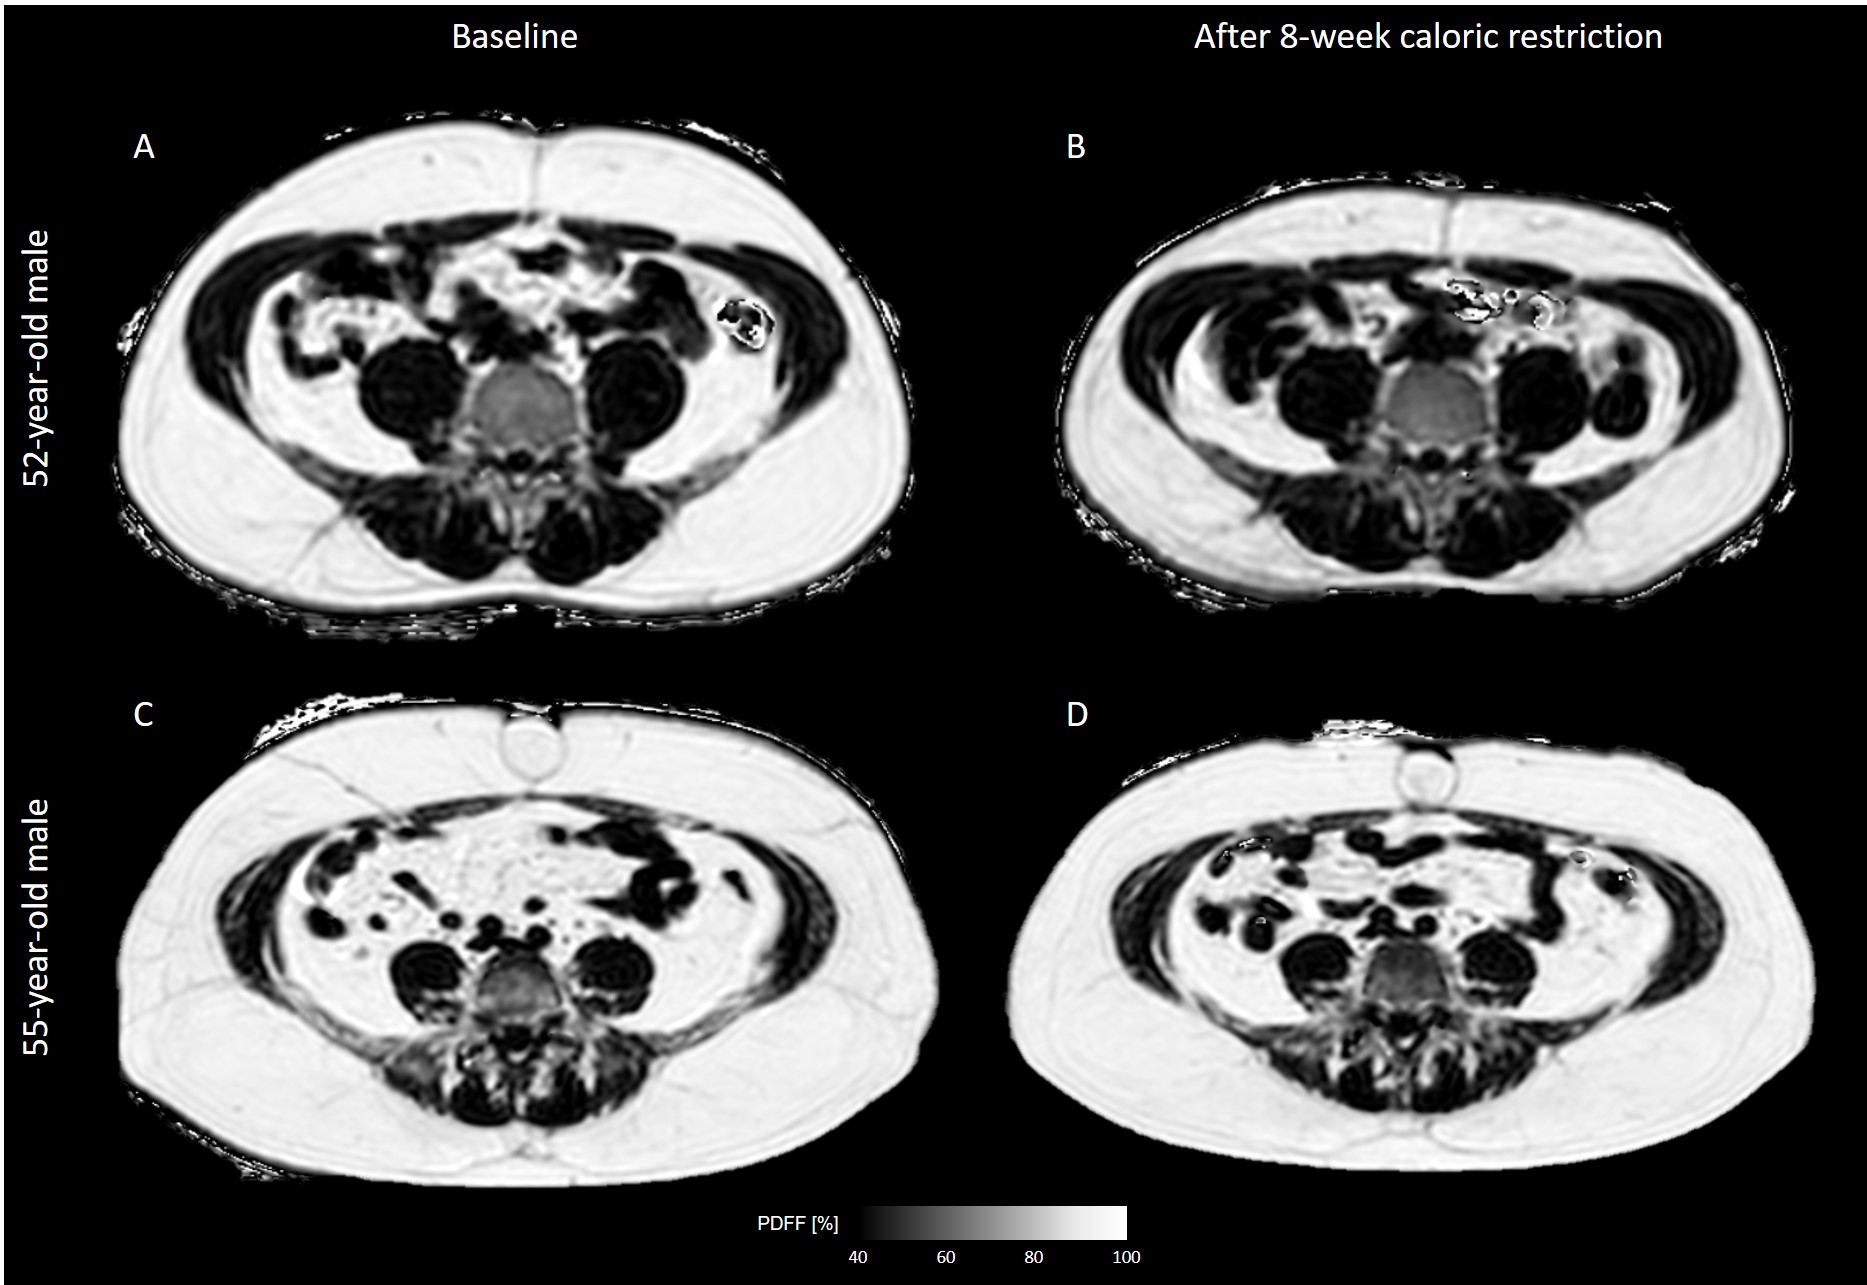
The present study demonstrates that in persons with obesity undergoing an 8-week formula-based weight loss intervention, SAT characteristics at baseline are associated with (1) SAT and VAT volume loss and (2) loss of lipid volume in SAT and VAT. A higher relative loss of both total SAT and SAT lipid volume was associated with low initial SAT PDFF, low initial SAT volume and low initial SAT lipid volume. For higher relative VAT- and VAT lipid volume loss, there was an association with low SAT PDFF, low SAT volume, low SAT lipid volume, low VAT volume and low VAT lipid volume at baseline [Figure 2]. Findings from previous studies associating initial VAT/SAT ratio with AT loss [3, 4] could not be verified for the relative volume losses. The current analysis did not subdivide SAT into deep and superficial and did not consider sex.Conclusion
For AT volume loss and AT lipid volume loss in persons with obesity undergoing an 8-week caloric restriction, baseline SAT MR-characteristics (total volume, lipid volume and PDFF) are most relevant, irrespective of the depot.Acknowledgements
This study is funded by the German Federal Ministry of Education and Research (BMBF, grant number: 01EA1709) within the framework of the Junior Research Group “Personalized Nutrition & eHealth (PeNut)” of the enable Nutrition Cluster. Further, the present work was supported by the German Research Foundation (project number 450799851 and project number 455422993/FOR5298-iMAGO-P1). The authors from the department of radiology also acknowledge research support from Philips Healthcare.References
[1] Hallgreen CE, Hall KD. Allometric relationship between changes of visceral fat and total fat mass. Int J Obes (Lond). 2008 May;32(5):845-52.
[2] Pinho CPS, Diniz AdaS, Arruda IKGde, Leite APDL, Rodrigues IG. Effects of weight loss on adipose visceral and subcutaneous tissue in overweight adults. Clinical Nutrition 2018, 37(4), 1252–1258.
[3] Fujioka S, Matsuzawa Y, Tokunaga K, Kawainoto T, Kobatake T, Keno Y et al. Improvement of glucose and lipid metabolism associated with selective reduction of intra-abdominal visceral fat in pre-menopausal women with visceral fat obesity. Int J Obes 1991; 15: 853±885.
[4] Smith SR, Zachwieja JJ. Visceral adipose tissue: a critical review of intervention strategies. Int J Obes Relat Metab Disord 1999; 23: 329–335.
[5] Wabitscht M, Hauner H, Böckmann A, Parthon W, Teller W: The relationship between body fat distribution and weight loss in obese adolescent girls. Int J Obes 1992;16(11):905-911
[6] Reik A, Holzapfel C. Randomized Controlled Lifestyle Intervention (LION) Study for Weight Loss and Maintenance in Adults With Obesity-Design and Methods. Front Nutr. 2020;7:586985.
[7] Estrada S, Lu R, Conjeti S, Orozco-Ruiz X, Panos-Willuhn J, Breteler MMB, Reuter M. FatSegNet: A fully automated deep learning pipeline for adipose tissue segmentation on abdominal dixon MRI. Magn Reson Med. 2020 Apr;83(4):1471-1483.
[8] Isensee F, Jaeger PF, Kohl SAA. et al. nnU-Net: a self-configuring method for deep learning-based biomedical image segmentation. Nat Methods 18, 203–211 (2021).
Figures