0516
In vivo Quantitative evaluation of MR Imaging: Irisin Activates Brown Adipose Tissue and Improves Systemic Metabolic Disorders in Obese Mice1Jiangsu Key Laboratory of Molecular and Functional Imaging, Department of Radiology, Southeast University, Zhongda Hospital, NANJING, China
Synopsis
Keywords: Endocrine, Metabolism, Brown Adipose Tissue
Irisin is an exercise-induced myokine which can induce white adipose tissue browning; however, its impact on BAT remains unclear. Here, we employed MR chemical shift-selective imaging to quantify fat fraction, and to verify these MR-derived data by that from laboratory analysis to investigate the effects of irisin on BAT and systemic metabolism in obese mice. Irisin reduced the fat fraction and increased the UCP1 protein expression of BAT. Besides, irisin helped obese mice to loss weigh and improve systemic metabolic disorders. These results suggests that irisin can reactivate brown adipose tissue and improve systemic metabolic disorders in obese mice.Introduction
Obesity has become a global epidemic [1]. Numerous studies have shown that obesity is strongly associated with the occurrence and development of varieties of diseases, such as type 2 diabetes, cardiovascular disease and cancer [2, 3]. Different from white adipose tissue (WAT), which stores energy as its primary function, brown adipose tissue (BAT) has the special structure of multilocular lipid droplets and abundant mitochondria, which specially highly express UCP1, a key thermogenic protein, to regulate the balance of energy metabolism throughout the body by thermogenesis [4]. Obesity has previously been shown to reduce BAT activity and thermogenesis [5]. Irisin, an exercise-induced myokine that has been demonstrated to promote beige fat biogenesis, is produced by the cleavage and modification of fibronectin type III domain containing 5, which is located downstream of peroxisome proliferator-activated receptor γ coactivator-1[6]. Current research on irisin most focus on its effects on WAT; however, its impact on BAT remains unclear. The aim of the present study is to investigate the effects of irisin on BAT and systemic metabolism in obese mice induced by high fat diet using MR chemical shift-selective imaging in vivo, and to verify these MR-derived data by that from histological and biological analysis.Methods
C57BL/6J mice (23.43 ± 0.81 g weight, 8 weeks of age) were fed on high-fat diet (HFD, 60% fat) or control diet (CD, 12% fat) for 16 weeks to establish the HFD-induced obese mice or CD mice. HFD mice were randomly assigned to three groups for follow-up experiments involving different treatment by intraperitoneal injection, which the control group received PBS buffer (HFDPBS), while the experimental group received irisin solution (0.8ng/g body weight) [7] for 2 weeks [HFDIrisin(2w)] and 4 weeks [HFDIrisin(4w)]. Body weight and food intake were recorded daily during the intervention period. MR selective fat images and selective water images were scanned through 7.0T MR (Bruker PharmaScan, Germany) to calculate fat fraction of BAT and liver. T1 weighted imaging of mice were scanned to measure the volume of subcutaneous and visceral WAT. Structural and UCP1 protein expression levels in BAT were detected by hematoxylin-eosin (H&E) staining, immunohistochemistry, and Western blotting. Glucose and lipid metabolism levels were assessed by glucose tolerance test, insulin tolerance test and serum lipid metabolism test, respectively.Results
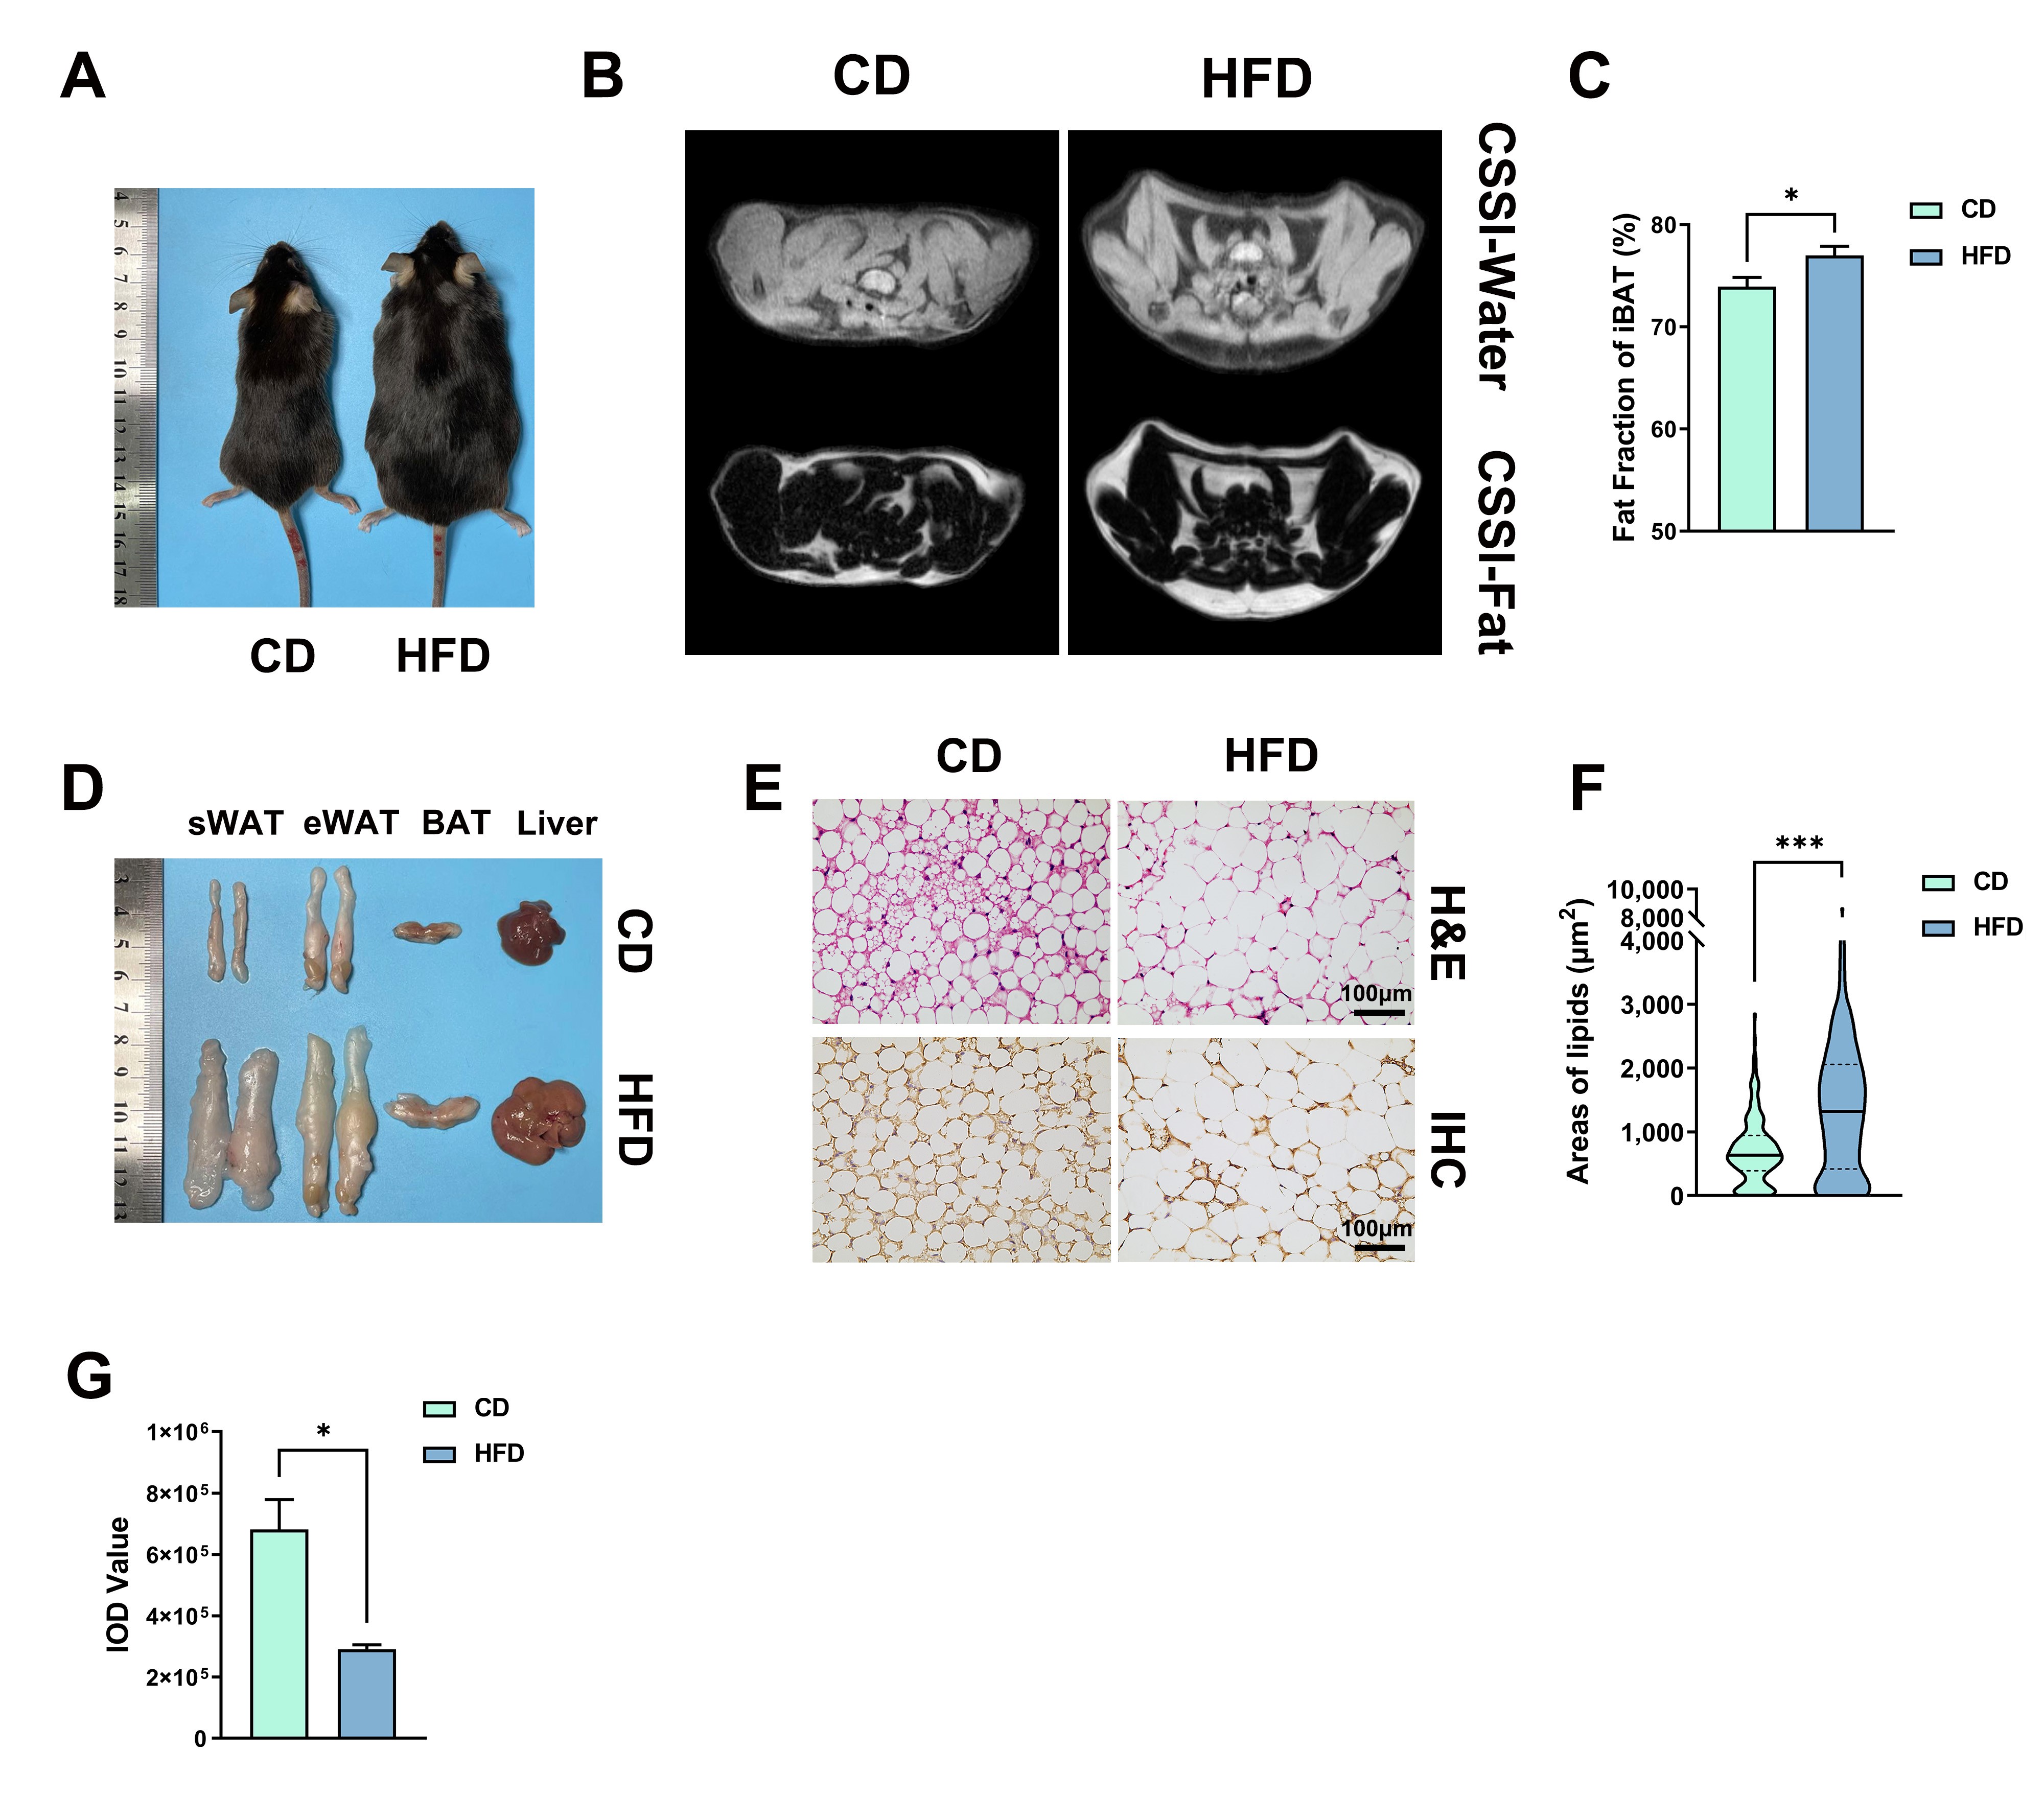
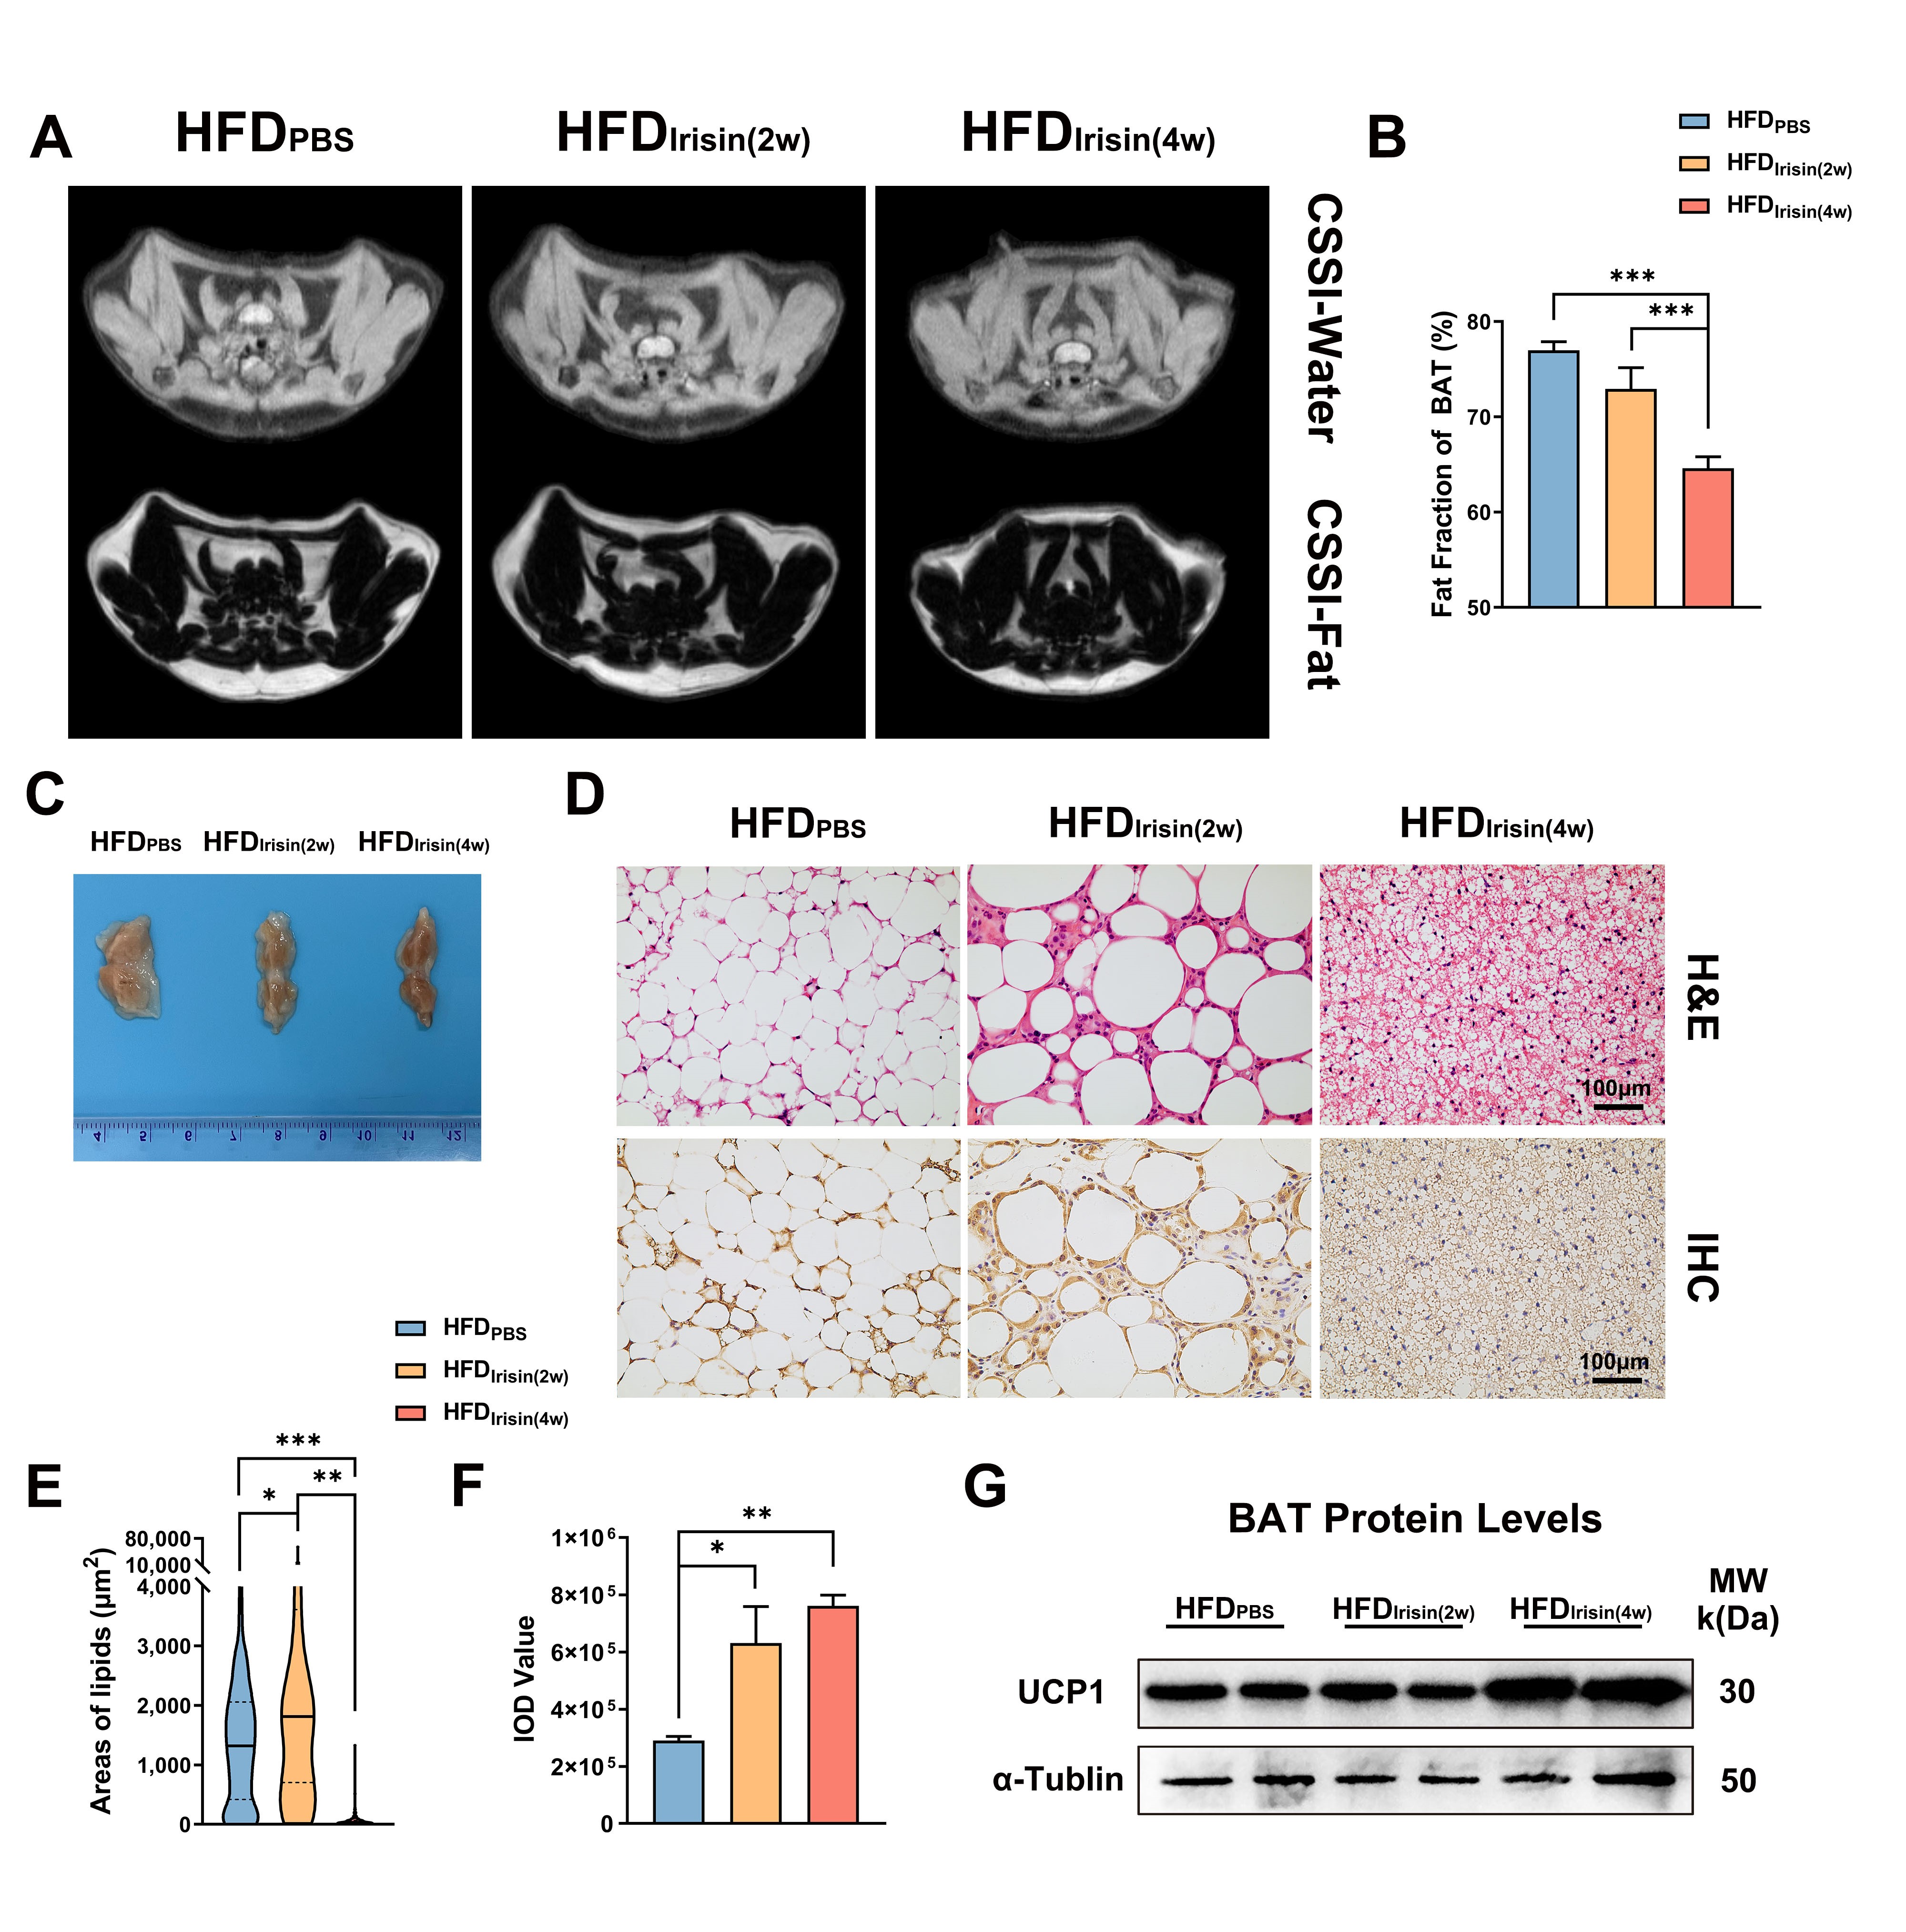
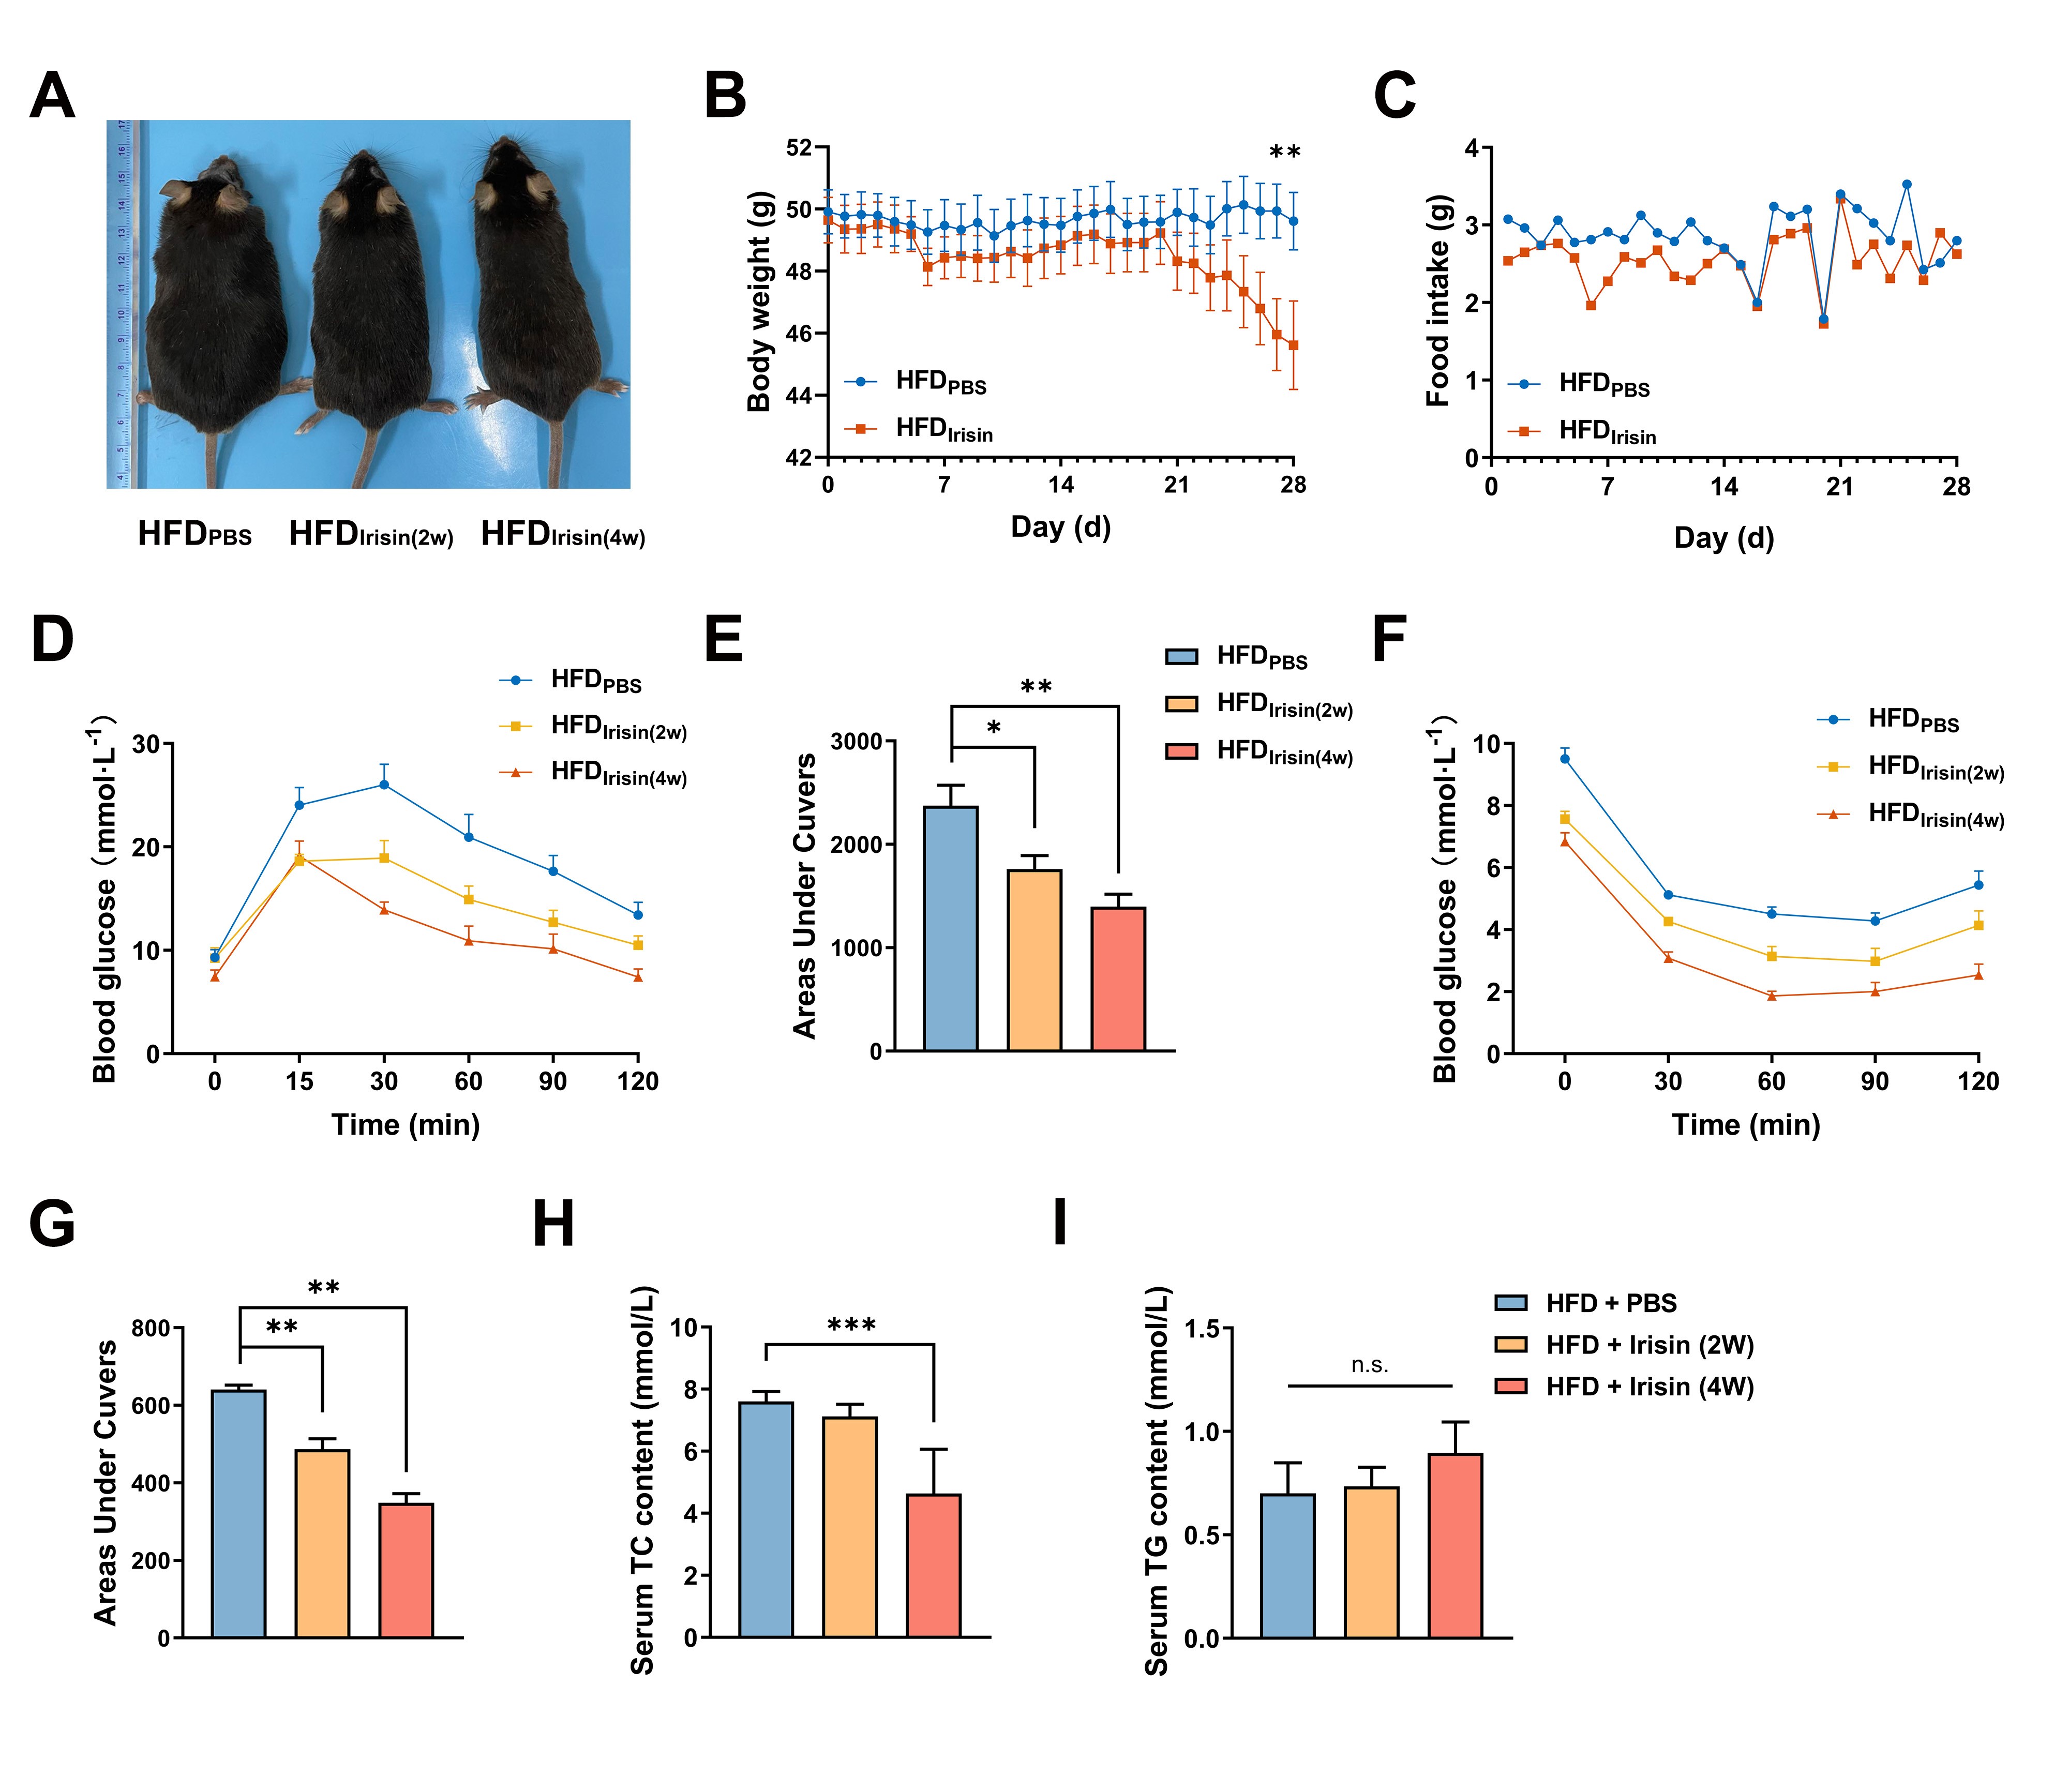
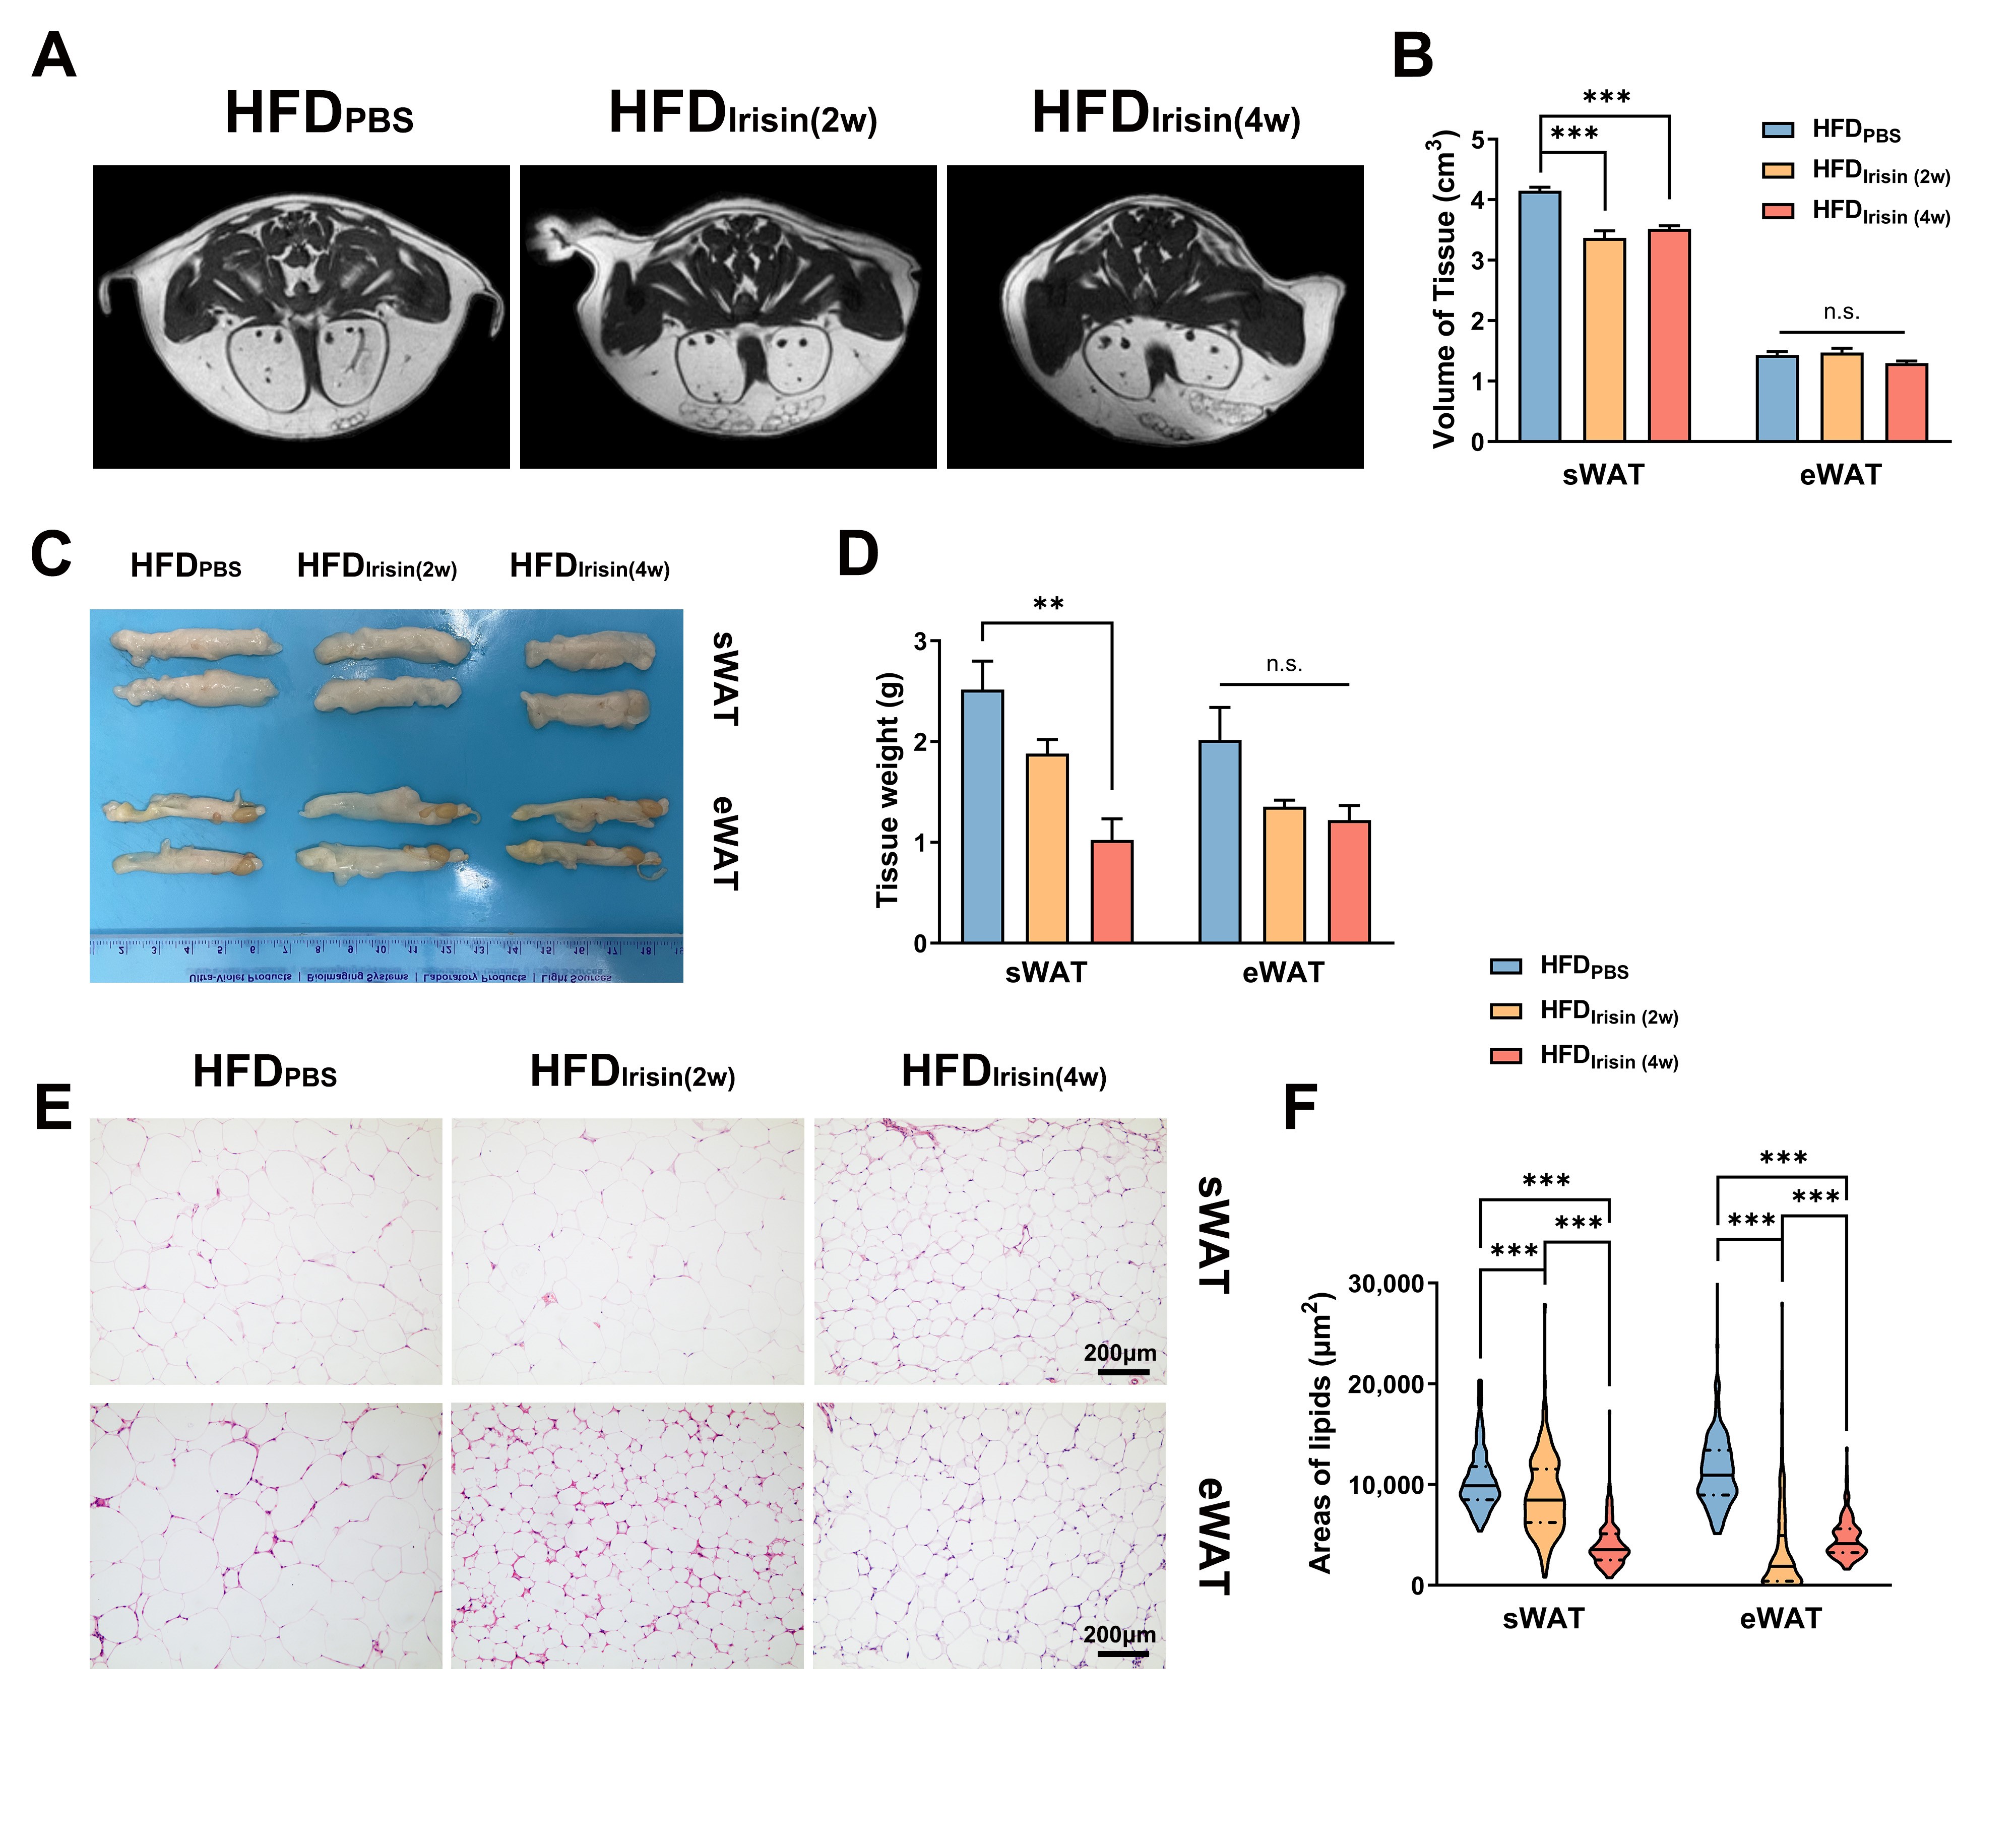
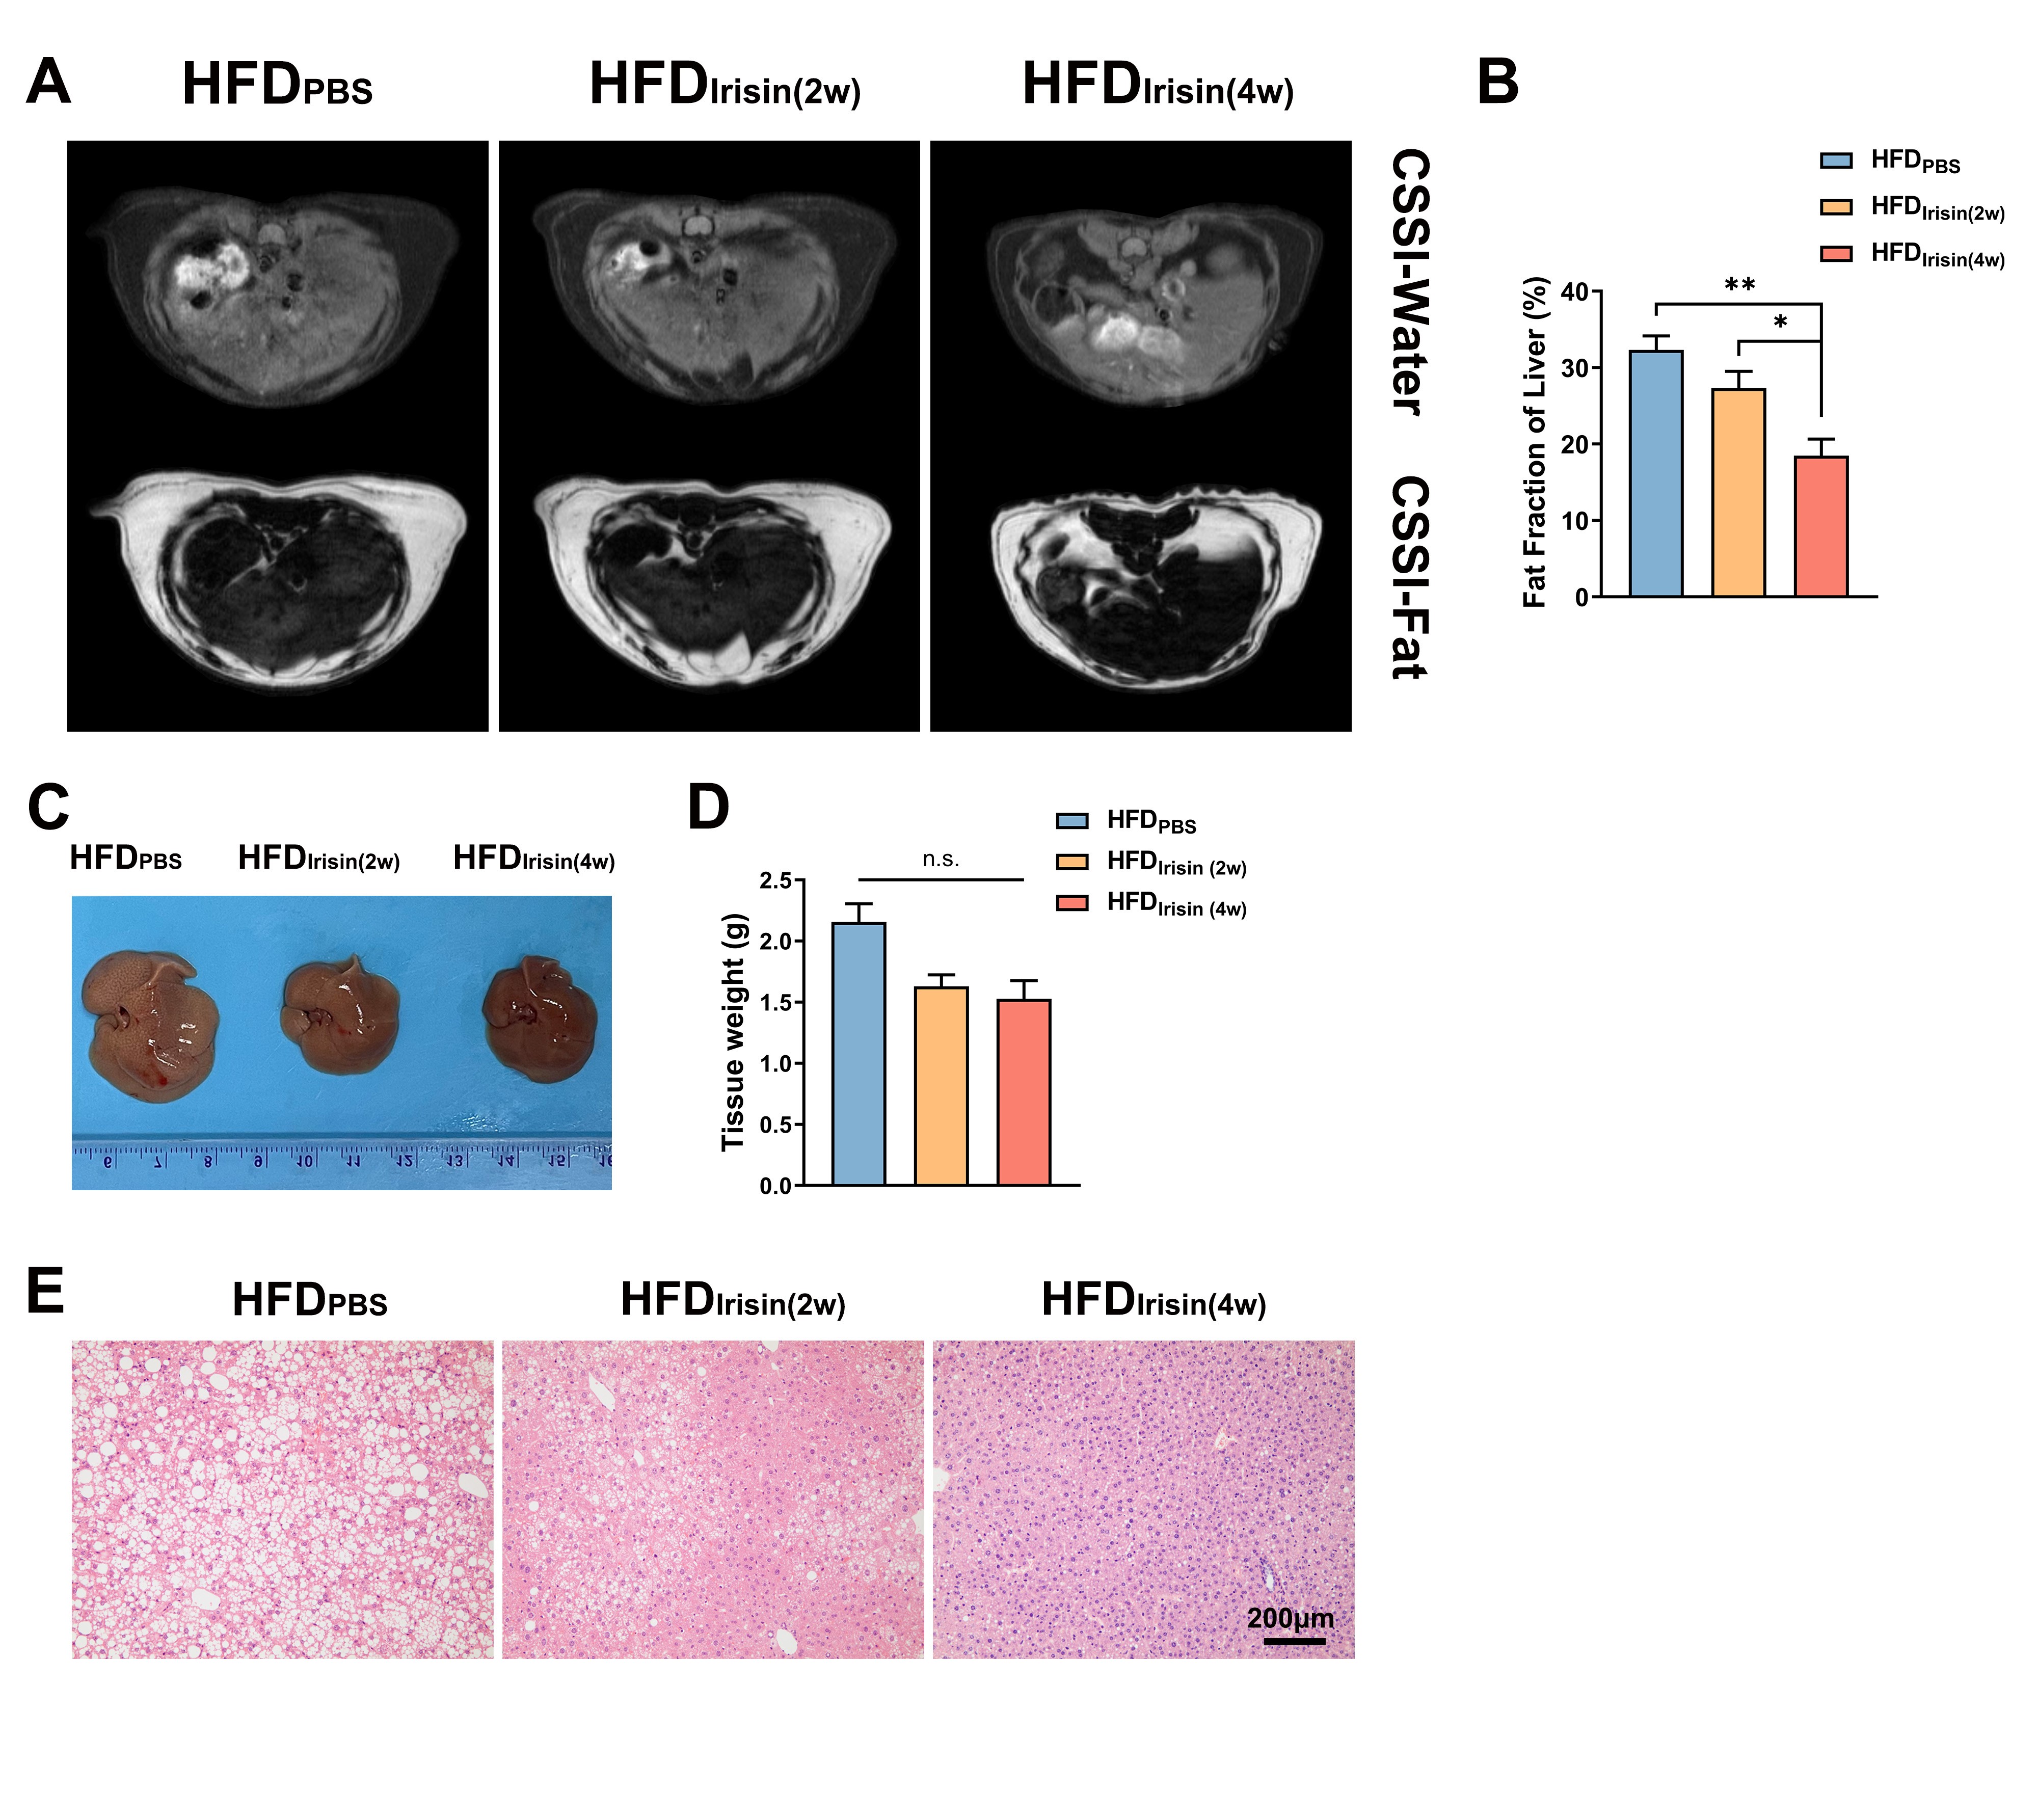
The body weight of HFD mice were increased obviously, and BAT fat fraction was significantly higher in HFD mice than that of in CD mice (P < 0.05, Fig 1A-C). Lipid accumulation was observed in BAT, WAT and liver from HFD mice (Fig 1D). BAT of HFD mice showed increased lipid droplets area (P < 0.001) and decreased UCP1 protein expression levels (P < 0.05, Fig 1E-G). Irisin intervention reduced the fat fraction of BAT in HFD mice, and the effect of Irisin was more significant as the duration of irisin intervention extended (P < 0.001, Fig 2A-C). Irisin intervention for 4 weeks dramatically reversed the HFD-induced “whitening” of BAT (Fig 2D-G), which to reduce the lipid droplets of BAT (P < 0.001) and to increase the UCP1 protein expression levels (P < 0.01). After irisin intervention, HFD mice showed weight loss with no significant difference in food intake (P < 0.05, Fig 3A-C). In addition, glucose tolerance and insulin tolerance were improved (P < 0.01). And serum total cholesterol levels were decreased (P < 0.001, Fig 3D-I). Besides, the volume and weight of subcutaneous WAT in the inguinal region were decreased (P < 0.01) with no change in the visceral WAT surrounding the epididymis (Fig 4A-D). The smaller lipid droplets were found after irisin intervention, including subcutaneous WAT and visceral adipose tissue (P < 0.001, Fig 4E-F). The liver fat fraction in vivo was gradually decreased with the irisin intervention (P < 0.01, Fig 5A-B). H&E staining sections confirmed that the liver steatosis was significantly improved (Fig 5C-E).Discussion
Our study found that HFD mice exhibit BAT whitening, which might be one of the significant causes of metabolic disorder [5]. Irisin has a beneficial effect on HFD-induced obesity, not only by increasing the UCP1 protein levels of BAT but also by improving systemic metabolic disorders, suggesting that irisin can play an influential role in the reactivation of BAT. However, it remains unclear why the area of BAT lipid droplets was increased after 2 weeks of irisin intervention. It is meaningful to verify this effect in further experiments. Irisin is able to greatly reduce the volume and weight of sWAT but not in eWAT. Previous studies have reported that irisin mainly acts on sWAT rather than eWAT [8], which is consistent with our results. Although we did not find volume and weight variations in eWAT, the significantly reduced area of lipid droplets is also an attractive finding. In our previous work, we found that irisin can promote browning of sWAT in CD mice [7], and the effect of irisin on WAT depots in HFD mice will be explored in the future.Conclusion
Our study demonstrated that irisin reactivated brown adipose tissue and improved systemic metabolic disorders in obese mice induced by high fat diet, which to improve glucose and lipid metabolism, liver steatosis and subcutaneous fat accumulation.Acknowledgements
This work was supported by Jiangsu Key Laboratory of Molecular and Functional Imaging, Department of Radiology, Zhongda Hospital, Medical School, Southeast University.References
1. Afshin, A., et al., Health Effects of Overweight and Obesity in 195 Countries over 25 Years. N Engl J Med, 2017. 377(1): p. 13-27.
2. Gross, B., et al., PPARs in obesity-induced T2DM, dyslipidaemia and NAFLD. Nat Rev Endocrinol, 2017. 13(1): p. 36-49.
3. Lauby-Secretan, B., et al., Body Fatness and Cancer--Viewpoint of the IARC Working Group. N Engl J Med, 2016. 375(8): p. 794-8.
4. Sakers, A., et al., Adipose-tissue plasticity in health and disease. Cell, 2022. 185(3): p. 419-446.
5. Rangel-Azevedo, C., et al., Progressive brown adipocyte dysfunction: Whitening and impaired nonshivering thermogenesis as long-term obesity complications. J Nutr Biochem, 2022. 105: p. 109002.
6. Villarroya, F., Irisin, turning up the heat. Cell Metab, 2012. 15(3): p. 277-8.
7. Chen, Y., et al., Irisin induces white adipose tissue browning in mice as assessed by magnetic resonance imaging. Exp Biol Med (Maywood), 2021. 246(14): p. 1597-1606.
8. Lee, P., et al., Irisin and FGF21 are cold-induced endocrine activators of brown fat function in humans. Cell Metab, 2014. 19(2): p. 302-9.
Figures