0513
Comparison of 31P MRS in human pancreas and liver at 7 Tesla1Center for Image Sciences, University Medical Center Utrecht, Utrecht, Netherlands, 2Dept. of Surgery, UMC Utrecht Cancer Center and St Antonius Hospital Nieuwegein: Regional Academic Cancer Center Utrecht, Utrecht University, Utrecht, Netherlands, 3Dept. of Radiology, University Medical Center Utrecht, Utrecht University, Utrecht, Netherlands, 4Dept. of Medical Oncology, UMC Utrecht Cancer Center, Regional Academic Cancer Center Utrecht, Utrecht University, Utrecht, Netherlands
Synopsis
Keywords: Pancreas, Non-Proton
31P MRS could be valuable for the assessment of treatment response in pancreatic cancer. Using a 31P whole-body transmit coil in combination with a 16-channel receive array at 7T, we could obtain 31P MRSI data covering both the whole liver and the deeply lying pancreas. The aim of this study was to compare 31P metabolite levels in the pancreas and liver in healthy volunteers. The PME/PDE ratio, which has been used as a tumor marker, was 2.1-fold higher in the pancreas compared to the liver. This will be important to take into account when applying 31P MRS in pancreatic tumors.
Introduction
Pancreatic ductal adenocarcinoma (PDAC) is an aggressive malignancy with a dismal prognosis, of which the incidence keeps on rising.1,2 31P MRS is a non-invasive technique that has been shown to enable detection of metabolic alterations in different tumors3 and could potentially be used to assess early treatment response in PDAC patients. However, 31P MRS of the human pancreas is challenging, because it is located in the center of the abdomen. Recently, we have shown the feasibility of 31P MRS in the healthy human pancreas in vivo, using a 31P whole-body transmit coil4 in combination with a multi-channel 31P receive array5 at 7T.6 It is not yet known how the concentrations of 31P metabolites in the pancreas relate to those in other tissues, such as in the neighboring and more commonly studied liver. The aim of this study was therefore to compare 31P metabolite levels in the pancreas and liver in healthy volunteers. For this, we collected 31P MRSI data with a large field of view (FOV), covering the whole abdomen, using the afore mentioned setup.Methods
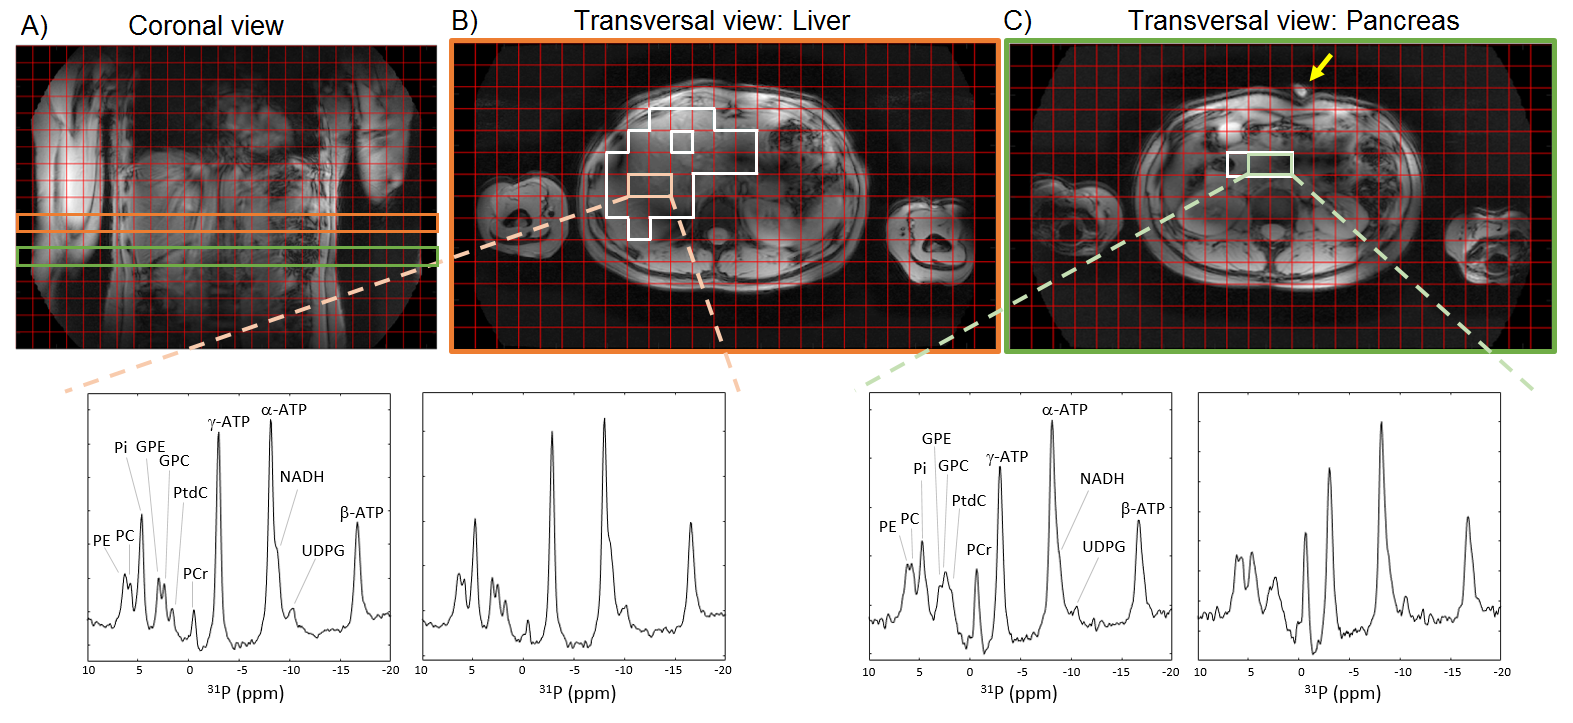
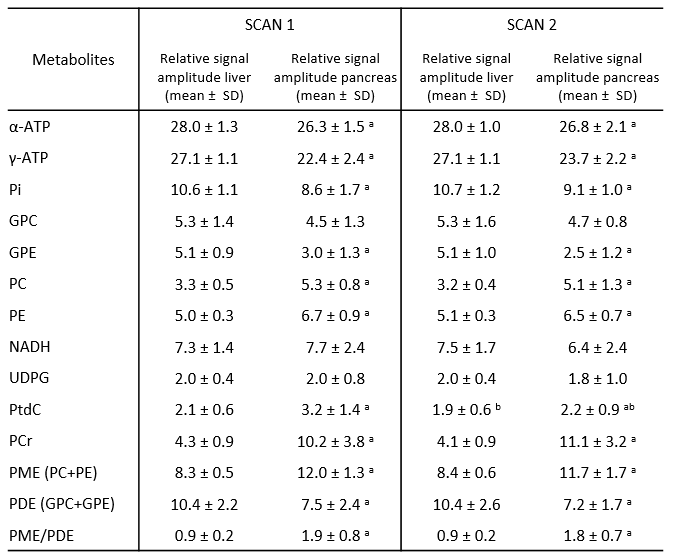
Ten healthy volunteers (6M/4F, age 34±12y) were included in this approved study. All participants provided written informed consent. A whole-body 7T MR system (Philips Healthcare, Best, NL) was used with a 31P whole-body birdcage transmit coil integrated in the MRI (diameter 60cm).4 In addition, a body array with 16 31P receive loop coils and 8 transmit-receive fractioned 1H dipole antennas5,7 were used to receive the 31P signals and perform 1H MRI, respectively. All healthy volunteers were scanned twice on the same day. B0 maps were acquired for B0 shimming and transversal and coronal T1-weighted (T1w) images were measured with the same FOV and number of slices as for 31P MRSI. The following acquisition parameters were used for 31P MRSI: FOV=500(LR)×280(AP)×360(FH)mm3, nominal resolution=20mm isotropic, TR=60ms, acquisition delay=0.56ms, FA=12°, BW=5000Hz, NSA=20, acquisition time=22:37min. Data were collected with Hamming weighted k-space sampling without respiratory gating. Matlab R2019a (The Mathworks Inc., Natick, MA) was used to reconstruct the 31P MRSI data. PCA-based denoising8 was performed before applying Roemer channel combination.9 Two separate masks, one for the liver and one for the pancreas, were manually drawn on the T1w images. 31P MR spectra from the voxels in both masks were quantified using AMARES in the spectroscopy fitting tool (OXSA) using the same prior knowledge.10-12 The following metabolite signals were fitted: α-ATP, γ-ATP, inorganic phosphate (Pi), glycerophosphocholine (GPC), glycerophosphoethanolamine (GPE), phosphocholine (PC), phosphoethanolamine (PE), nicotinamide adenine dinucleotide (NADH), uridine diphosphate glucose (UDPG), phosphocreatine (PCr), and phosphatidylcholine (PtdC). β-ATP was excluded for metabolite quantification, because of the limited bandwidth of the excitation pulse. Voxels with fitted PCr or PtdC amplitudes higher than α-ATP were removed, because this indicates contamination from muscle or the gallbladder, respectively. Fitted metabolite signal amplitudes were presented as percentage of the sum of all fitted signals and averaged over all voxels within the liver and pancreas masks, respectively. Two-way ANOVA of repeated measures with Bonferroni post-hoc analysis was performed to asses significant differences between the two scans and between pancreas and liver. Significance was set at p<0.05.Results
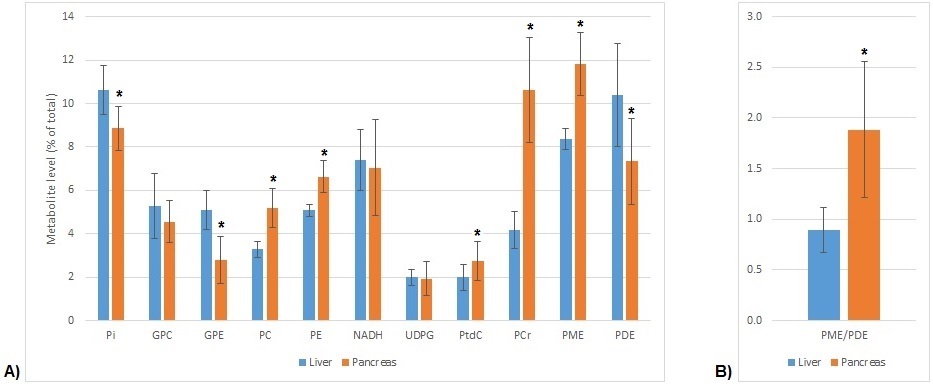
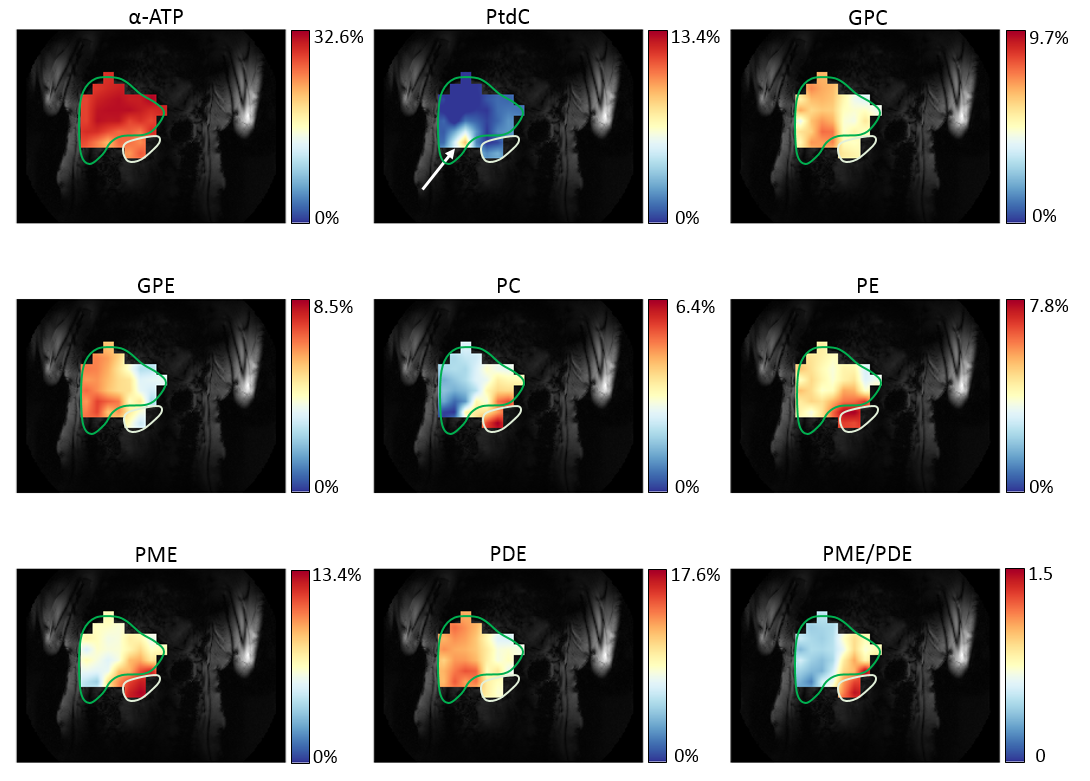
Figure 1 shows liver and pancreas masks for one subject, together with representative liver and pancreas 31P MR spectra. On average, 100±31 and 100±18 voxels were included in the liver masks for scan 1 and 2, respectively, and 4±2 and 4±1 voxels in the pancreas masks. 31P metabolite quantification results of the liver and pancreas of all 10 subjects are shown in Figure 2. Except for PtdC, no significant differences in 31P metabolite levels were observed between scan 1 and scan 2. GPC, NADH and UDPG did not differ between liver and pancreas, but levels of all other metabolites, i.e. α-ATP, γ-ATP, Pi, GPE, PC, PE, PtdC (gallbladder), PCr (muscle), PME, PDE, as well as the PME/PDE ratio, differed significantly between liver and pancreas, independent of the scan session. Averaged results of scan 1 and 2 are presented in Figure 3. Clear differences can be observed between the liver and pancreas for the PMEs and the PME/PDE ratio. Figure 4 shows metabolite maps for a coronal slice on the T1w 7T MRI scan of one volunteer.Discussion and conclusion
Using a 31P whole-body transmit coil in combination with a 31P receive array at 7T, we could obtain 31P MRSI data covering both the whole liver and the pancreas. Even without motion correction, significant differences were found for α-ATP, γ-ATP, Pi, GPE, PC, PE, PtdC, PCr, PME, PDE, as well as the PME/PDE ratio between liver and pancreas. Higher PtdC and PCr levels in the pancreas can be explained by the close proximity of the pancreas to the gallbladder and muscles, respectively. Otherwise, the largest differences were observed for GPE (46% lower in pancreas), and PC and PE (58% and 31% higher in pancreas, respectively), resulting in a 2.1-fold higher PME/PDE ratio in the pancreas than in the liver. Because an increased PME/PDE ratio has been used as a marker of increased cell proliferation in tumor tissue, the 2.1-fold higher PME/PDE ratio in the healthy pancreas is important to take into account when applying 31P MRS in PDAC.Acknowledgements
Dutch Cancer Society and Technical Sciences and St. Antonius Hospital Nieuwegein Research Fund
References
1. Mizrahi JD, Surana R, Valle JW, et al. Pancreatic cancer. Lancet. 2020;27;395(10242):2008-2020.
2. Rahib L, Wehner MR, Matrisian LM, et al. Estimated Projection of US Cancer Incidence and Death to 2040. JAMA Netw Open. 2021;1;4(4):e214708.
3. Negendank W. Studies of human tumors by MRS: a review. NMR Biomed. 1992 Sep-Oct;5(5):303-24.
4. Löring J, Van der Kemp WJM, Almujayyaz S, et al. Whole-body radiofrequency coil for 31P MRSI at 7T. NMR Biomed. 2016 Jun;29(6):709-20.
5. Van Houtum Q, Mohamed Hoesein FAA, Verhoeff JJC, et al. Feasibility of 31P spectroscopic imaging at 7 T in lung carcinoma patients. NMR Biomed. 2021 May;34(5):e4204.
6. Seelen LWF, Van den Wildenberg L, Gursan A, et al. In-vivo 31P MRSI in healthy and malignant human pancreas at 7 Tesla, in ISMRM 31st annual meeting, 2022, p. 7915.
7. Raaijmakers AJE, Italiaander M, Voogt IJ, et al. The fractionated dipole antenna: A new antenna for body imaging at 7 Tesla. Magn. Reson. Med. 2016 Mar;75(3):1366-74.
8. Veraart J, Novikov DS, Christiaens D, et al. Denoising of diffusion MRI using random matrix theory. Neuroimage. 2016;142:394-406.
9. Roemer PB, Edelstein WA, Hayes CE, et al. The NMR Phased Array. Magn. Reson. Med. 1990 Nov;16(2):192-225.
10. Purvis LAB, Clarke WT, Biasiolli L, et al. Line-width constraints in Matlab AMARES using pre-Metabolite T2 and per-Voxel Delta B0. in In Proceedings of the 22nd Annual Meeting of ISMRM, p. 2885.
11. Vanhamme L, Van Den Boogaart A, Van Huffel S. Improved Method for Accurate and Efficient Quantification of MRS Data with Use of Prior Knowledge. Journal of Magnetic Resonance. 1997 Nov;129(1):35-43.
12. Purvis LAB, Clarke WT, Biasiolli L, et al. OXSA: An open-source magnetic resonance spectroscopy analysis toolbox in MATLAB. PLoS One. 2017 Sep 22;12(9):e0185356.
Figures