0506
Characterization of small bowel strictures in Crohn’s disease with multiparametric MRI1Department of Diagnostic, Molecular and Interventional Radiology, Icahn School of Medicine at Mount Sinai, New York, NY, United States, 2Icahn School of Medicine at Mount Sinai, NY, NY, United States, 3BioMedical Engineering and Imaging Institute, Icahn School of Medicine at Mount Sinai, New York, NY, United States, 4Motilent Ltd, London, United Kingdom, 5Department of Pathology, Icahn School of Medicine at Mount Sinai, NY, NY, United States, 6Department of Gastroenterology, Icahn School of Medicine at Mount Sinai, New York, NY, United States
Synopsis
Keywords: Digestive, Quantitative Imaging, Crohn's disease; stricture; mpMRI;
Small bowel stricture (SBS) is the one of the most common complications of Crohn’s Disease (CD) and it usually requires surgical management. Imaging diagnosis and characterization of SBS is essential for proper patient management, however this may be challenging with conventional MRI techniques. In current study, we investigate the utility of advance MRI techniques namely multiparametric MRI (mpMRI) including diffusion, perfusion, and motility in the characterization and tissue composition in CD-related SBS. Our preliminary results suggest that mpMRI parameters are promising tools to characterize SBS and may be helpful in the stratification of patients for medical treatment vs surgery.Introduction
Crohn’s disease (CD) is a chronic inflammatory disease characterized by periods of symptomatic relapse and remission. Approximately half of CD patients have intestinal complications, such as strictures or fistulas, within 20 years after diagnosis and most of the patients with stricture will require at least one surgery during their lifetime1. Imaging diagnosis and characterization of small bowel strictures (SBS) is challenging. Here, we used multiparametric MRI (mpMRI) including diffusion, perfusion, and motility for the characterization and tissue composition in CD-related SBS. A secondary aim was to assess the value of the same parameters for the differentiation between SBS and inflamed segments without SBS.Methods
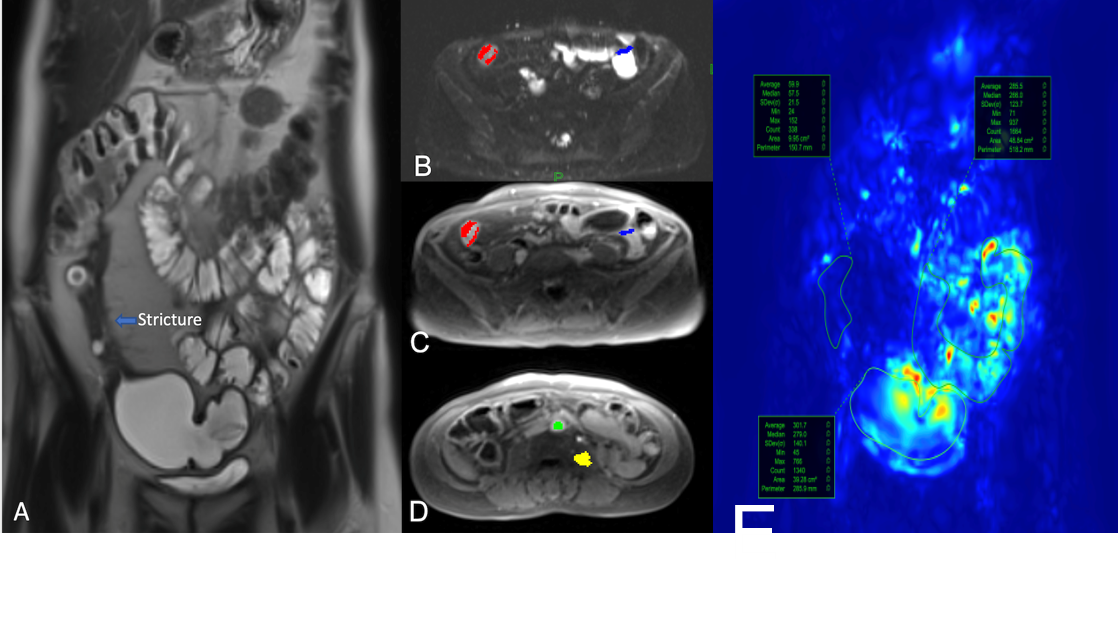
This was a prospective single-center study. 23 patients (F/M: 10/13; mean {range} age: 34y {18-73y}) with CD and inflammation without SBS (n=8) or surgically proven SBS (n=15) who underwent pre-surgical (for SBS cases) MR enterography between October 2019 and November 2020 were included (Figure 1). Mean (range) interval between MR enterography and surgery was 32 days (2-112 days). Imaging was performed on 1.5T (Aera, Siemens) and 3T (Skyra, Siemens) scanners. Patients were scanned in fasting conditions, after bowel distension with a mannitol/sorbitol mixture (Breeza, Beekley Medical). Peristalsis was reduced by administration of glucagon (1mg IM). MR enterography protocol included intravoxel incoherent diffusion weighted imaging (IVIM-DWI), dynamic contrast enhanced MRI (DCE-MRI), and a motility sensitive sequence. IVIM-DWI consisted of an axial fat suppressed, single-shot, SE-EPI sequence with bipolar diffusion gradients and 8 b-values (0,25,50,75,100,200,400,800 s/m2)2. DCE-MRI acquisition consisted of an axial fat-suppressed 3D T1-weighted with temporal resolution of 3s/volume, after IV administration of gadobutrol (Gadavist) 0.1 mmol/Kg @ 2 ml/s, followed by a 30 ml saline flush2. Motility sensitive CINE MRI sequence was a single-slice, coronal 2D TrueFISP acquisition (20 frames, 1s/frame), acquired through the area of involvement, before glucagon administration3. Regions of interests (ROIs) were drawn on the involved SB segments as well as normal-looking remote SB on DWI, DCE, and motility maps. On DCE-MRI, two additional ROIs were placed in aorta to determine arterial input function (AIF) and in psoas muscle to be used as the reference tissue for AIF correction3 (Figure 2). IVIM-DWI parameters true diffusion coefficient (D), perfusion fraction (PF), pseudodiffusion coefficient (D*) were obtained by Bayesian fit, and ADC was calculated with monoexponential fit over 3 b-values. Extended Tofts model was fitted to the DCE-MRI concentration curves to estimate perfusion parameters and model-free parameters in the SB. Motility index was calculated in GIQuant (Motilent Inc.) software based on the deformation field for each pixel across the 20 CINE-MRI dynamics3. Length/wall thickness of the involved SB segments were measured on T2WI for all patients. Surgical specimens (n=15) were scored for both inflammation and fibrosis based on previously described CD pathological inflammation and fibrosis grading as grade 0/1/2 for both4. Mann-Whitney U-test was performed to investigate the utility of the mpMRI parameters for the differentiation of CD inflammatory and fibrosis grade 0 and 1 from grade 2 in patients with SBS.ROC analysis was used to determine the diagnostic performance of the DCE-MRI, IVIM, and motility parameters for diagnosing inflammatory and fibrosis grade 2. Performance of the same parameters in differentiating normal bowel, inflamed bowel, and strictured bowel was investigated by performing ANOVA test.Results
There were 8 SBS with grade 2, 7 with grade 0-1 fibrosis; 9 SBS with grade 2, 6 with grade 0-1 inflammation. Among all IVIM-DWI parameters, only ADC could differentiate fibrosis grade 2 from grade 0 and 1 with good performance (AUC:0.804, CI:0.55-1). Higher grade of fibrosis was associated with lower ADC levels (1.63±0.76 vs 1.81±0.25, P=0.049). Of the DCE-MRI parameters, upslope and time to peak (TTP) showed good (AUC:0.857, CI:0.62-1) and excellent (AUC:0.982, CI:0.92-1) performance, respectively in distinguishing grade 2 from grades 0-1 fibrosis. Segments with higher grade of fibrosis had longer TTP (359.5±91.6 vs 129.2±23.1) and lower upslope (0.99±0.35 vs 2.3±1.3). [OB1] Other mpMRI parameters did not show a significant performance (Figure 3). None of the MRI parameters including motility score could diagnose inflammatory SBS (Figure 4). Only perfusion fraction (P=0.004) and motility score (P<0.001) could distinguish SBS from normal and inflamed segments without strictures (Figure 5).Discussion
In this study, we found that SBS with high grade fibrosis had lower ADC and upslope as well as higher TTP values compared to SBS with low grade fibrosis. To the best of our knowledge, this is the first prospective study evaluating SBS with mpMRI. Low upslope and prolonged TTP are consistent with less gadolinium contrast uptake in areas of high fibrosis. Similarly, lower ADC is consistent with more diffusion restriction in SBS with higher fibrosis. We also found that motility may distinguish between different pathologic conditions of the small bowel.Conclusion
Our preliminary results suggest that mpMRI parameters are promising tools to characterize SBS and may be helpful in the stratification of patients for medical treatment vs surgery. Future studies with larger cohort are needed for validation.Acknowledgements
This work was funded by Crohn’s and Colitis Foundation.References
1. Chang, C. W., Wong, J. M., Tung, C. C., Shih, I. L., Wang, H. Y., & Wei, S. C. (2015). Intestinal stricture in Crohn's disease. Intestinal research, 13(1), 19.
2. Hectors, S. J., Gordic, S., Semaan, S., Bane, O., Hirten, R., Jia, X., ... & Taouli, B. (2019). Diffusion and perfusion MRI quantification in ileal Crohn’s disease. European Radiology, 29(2), 993-1002.
3. Rohrer M, Bauer H, Mintorovitch J, Requardt M, Weinmann HJ. Comparison of magnetic properties of MRI contrast media solutions at different magnetic field strengths. Invest Radiol. 2005;40(11):715-24. PubMed PMID: 16230904.
4. Zappa, Magaly, et al. "Which magnetic resonance imaging findings accurately evaluate inflammation in small bowel Crohn's disease? A retrospective comparison with surgical pathologic analysis." Inflammatory bowel diseases 17.4 (2011): 984-993.
Figures