0504
Mapping human gastric motility using contrast-enhanced MRI with a natural test meal1University of Michigan, Ann Arbor, MI, United States
Synopsis
Keywords: Digestive, Digestive
MRI with oral contrast agents has been increasingly used to image the gastrointestinal tract in animals and humans. However, it has not been established for broad clinical applications. This study describes a set of natural ingredients abundant in manganese ions to enable rapid and contrast-enhanced MRI of the human gastrointestinal tract. A pipeline of advanced analyses reveals the structure of the stomach, dynamic transit of the food inside the stomach, and muscle activity of the stomach wall. Results offer quantitative biomarkers and mechanistic insights for gastric emptying, accommodation, and motility in humans, and merit future studies of gastrointestinal functional disorders.Purpose
MRI with an oral contrast agent has been increasingly used to image the gastrointestinal tract in animals and humans[1-4]. However, gastrointestinal MRI has not been established for broad clinical applications due to the lack of a standard and safe test meal, the challenge of imaging a wide field of view with high resolution and speed during free breathing, and the lack of an analysis pipeline to assess gastric function at both the individual and group levels. This study aims to fill these gaps by using a test meal with natural ingredients and developing an automated pipeline to map gastric motility using clinical 3-Tesla MRI.Methods
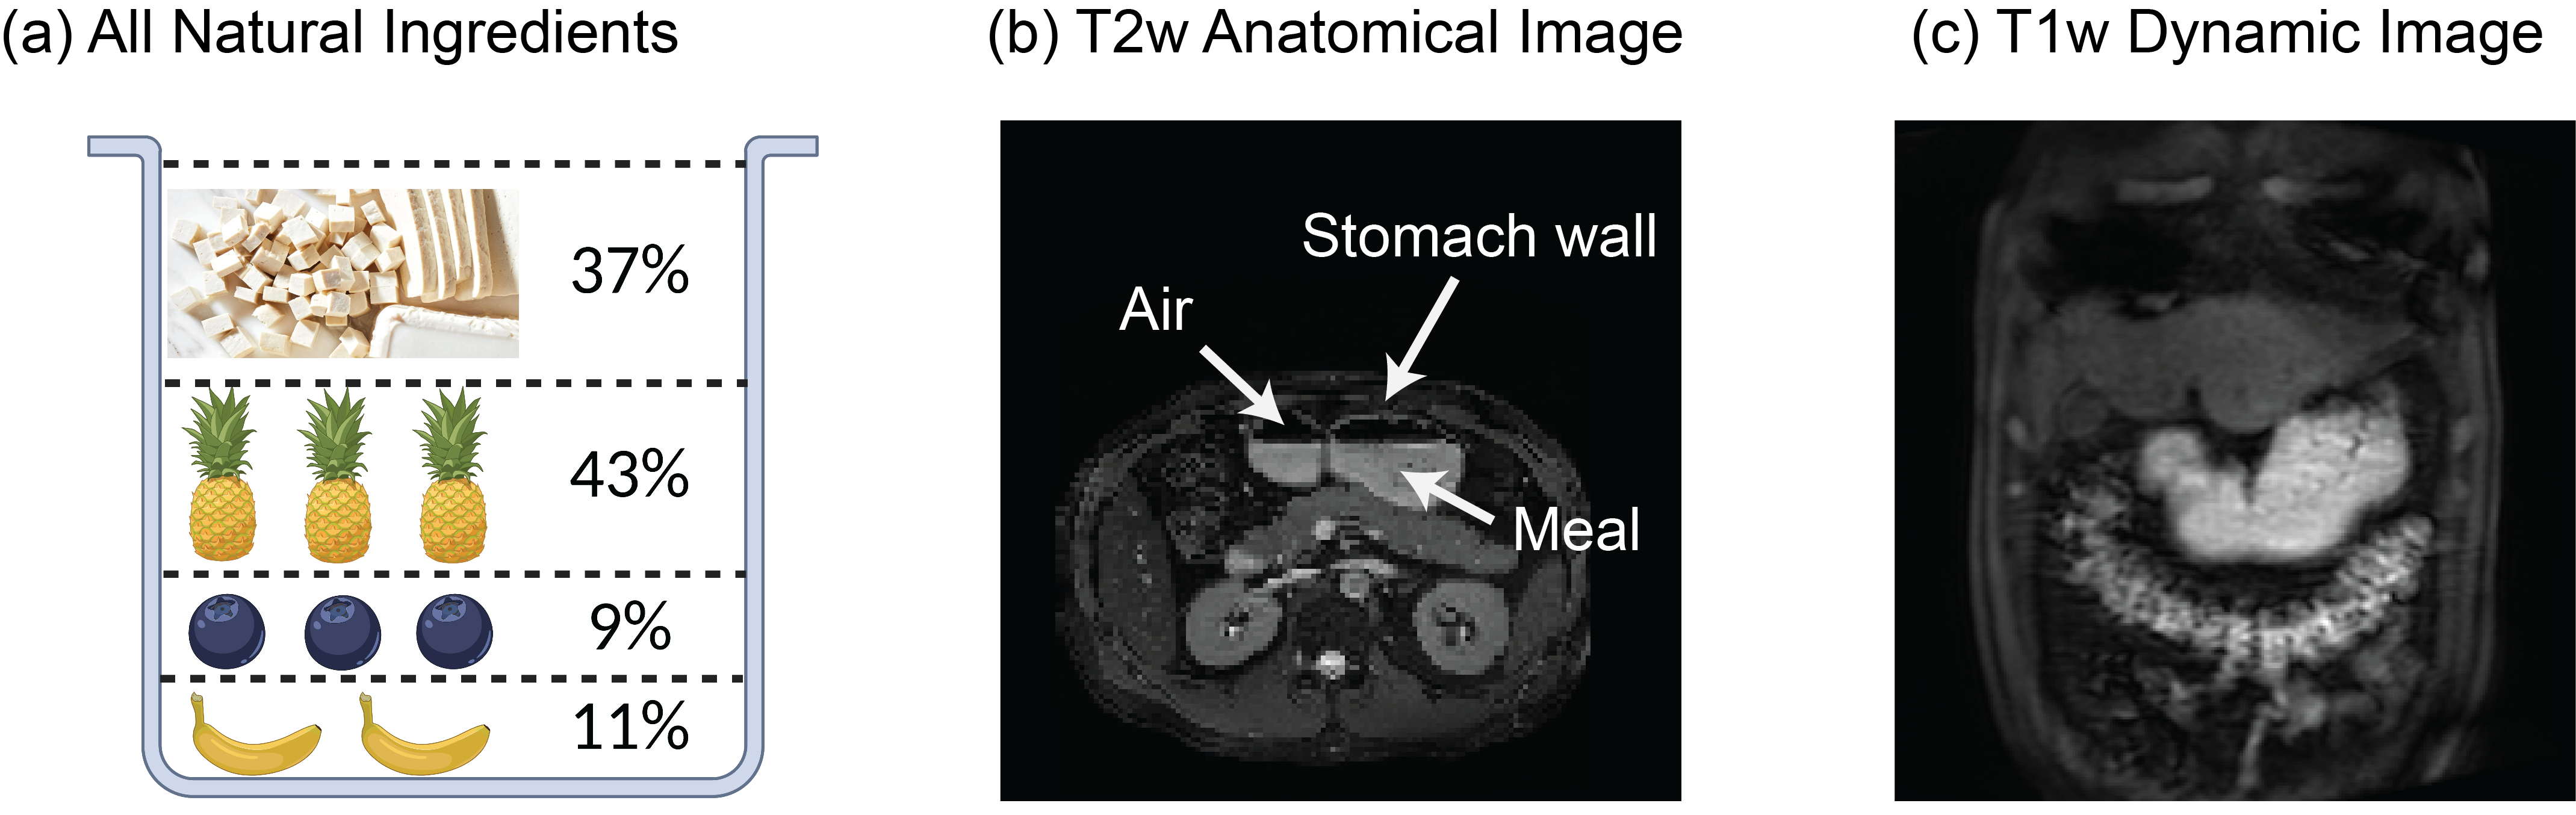
Healthy subjects (n=6) consumed a test meal after overnight fasting. The test meal (~350 g) included tofu (37%), pineapple (43%), blueberries (9%), and banana (11%), which were blended into a smoothie form with appropriate amounts of calories, sugar, and protein (Fig. 1.a). Manganese ions are abundant in these ingredients and offer a natural T1-shortening contrast agent. Briefly after consuming the test meal, each subject was scanned in a 3-T MRI system from either Siemens or GE. Gastric anatomy was scanned using 2-D balanced Steady-State Free Precession (bSSFP, or TRUFI for Siemens and FIESTA for GE) (TR = 3.35 ms, TE = 1.34 ms, FA = 50⁰, FOV = 400 × 400 mm2, voxel size = 0.78 × 0.78 × 4 mm3, 33 axial slices). Gastric motility was scanned using 3-D spoiled gradient echo (SPGR, or VIBE for Siemens and LAVA for GE) with fat saturation and free breathing (TR = 3.02 ms, TE = 1.33 ms, FA = 12⁰, FOV = 360 × 360 mm2, 200 mm thick slab, voxel size = 1.9 × 2.8 × 3.8 mm3, repeated at 3 s per volume for 5 mins, with rate-5 acceleration). The dynamic MRI images were corrected for respiratory motion artifacts and then segmented to delineate the stomach and intestines using a method described elsewhere[3]. Uniquely, a surface template of the human stomach[5] was used as a model of the stomach wall, which was deformable through a neural ordinary differential equation to track the movement of the stomach observed with MRI[6]. The surface movement was further characterized in terms of frequency, phase, amplitude, and coordination, providing a comprehensive set of quantitative measures of gastric motility, as recently explored in animals[6].Results
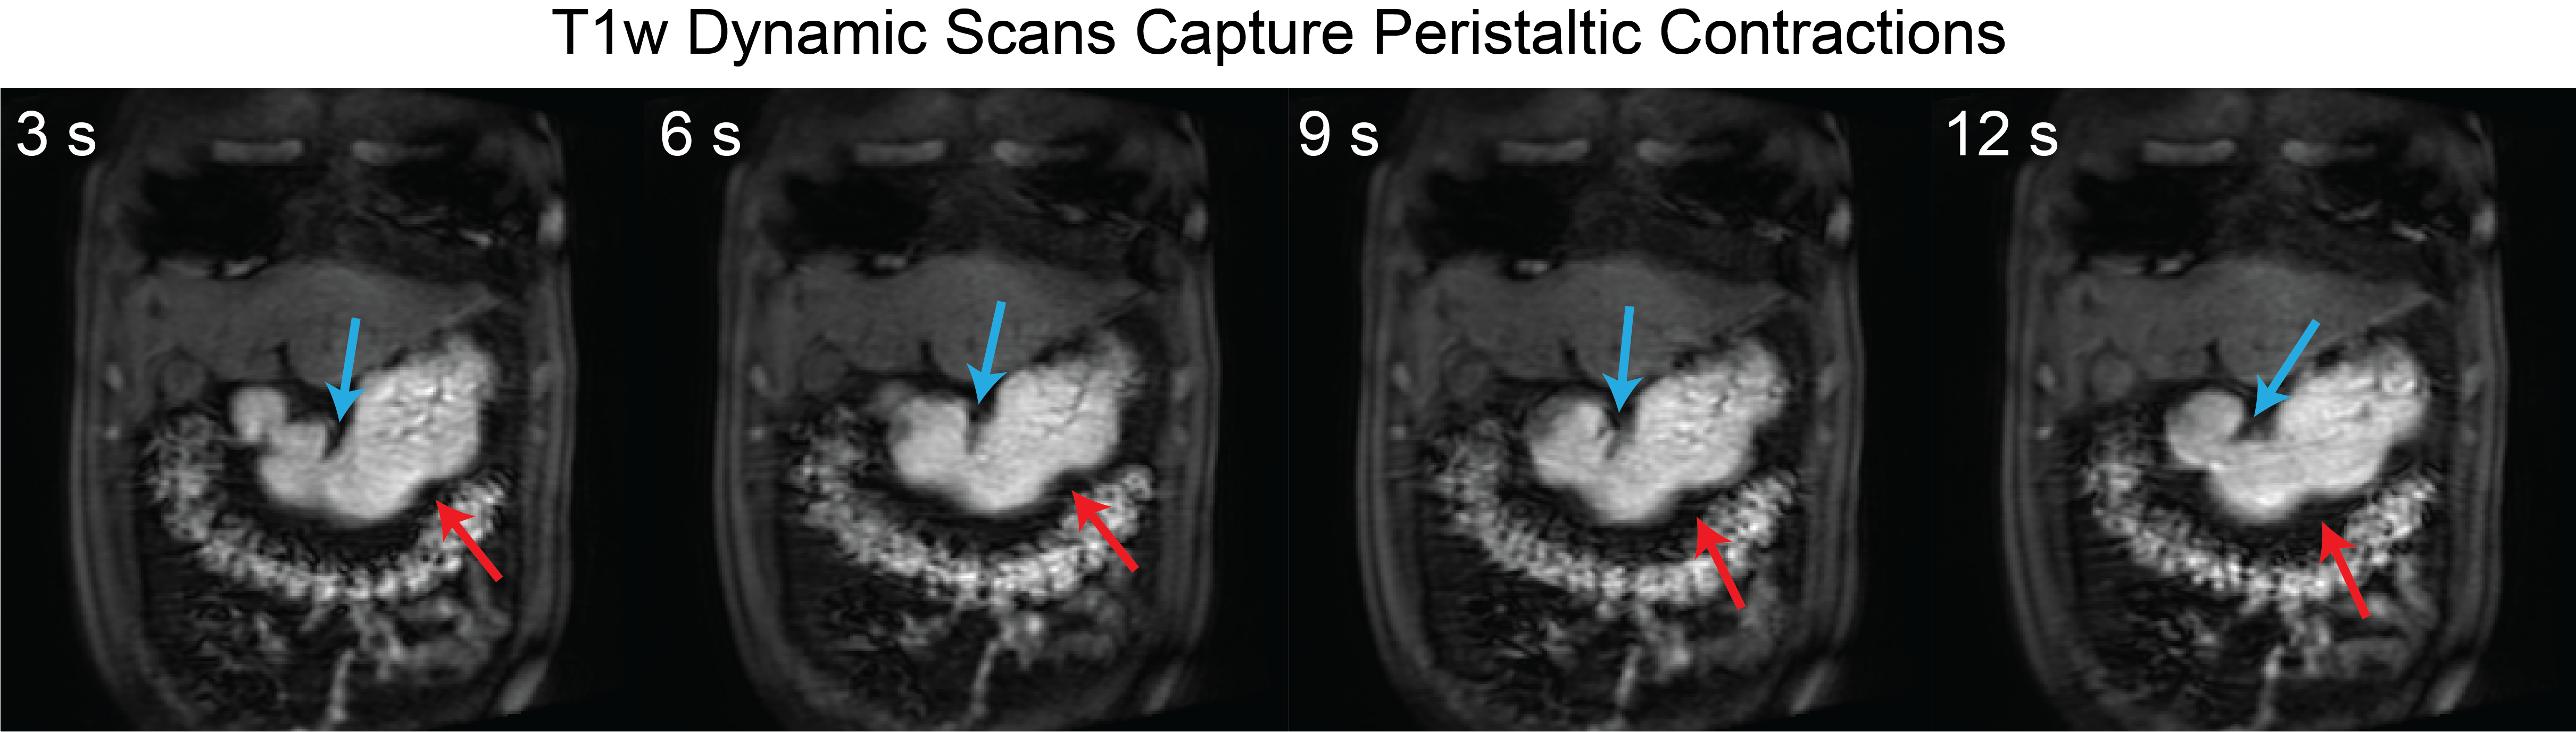
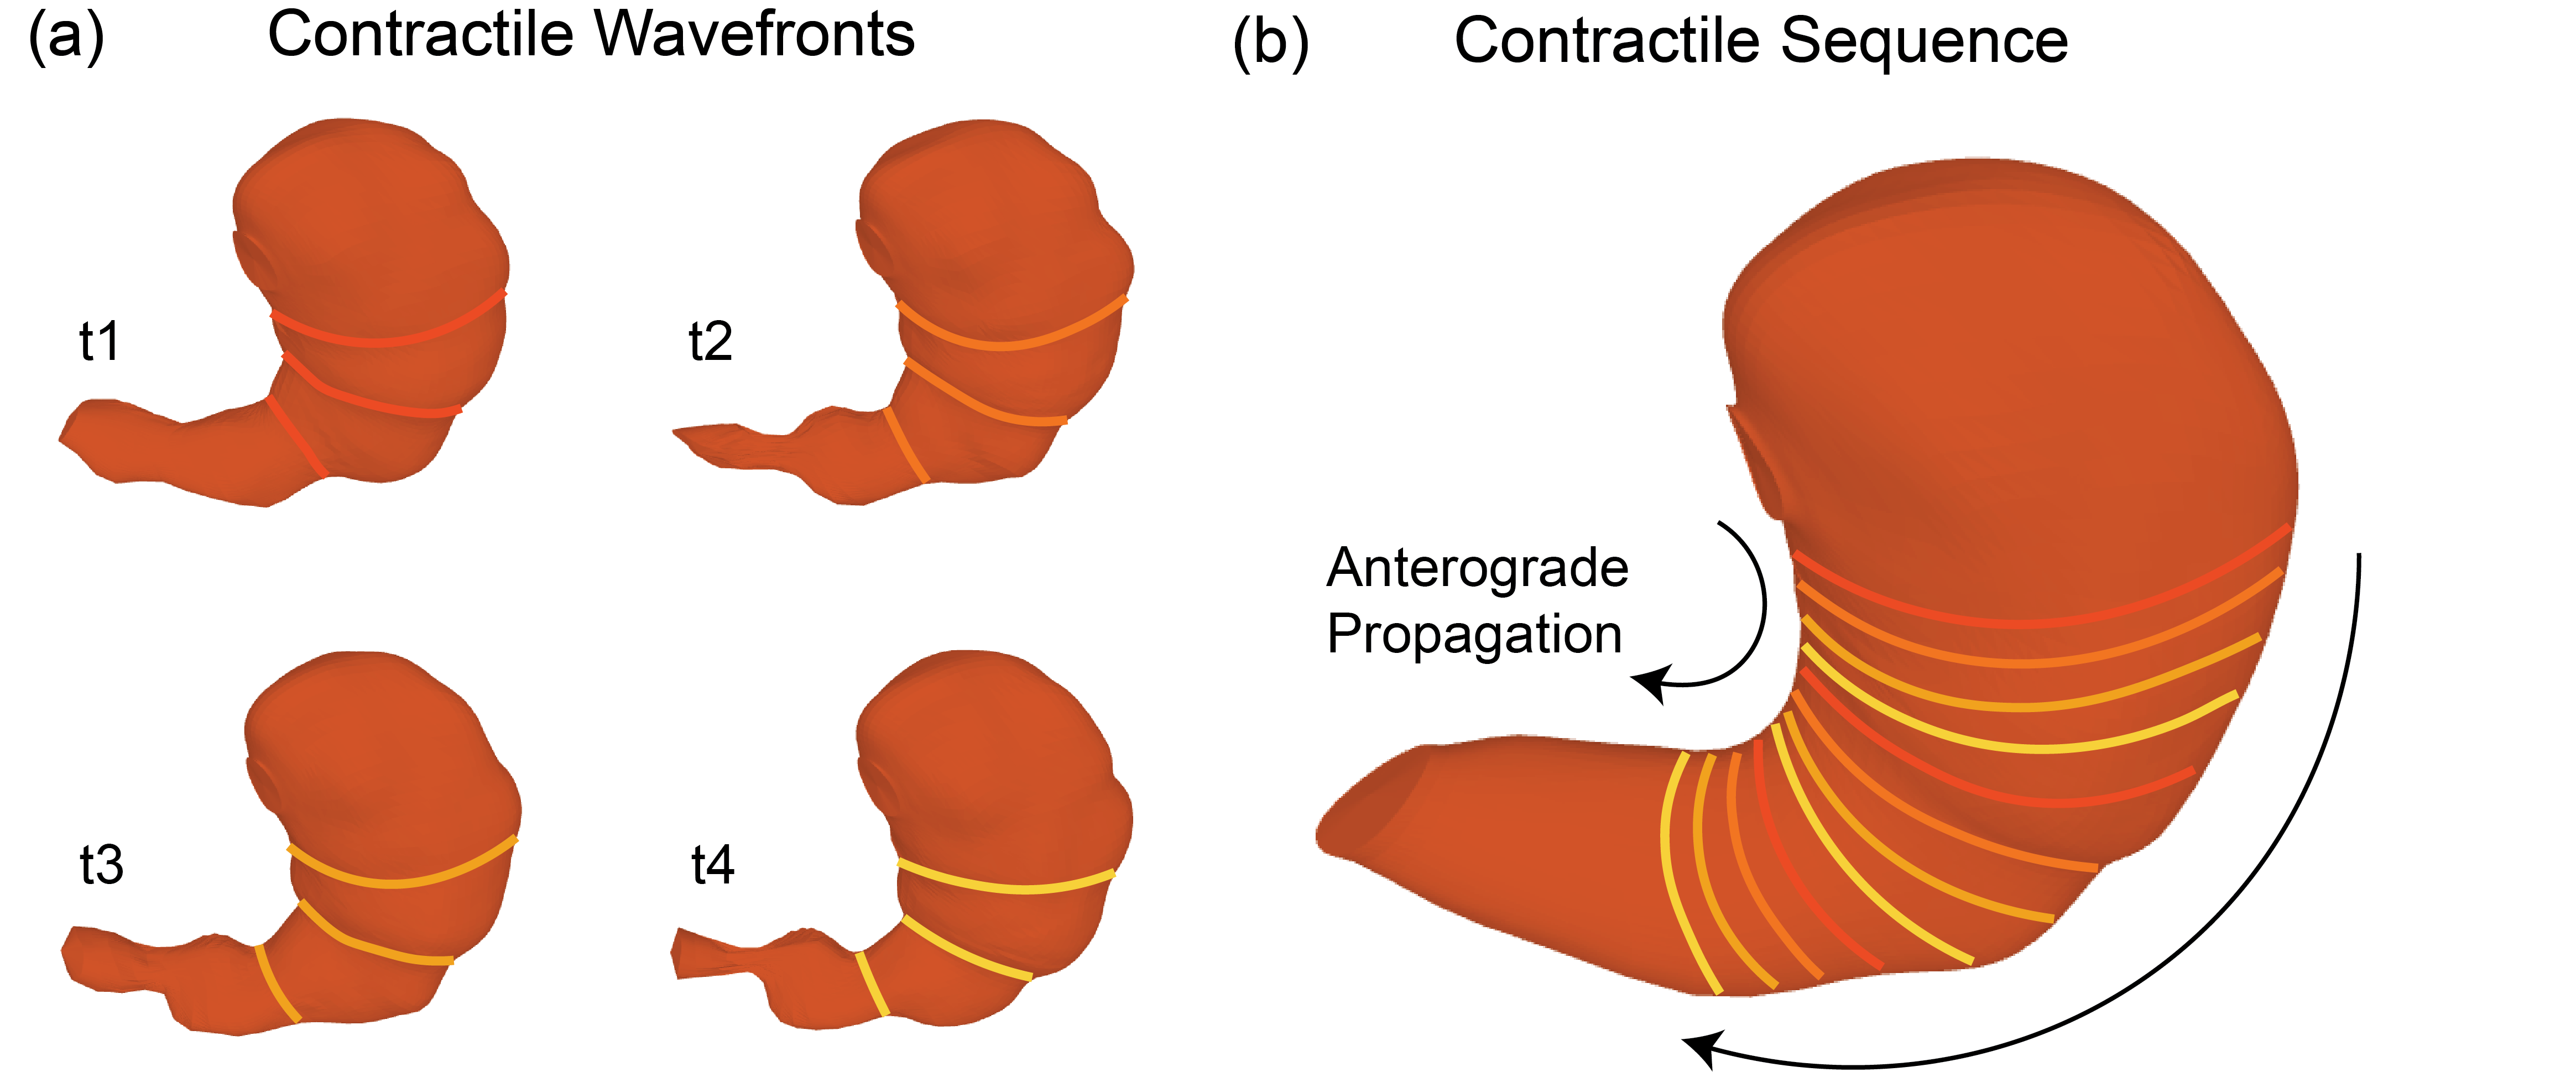
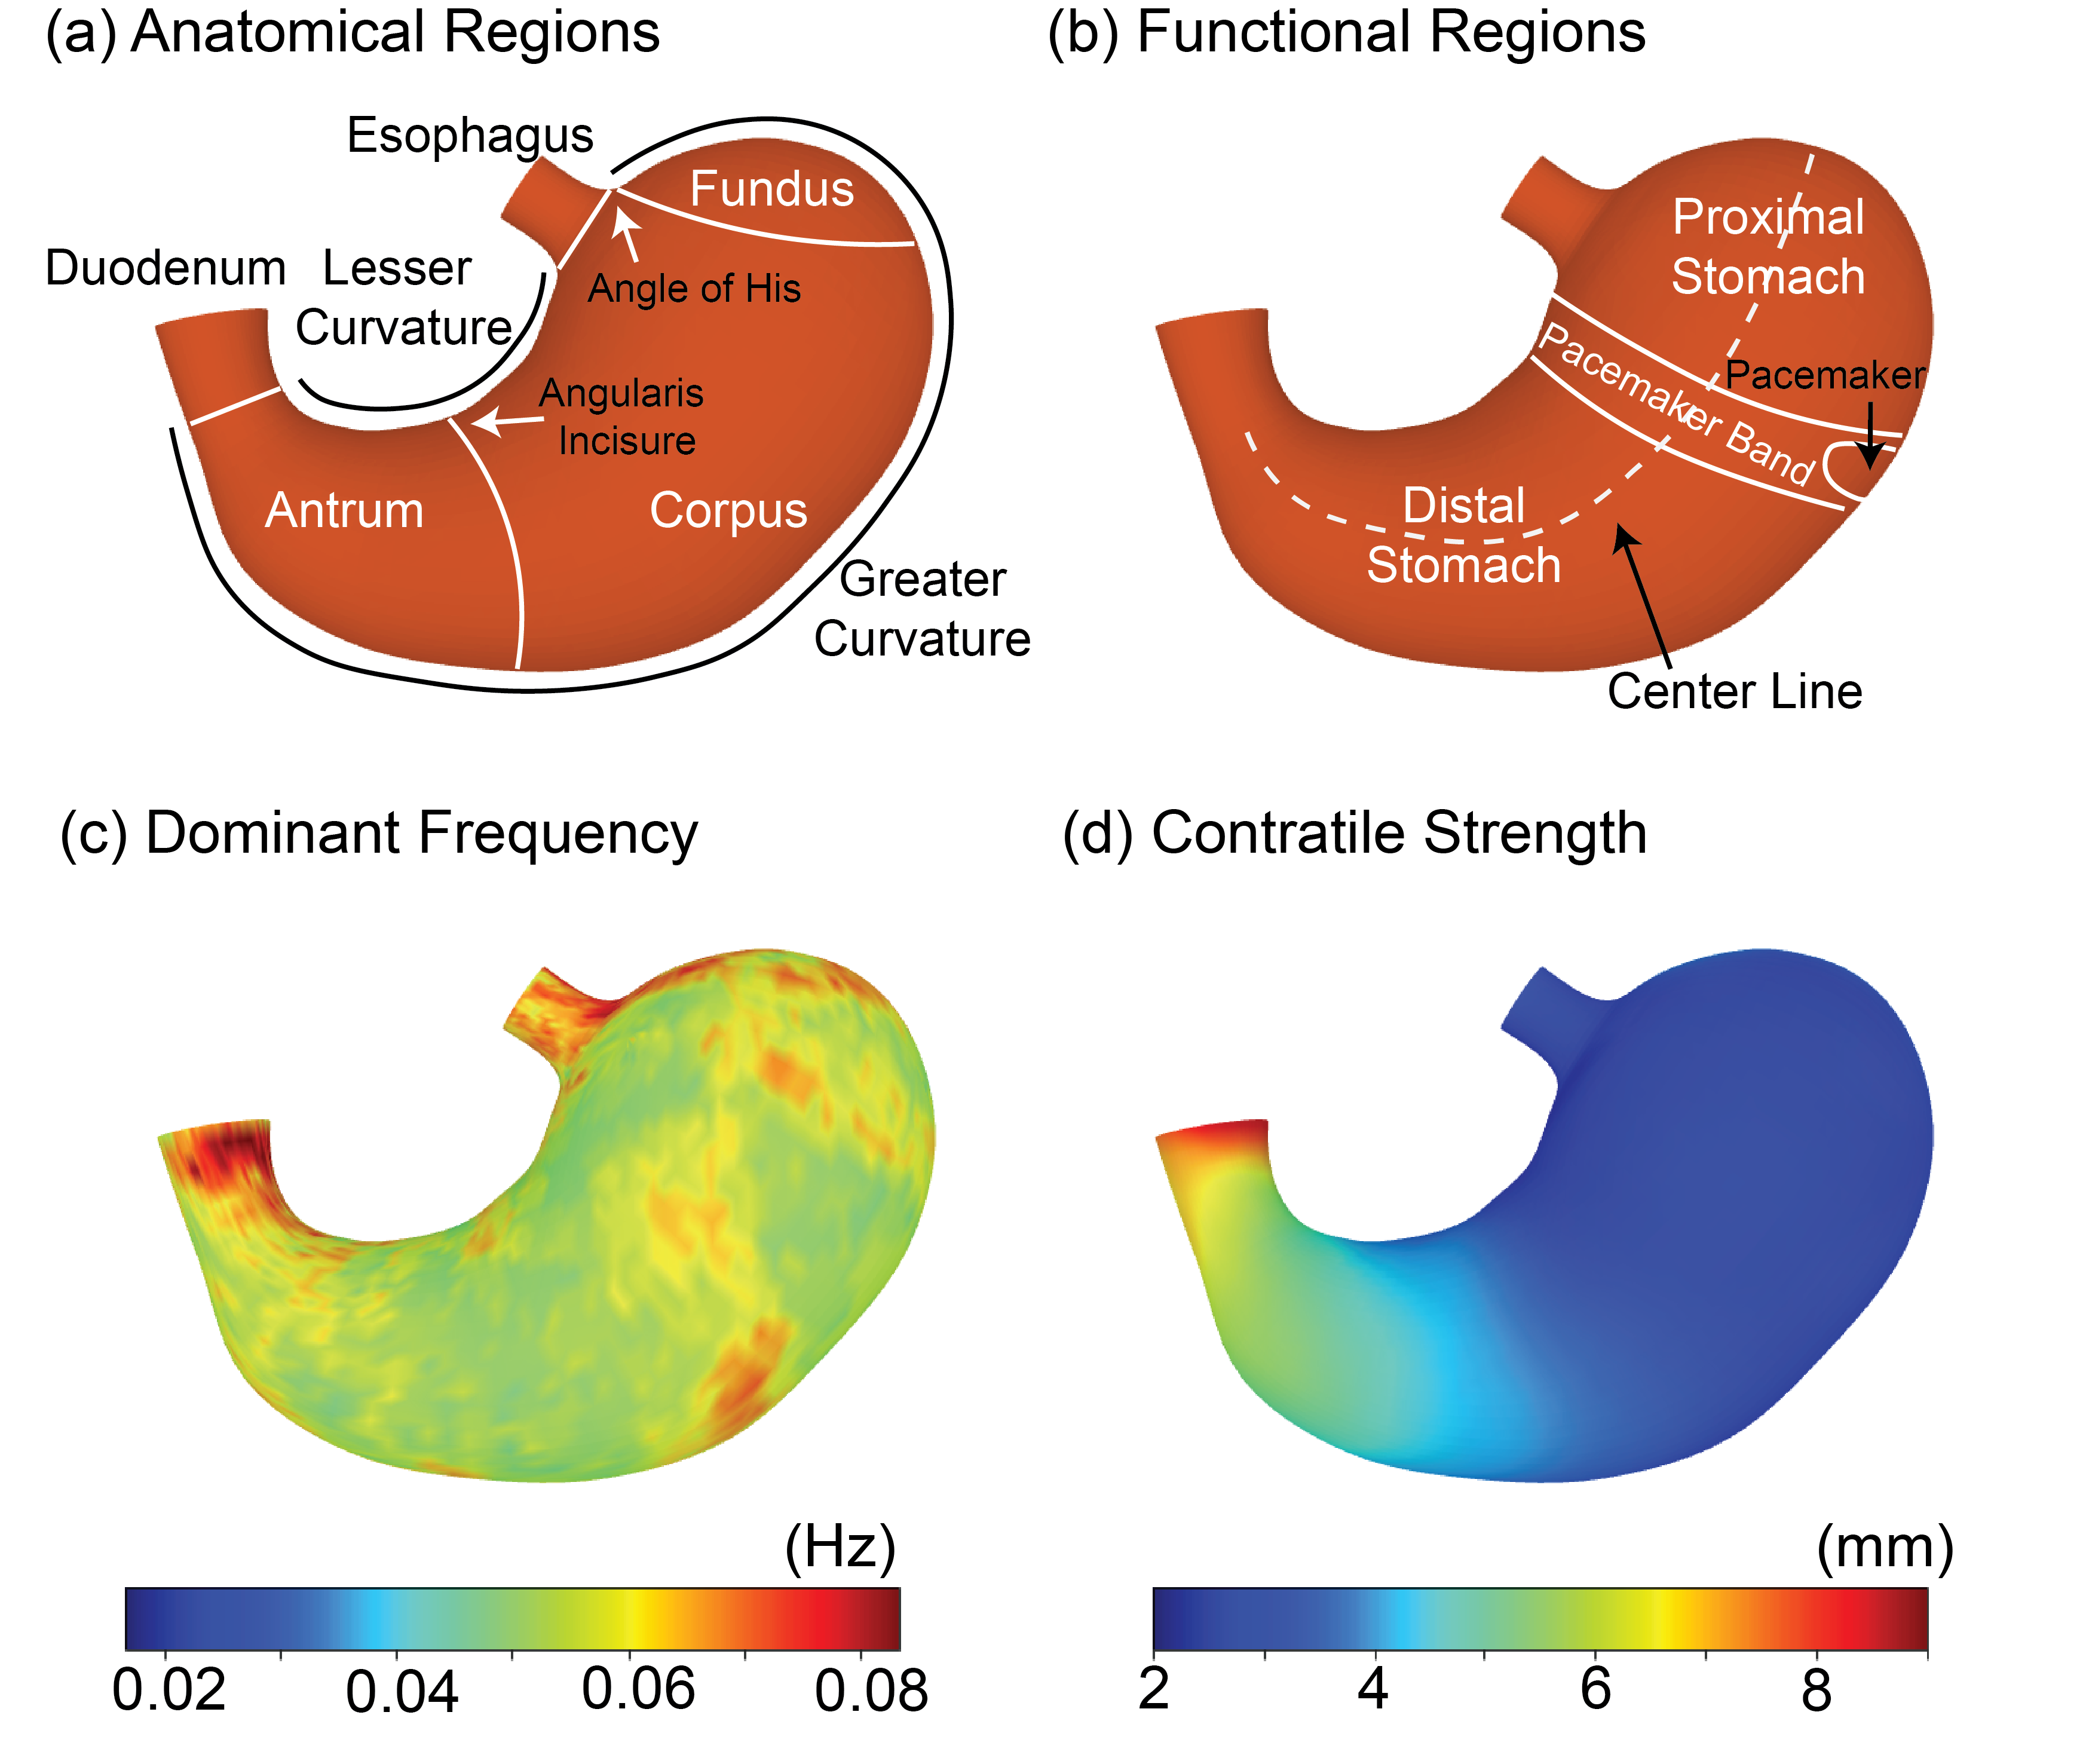
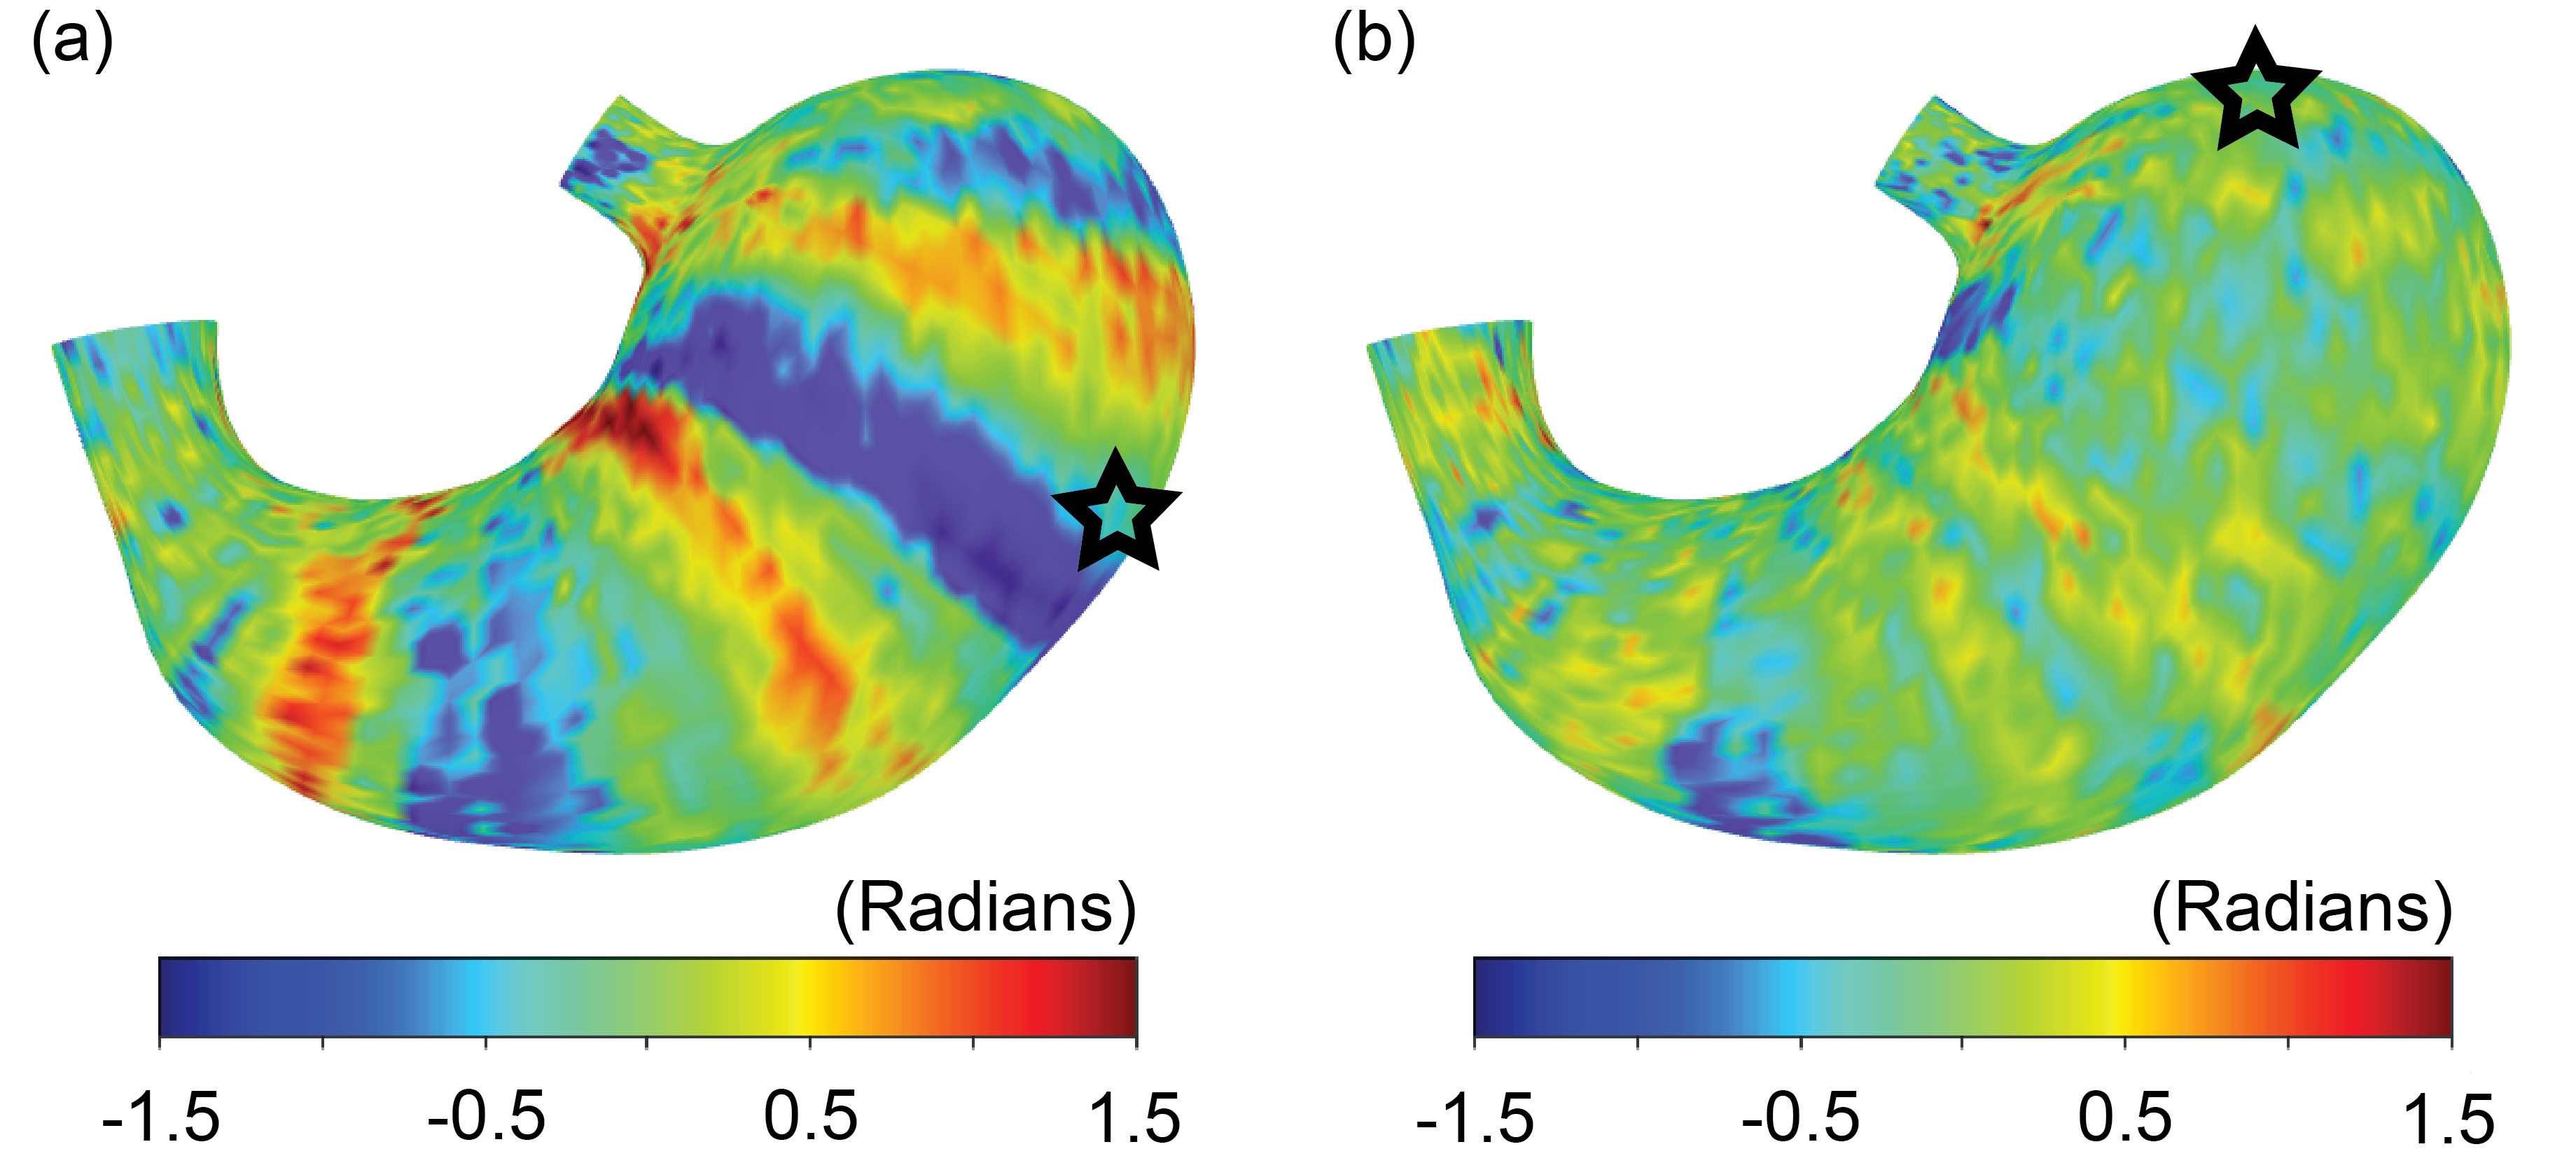
The all-natural test meal rendered the gastrointestinal tract visible in both T2-weighted anatomical images (Fig. 1.b) and T1-weighted dynamic images (Fig. 1.c). The anatomical images delineated the stomach wall against the air and food inside the stomach (Fig. 1.b). The dynamic images revealed the moving contour of the luminal content, which showed differential contrasts for the food and the secreted gastric juice inside the stomach (Fig. 1.c). The contour showed a wave-like curvature variation and the wavefronts moved over time, indicating the propagation of muscle contractions and relaxations also known as gastric motility (Fig. 2). Patterns of gastric motility were further characterized using the surface model of the stomach. At each time, the contractile wavefronts were identified as multiple circumferential rings (Fig. 3.a). Overlaying the time-resolved wavefronts on the time-averaged stomach surface revealed a temporal sequence of gastric contraction propagating in a proximal-to-distal direction (Fig. 3.b). The contraction frequency and amplitude averaged over subjects revealed regional distinction in gastric motility (Fig. 4). The dominant frequency was 3.72 ± 0.42 cycles per minute, whereas higher frequencies were found at the esophagus, pylorus, and the fundus (Fig. 4.c). The strength of contraction was stronger in the antrum (> 8 mm) than in the fundus (< 2 mm), showing a clear gradient of amplitude variation along the proximal-to-distal direction (Fig. 4.d). Such regional distinctions were consistent but more fine-grained than the conventionally defined structural and functional regions of the stomach. Since the rhythmic contractions were thought to initiate from a “pacemaker” region in the corpus (Fig. 4.b), we also evaluated whether and how the rhythmic contraction at each location was phase-coupled to that at the pacemaker region. The relative phase to the pacemaker region showed a spatial pattern of wave propagation for 3 to 5 cycles over the length of the stomach (Fig. 5.a). The phase coupling was much reduced relative to the proximal fundus, which was a mechanically quiescent area of the stomach (Fig. 5.b).Conclusion
Gastrointestinal MRI with an all-natural and standardized meal provides a safe and comprehensive way to image and assess gastric motor function. It provides quantitative measures of gastric emptying and surface-based characterization of gastric motility, and by doing so, sheds mechanistic insights into how the stomach accommodates, grinds, and propels food at an appropriate rate for digestion. This study merits future applications of this technique for the diagnosis and treatment of gastrointestinal functional disorders.Acknowledgements
No acknowledgement found.References
[1] Khalaf, Asseel, Caroline L. Hoad, Robin C. Spiller, Penny A. Gowland, Gordon W. Moran, and Luca Marciani. "Magnetic resonance imaging biomarkers of gastrointestinal motor function and fluid distribution." World journal of gastrointestinal pathophysiology 6, no. 4 (2015): 140.
[2] Lu, Kun-Han, Jiayue Cao, Steven Thomas Oleson, Terry L. Powley, and Zhongming Liu. "Contrast-enhanced magnetic resonance imaging of gastric emptying and motility in rats." IEEE Transactions on Biomedical Engineering 64, no. 11 (2017): 2546-2554.
[3] Lu, Kun‐Han, Zhongming Liu, Deborah Jaffey, John M. Wo, Kristine M. Mosier, Jiayue Cao, Xiaokai Wang, and Terry L. Powley. "Automatic assessment of human gastric motility and emptying from dynamic 3D magnetic resonance imaging." Neurogastroenterology & Motility 34, no. 1 (2022): e14239.
[4] Sclocco, Roberta, Christopher Nguyen, Rowan Staley, Harrison Fisher, April Mendez, Christopher Velez, Norman W. Kettner, Braden Kuo, and Vitaly Napadow. "Non‐uniform gastric wall kinematics revealed by 4D Cine magnetic resonance imaging in humans." Neurogastroenterology & Motility 33, no. 8 (2021): e14146.
[5] Lin, Mabelle, Richard Christie, and Peter Hunter. “Generic Human Stomach Scaffold.” SPARC Consortium, 2022. https://doi.org/10.26275/D52I-YVES.
[6] Wang, Xiaokai, Jiayue Cao, Kuan Han, Minkyu Choi, Yushi She, Ulrich Scheven, Recep Avci et al. "Surface-based Characterization of Gastric Anatomy and Motility using Magnetic Resonance Imaging and Neural Ordinary Differential Equation." bioRxiv (2022).
Figures