0503
Prospective frequency correction with metabolite cycling for improved spectral quality in the prefrontal cortex at 7T
Kimberly L Chan1, Ivan E Dimitrov1,2, Madhukar H Trivedi3, and Anke Henning1,4
1Advanced Imaging Research Center, The University of Texas Southwestern, Dallas, TX, United States, 2Philips Healthcare, Gainesville, FL, United States, 3Center for Depression Research and Clinical Care, Department of Psychiatry, The University of Texas Southwestern, Dallas, TX, United States, 4Max Planck Institute for Biological Cybernetics, Tübingen, Germany
1Advanced Imaging Research Center, The University of Texas Southwestern, Dallas, TX, United States, 2Philips Healthcare, Gainesville, FL, United States, 3Center for Depression Research and Clinical Care, Department of Psychiatry, The University of Texas Southwestern, Dallas, TX, United States, 4Max Planck Institute for Biological Cybernetics, Tübingen, Germany
Synopsis
Keywords: Spectroscopy, Brain
The prefrontal cortex plays a central role in controlling executive functions such as decision-making and emotional-monitoring and has thus been the subject of several 1H-MRS studies on psychiatric illnesses. This region, however, is sensitive to motion-induced increases in linewidths due to the voxel moving away from the originally shimmed location. Here, we combined metabolite cycling (MC) with continuous prospective frequency correction to better account for frequency instabilities when performing single-voxel brain MRS at 7T. We find that MC sLASER with continuous prospective frequency correction reduces frequency instability, water linewidths, and N-acetylaspartate linewidths relative to semi-LASER acquisitions without prospective frequency correction.Purpose
The prefrontal cortex (PFC) plays a central role in controlling executive functions such as decision-making (1) and has thus been the subject of 1H-MRS studies on psychiatric illnesses (2). This region is more challenging to measure from, however, due to its proximity to air-tissue interfaces like the sinuses which causes significant B0 inhomogeneity from susceptibility effects. Although the region can be shimmed to improve B0 homogeneity, B0 magnetic field conditions rapidly deteriorate in areas adjacent to the originally shimmed location (3, 4). Thus, head and breathing motion can result in linewidth increases due to the voxel moving away from the originally shimmed location. We have previously demonstrated that continuous prospective frequency correction with metabolite cycling (MC) decreases macromolecule (MM) contamination and subtraction artifacts caused by frequency instabilities when performing MM-suppressed GABA-editing in the medial PFC relative to that with interleaved prospective frequency correction (4). Here, we combined MC with continuous prospective frequency correction to better account for frequency instabilities caused by motion and gradient-induced heating/cooling when performing semi-LASER and compare its performance to water-suppressed semi-LASER without prospective frequency correction at 7T.Methods
Figure 1 shows the MC sLASER sequence which includes an adiabatic MC pulse in place of water suppression pre-pulses. These pulses invert the upfield and downfield resonances in alternate transients while still retaining the full water signal. The high-intensity water signal allows for prospective frequency correction at each transient by Fourier transforming each FID, calculating the frequency offset from the nominal water frequency, and adding it to the spectrometer center frequency prior to the next transient acquisition.Acquisitions were performed in 4 healthy volunteers (2 female, age 35.5±15.7 years) on a 7T Philips Achieva scanner in a 2.5x2x2 cm3 voxel in the left dorsolateral PFC (dlPFC) with TE=30 ms, spectral width=4 kHz, and 32-channel receive head coil (Nova Medical). Additional acquisition parameters for the MC sLASER scans include TR=6.7 s and 96 transients (total scan time=11 mins). The transmit frequency of the MC pre-inversion pulse was shifted by -260 Hz and 260 Hz for the upfield and downfield RF inversion, respectively. Additional acquisition parameters for the water-suppressed sLASER scans (WS sLASER) include VAPOR water suppression, TR=4.5 s and 128 transients (total scan time=10 min). Water-unsuppressed sLASER (WU sLASER) scans were acquired with 32 transients and the same parameters as the water-suppressed scans except for the water suppression.
Data were analyzed using in-house software and Gannet (5) with time domain retrospective phase and frequency correction (6). The difference in the water frequency (ΔF0) from the nominal water frequency (4.68 ppm) and water linewidths were calculated from the water-unsuppressed sLASER scans. Signal-to-noise ratios (SNR) were calculated as the N-acetylaspartate (NAA) peak divided by the root-mean-square of the noise, while the linewidths of the metabolite spectra were calculated from the NAA peak. Paired two-sided t-tests were performed to assess group differences, and a p-value <0.05 was chosen to be statistically significant.
Results
Figure 2a shows an example left dlPFC voxel placement. Figure 2b shows example MC sLASER and WS sLASER spectra from one volunteer showing 1.4 Hz narrower linewidths in the MC sLASER spectrum than in the WS sLASER spectrum. The change in the water frequency and water linewidths over time as measured from the unsuppressed water signal with prospective frequency correction (MC sLASER) and without prospective frequency correction (WU sLASER) are shown in figure 3. MC sLASER shows minimal change in the water frequency over time while WU sLASER shows significantly greater change in the water frequency (up to 12 Hz) over time. MC sLASER also shows significantly lower water linewidths over time than WU sLASER. Figure 4 shows spectral quality metrics for MC sLASER, WU sLASER, and WS sLASER across subjects. The average ΔF0 and water linewidths are 9 Hz (p=0.013) and 1.2 Hz lower (p=0.011), respectively, in MC sLASER than in WU sLASER. Although SNR is equivalent between MC sLASER and WS sLASER at ~815, NAA linewidths are lower in MC sLASER than in WS sLASER (p=0.017) with a median linewidth reduction of 1.4 Hz across subjects, similar to the reduction in the water linewidths.Discussion
It can be seen that MC sLASER with continuous prospective frequency correction decreases the amount of B0 field instability relative to conventional WS sLASER without prospective frequency correction. MC sLASER is also shown to reduce linewidths relative to WU sLASER and WS sLASER even after retrospective frequency correction. The reduced linewidths with MC sLASER are likely due to a reduction in voxel movement away from the originally shimmed location. Conversely, the larger linewidths with WS sLASER relative to MC sLASER are likely due to the voxel moving into adjacent regions which contain greater B0 inhomogeneity which is further amplified by the ultra-high field strength of 7T. Although demonstrated here for the dlPFC, MC with prospective frequency correction is likely to provide the same benefit to other difficult-to-shim regions such as the temporal lobes. Larger reductions in linewidths with MC sLASER relative to WS sLASER are likely to be seen in pediatric and clinical populations which are more prone to movement than the healthy adult participants studied here and after gradient-intensive scans (e.g. fMRI, DTI scans).Acknowledgements
This work was funded by the Cancer Prevention and Research Institute of Texas (CPRIT) (Grant Number: RR180056, Principal Investigator: Anke Henning, PhD) and by the Center for Depression Research and Clinical Care (Principal Investigator: Madhukar H. Trivedi, MD), Hersh Foundation.References
1. Raccah et al., J Neurosci. 2021
2. Dubin et al., J Psychiatry Neurosci. 2016
3. Juchem et al., NMR Biomed. 2020
4. Chan et al., Magn. Reson. Med. 2021
5. Edden et al., J Magn Reson. Imaging. 2014
6. Near et al., Magn Reson Med. 2015
7. Hwang et al., J Magn Reson. 1999
8. Tannús and Garwood, NMR Biomed. 1997
Figures
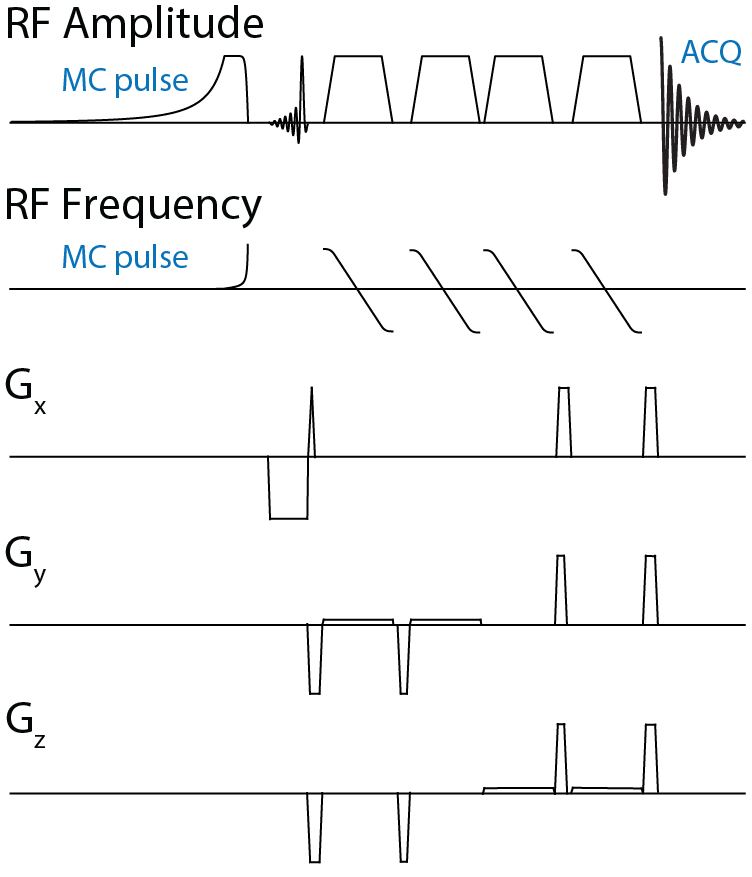
Figure 1. Pulse sequence diagram of the MC sLASER pulse sequence. Both sequences consist of an adiabiatic Hwang pulse for MC (7) followed by an asymmetric sinc excitation pulse and 4 adiabatic OIT pulses (8) for refocusing. Gx, Gy, and Gz denote gradients in the x, y, and z directions.
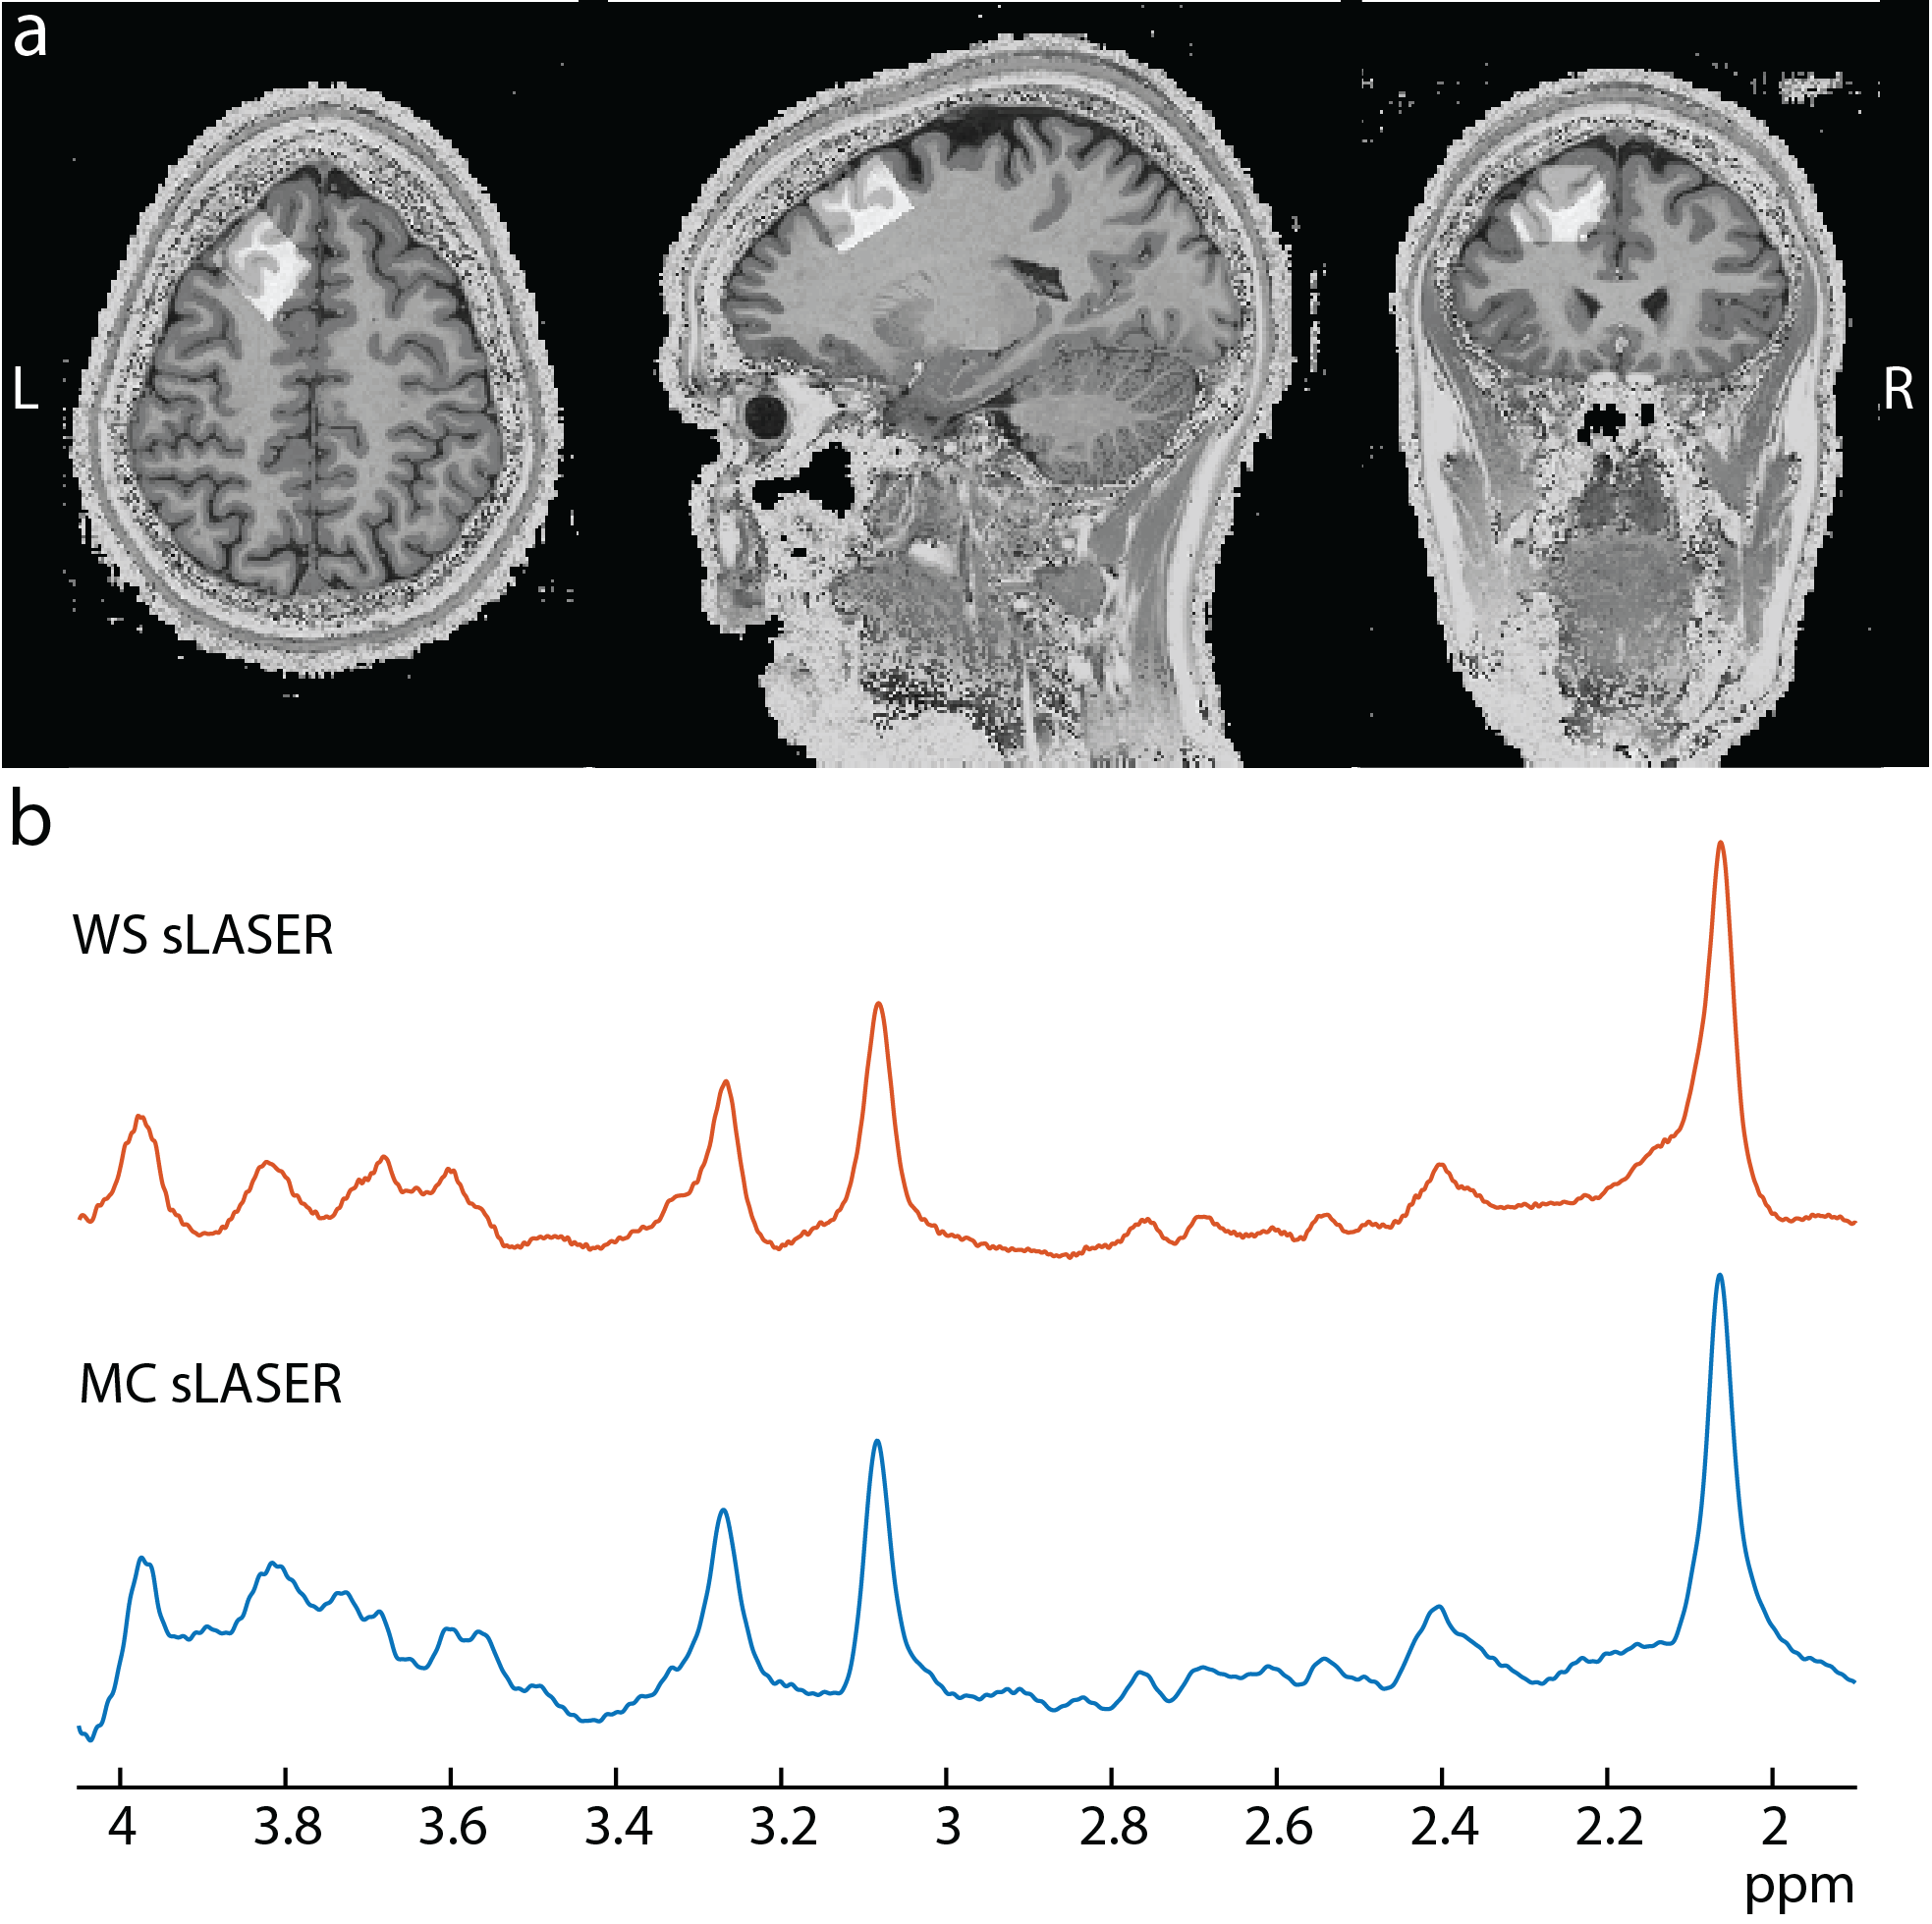
Figure 2. (a) Example voxel placement in the dlPFC (b) A representative MC sLASER spectrum (orange) and a representative WS sLASER spectrum (blue) in one subject showing 1.4 Hz larger spectral linewidths in WS sLASER than in MC sLASER.
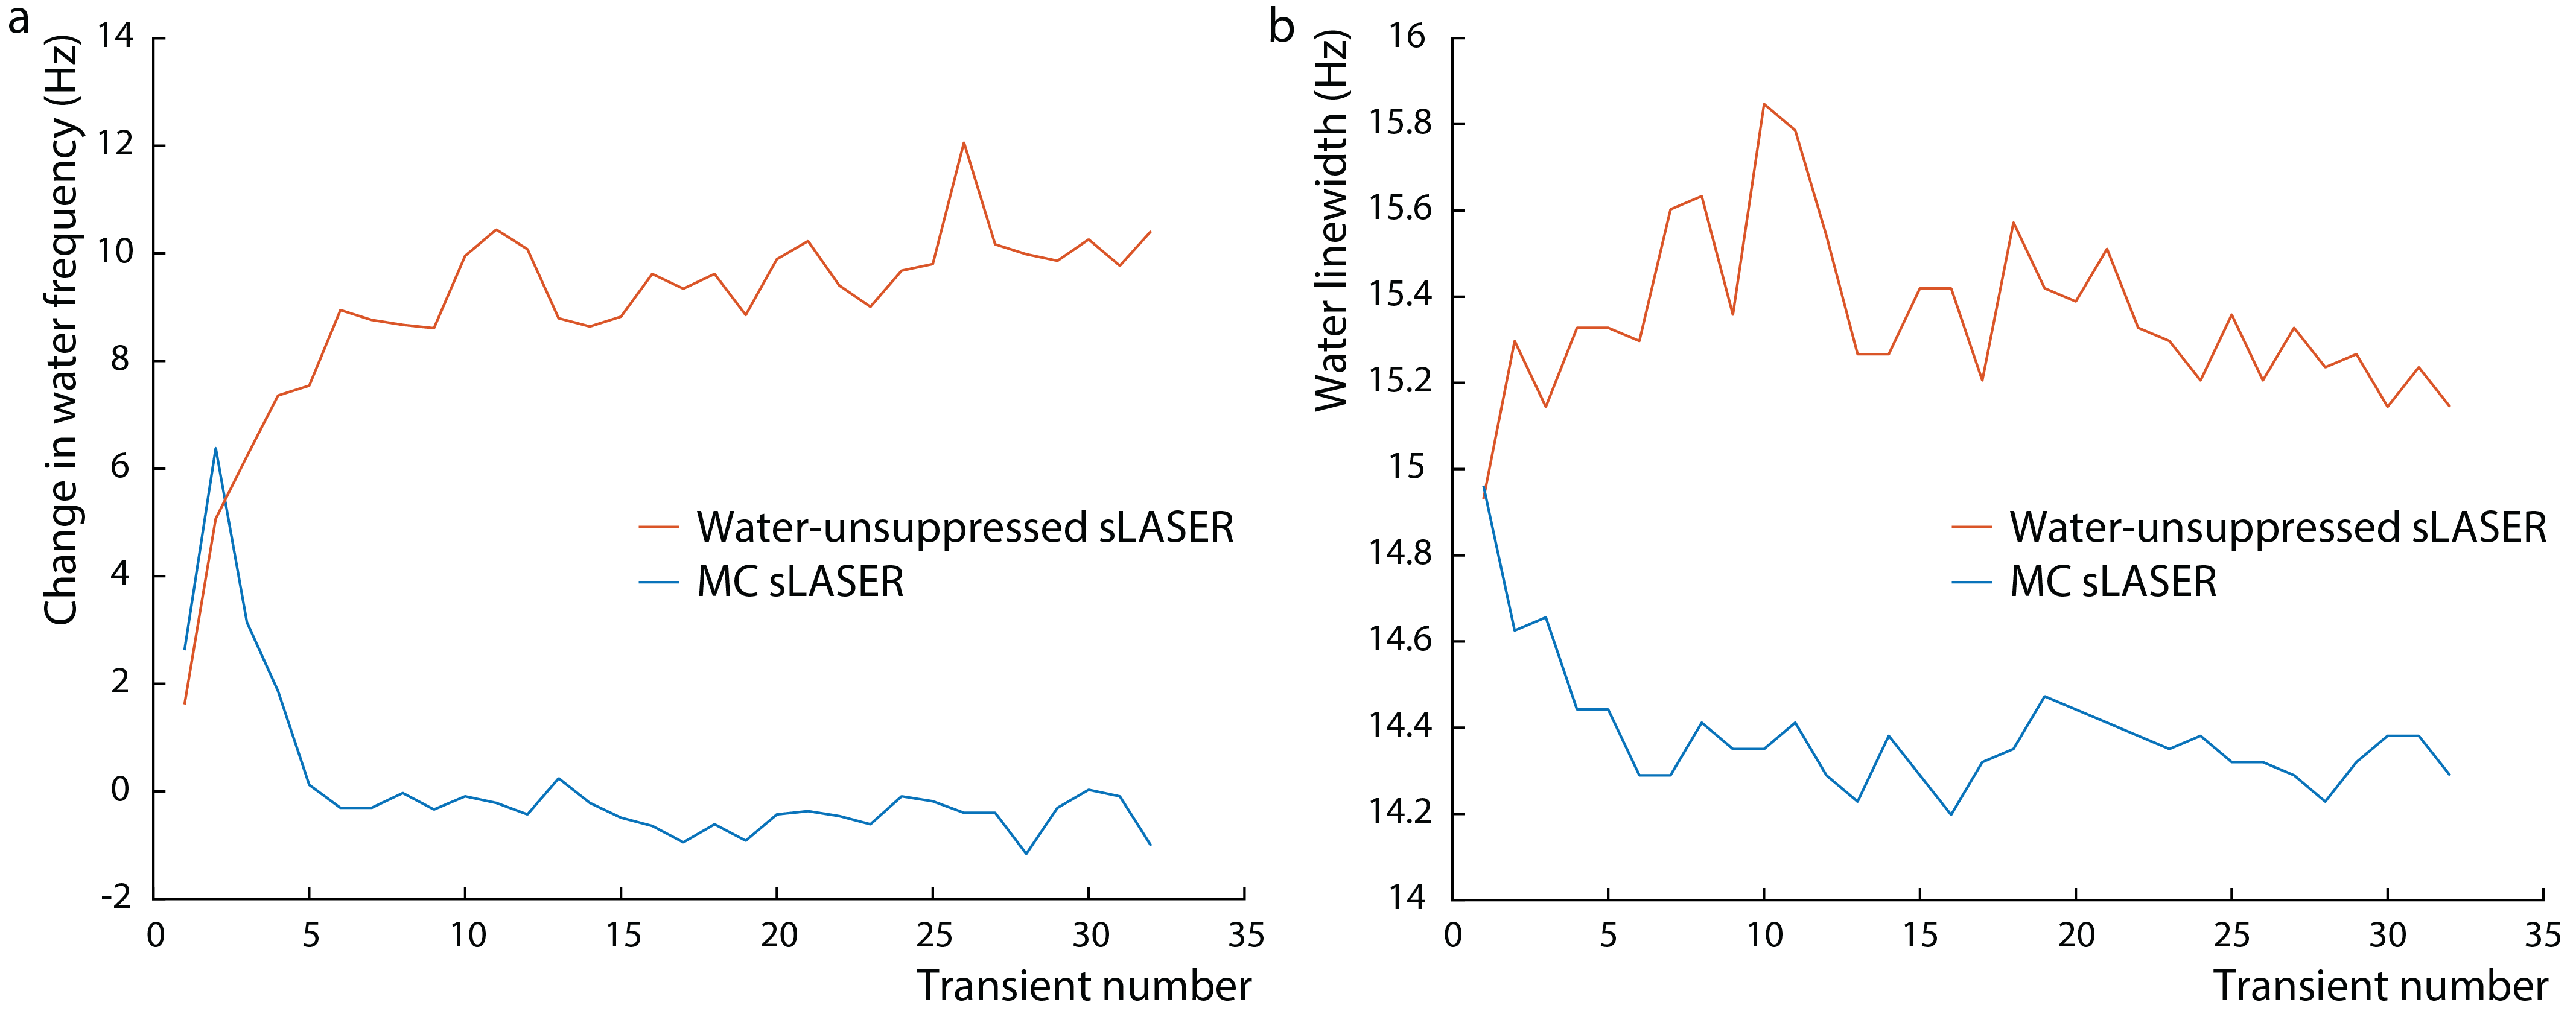
Figure 3. Change in the water frequency and water linewidths over time for both MC sLASER (blue) and WU sLASER (orange) for one volunteer.
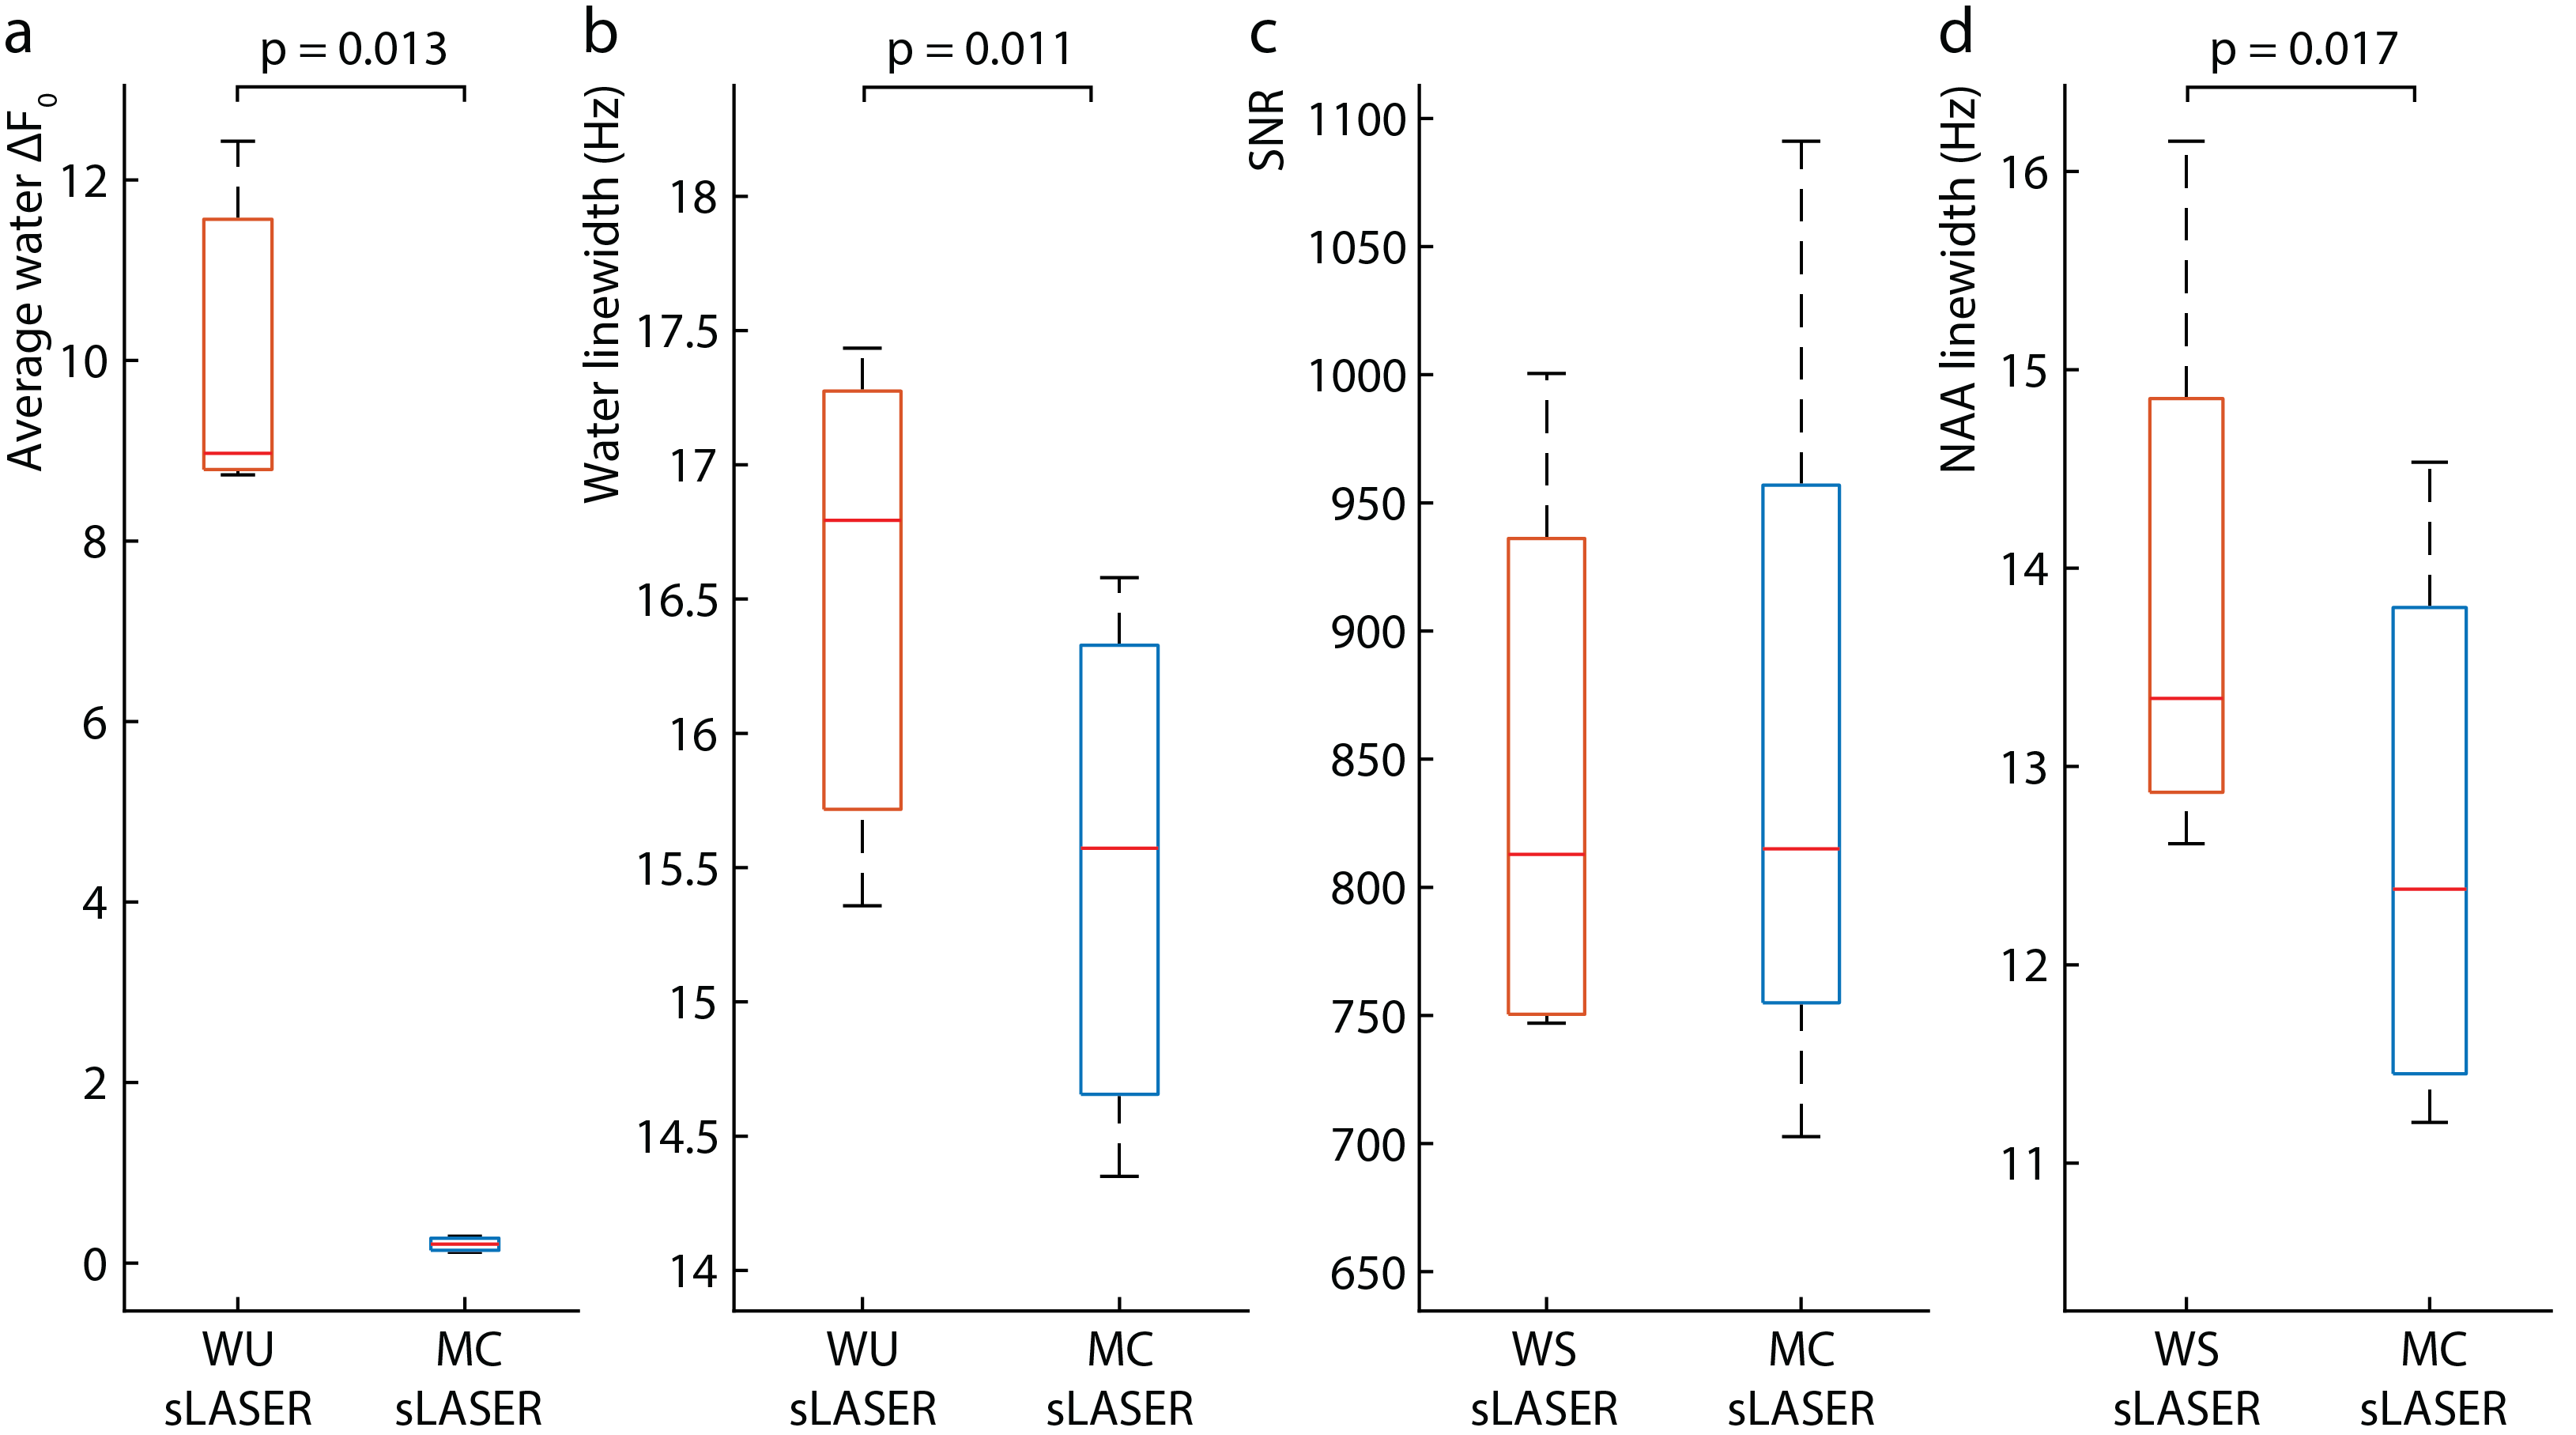
Figure 4. Quality metrics for MC sLASER, WU sLASER, and WS sLASER showing lower average frequency offsets (ΔF0) (a) and water linewidths (b) in MC sLASER than with WU sLASER. While SNR is equivalent between MC sLASER and WS sLASER (c), NAA linewidths are lower in MC sLASER than in WS sLASER (d).
DOI: https://doi.org/10.58530/2023/0503