0502
Glutamate and its relation to cortical thickness and perfusion across the cingulate cortex1Experimental Medicine, University of British Columbia, Vancouver, BC, Canada, 2ImageTech, Simon Fraser University, Surey, BC, Canada, 3Philips, Markham, ON, Canada, 4Psychiatry and Forensic Medicine, Universität Zürich, Zürich, Switzerland, 5Anesthesiology, Pharmacology and Therapeutics, University of British Columbia, Vancouver, BC, Canada
Synopsis
Keywords: Spectroscopy, Neuro, neuroscience
Investigating the relationships between morphological, functional, and metabolic changes in the brain can help reveal subtle changes caused by disease. To establish an understanding of the relationship between brain glutamate levels with cortical thickness (CT) and cerebral blood flow (CBF) in the healthy brain, magnetic resonance spectroscopy (MRS), arterial spin labeled MRI and anatomical MRI were obtained from 4 sub-divisions of the cingulate cortex. A linear mixed effects model revealed that glutamate was significantly correlated with CT (p=0.05, R2=0.30) but not with CSF (p=0.21, R2=0.17) within healthy participants. These results will help inform studies of disease or therapeutic interventions.Introduction
Gross morphological, functional, and metabolic changes in the brain have been reported for a number of neurological conditions1–7. To resolve subtler forms of pathology, studies have also addressed the impact of disease on the relationship between morphometry, function, and metabolism. For example, in Wijtenburg and colleagues, the relationship between glutamate and cerebral blood flow (CBF) was examined as a measure of schizophrenia, with patients demonstrating a stronger correlation compared to healthy controls8. Others have examined the relationship between glutamate and CBF as a measure of drug effects – a positive correlation emerging after the administration of ketamine9. The adoption of such approaches begs the question of whether morphometry, function, and metabolism are normally correlated in the resting, healthy, adult brain. To address this question, glutamate concentrations, CBF, and cortical thickness (CT) were measured in healthy brains from 4 distinct regions of the cingulate cortex. Our analysis focused on evaluating the correlation between glutamate and CBF, as well as glutamate and CT, within participants using a linear mixed effects model, and between participants using a linear model.Methods
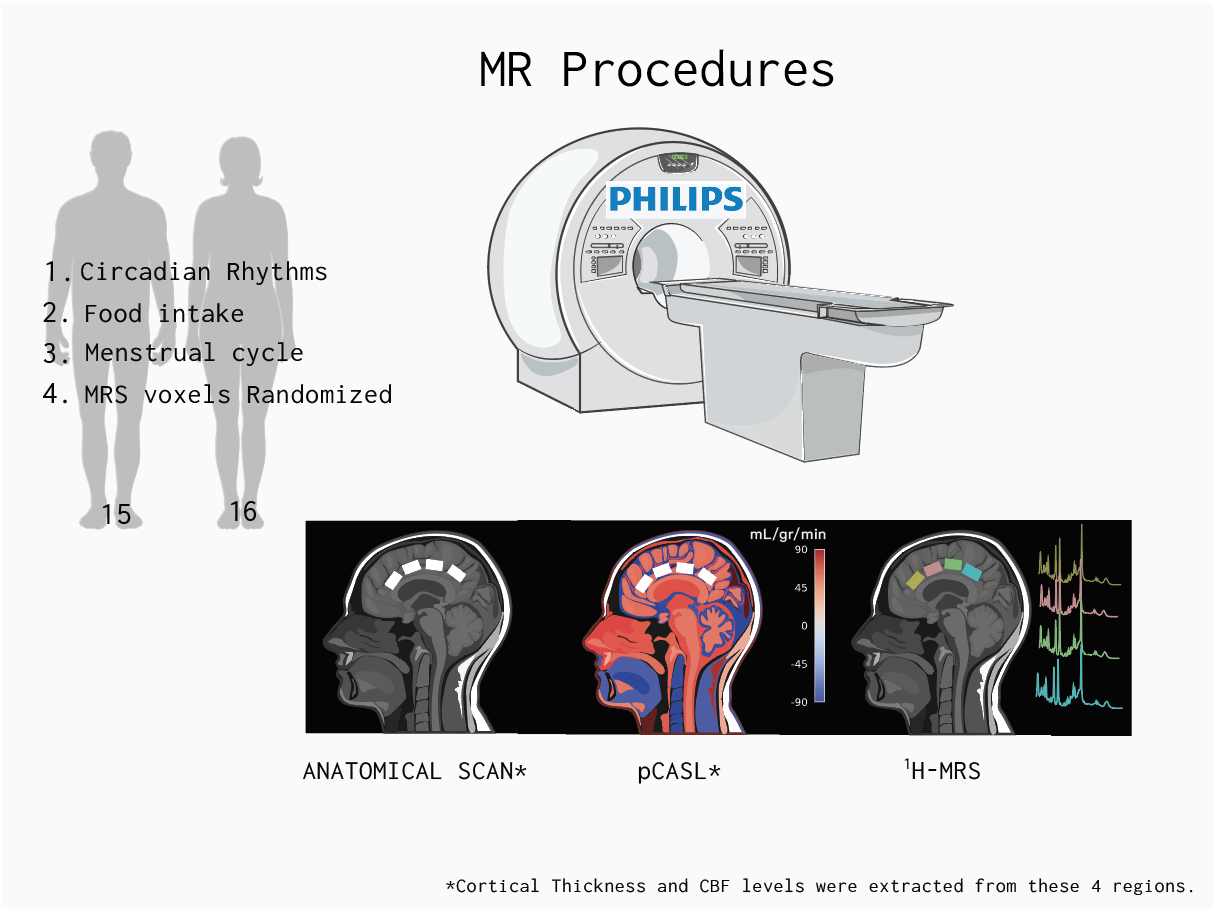
ParticipantsThirty healthy participants were recruited for this experiment (14M/16F, mean age= 26.1 SD= 4.5 range=19-35). Participants were asked to come to the laboratory in a fasting state. The timing of the scan was kept consistent (11:30 am-12:30 pm) across participants to account for circadian rhythm effects. Women were tested approximately during the follicular phase of their cycle Figure 1.
MR Procedures
3T data were collected on a 3T Philips Ingenia Elition X, with a 32-channel SENSE head coil, and the sequences included:
1) MPRAGE 3D T1 (TE/TR/TI=4.3/9.3/950ms, shot interval=2400ms, +0.8mm³ isotropic resolution, FOV (ap/rl/fh) =256/256/180mm³, scan time=5:49).
2) A pseudo-continuous arterial spin labeling (pCASL) sequence was used to assess CBF 10. The sequence consisted of 4 pairs of perfusion-weighted and control scans (TE/TR=12/4174ms, post labeling duration= 2000ms, labeling duration= 1800, total scan duration =5.59 min).
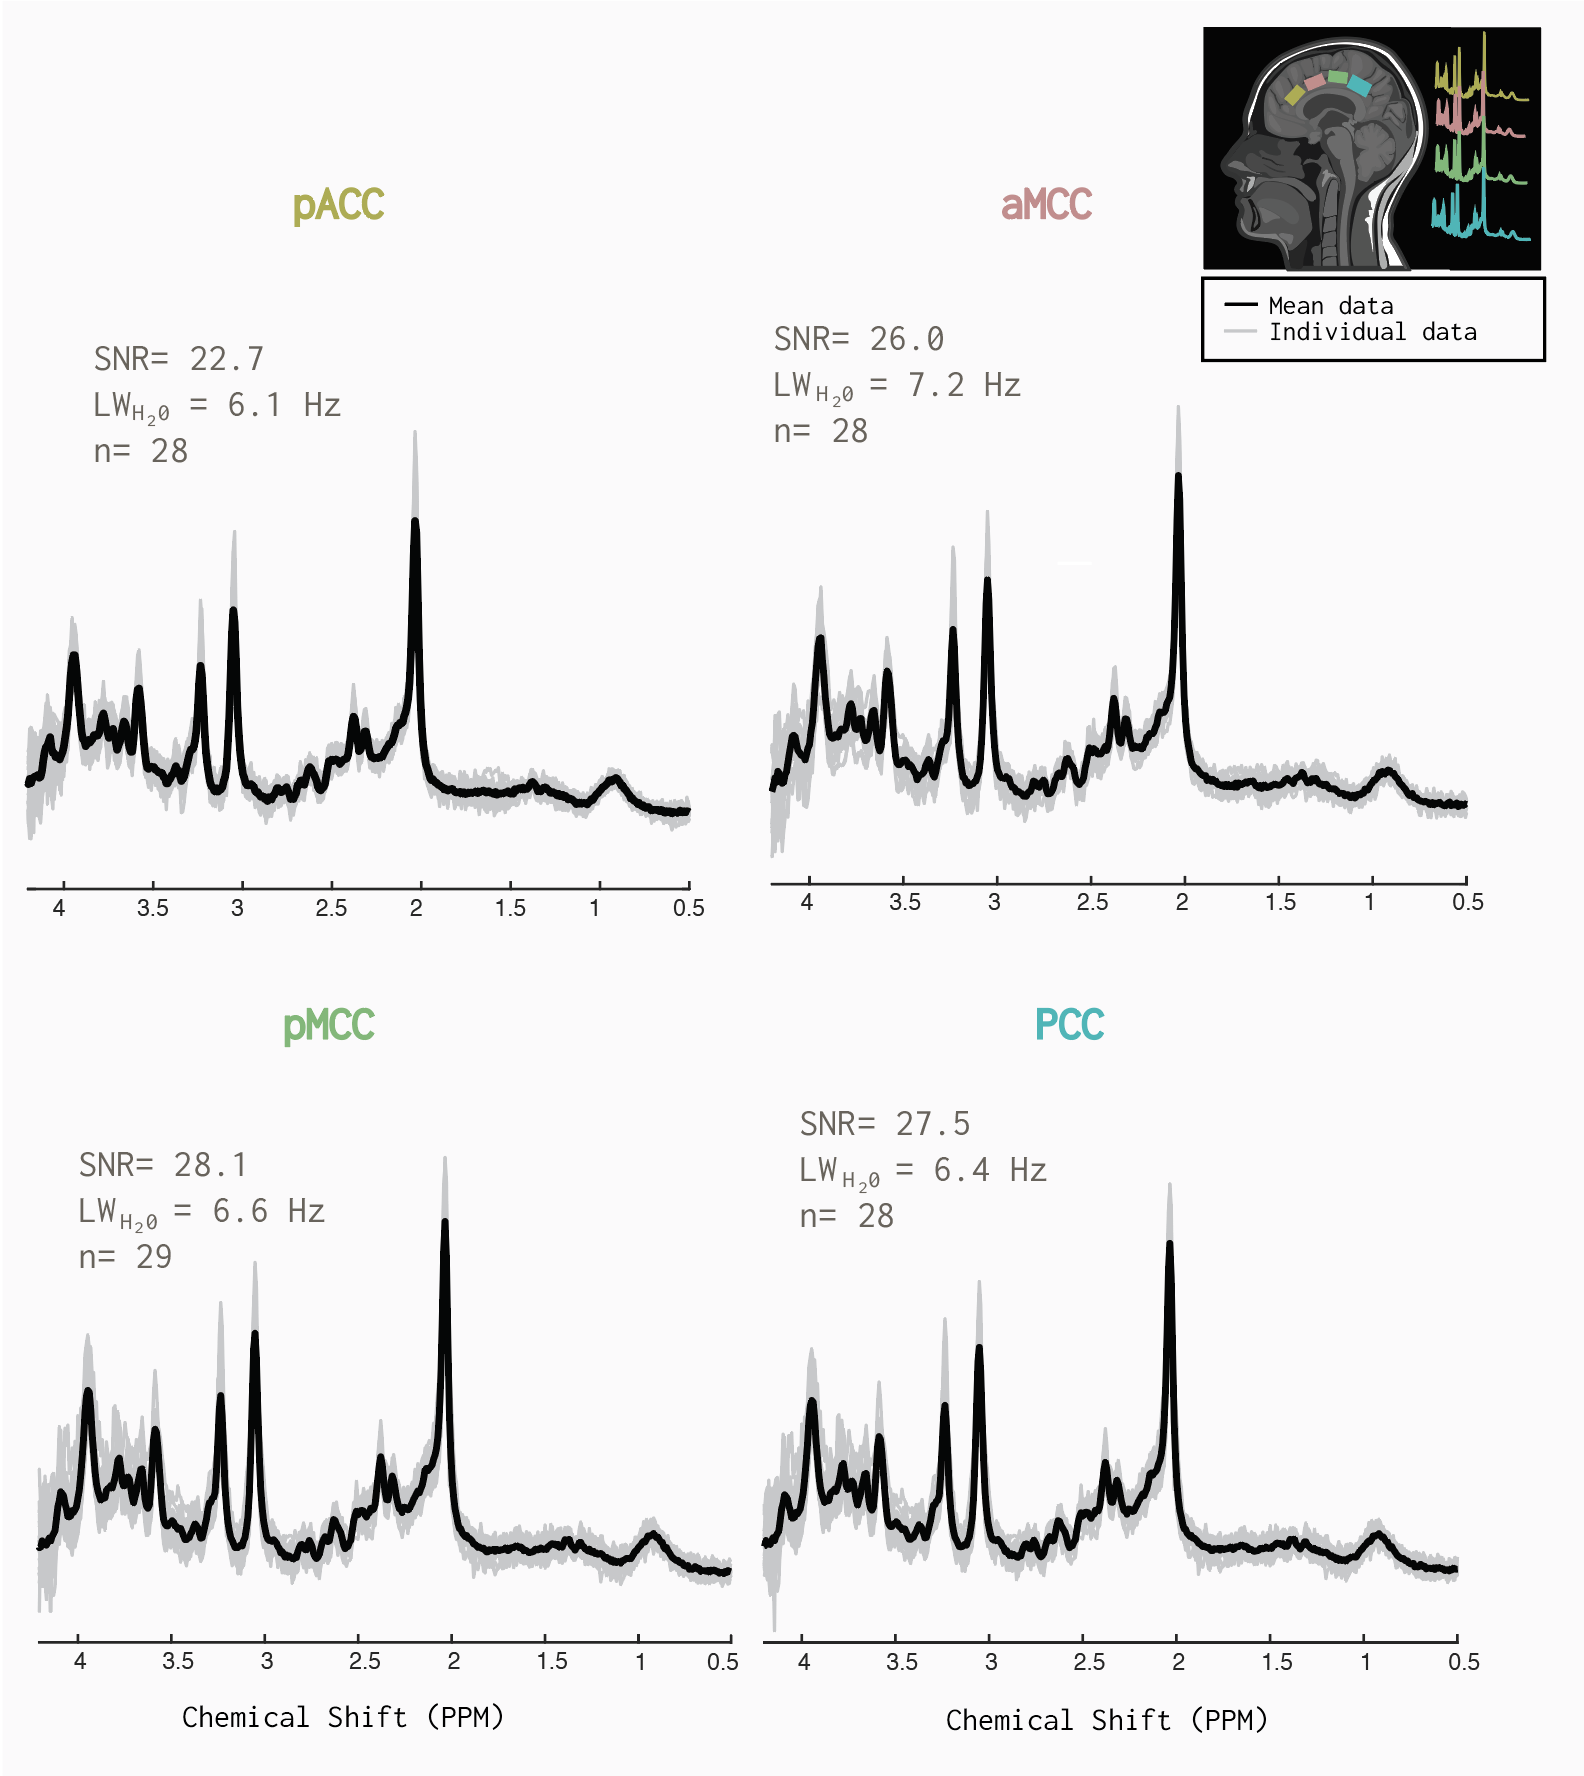
3) Single voxel 1H-MRS (sLASER, TE/TR=32/5000ms, NSA=64, voxel size=24/22/15mm³ =7.9mL, automated 2nd order shimming, 32-step phase cycle, water suppression using the frequency selective Excitation option). Four voxels (i.e., pACC, aMCC, pMCC, and PCC) were prescribed along the AP direction in the cingulate cortex (Figure 1), and the order of MRS acquisition in the voxels was randomized for each participant.
Data Analysis
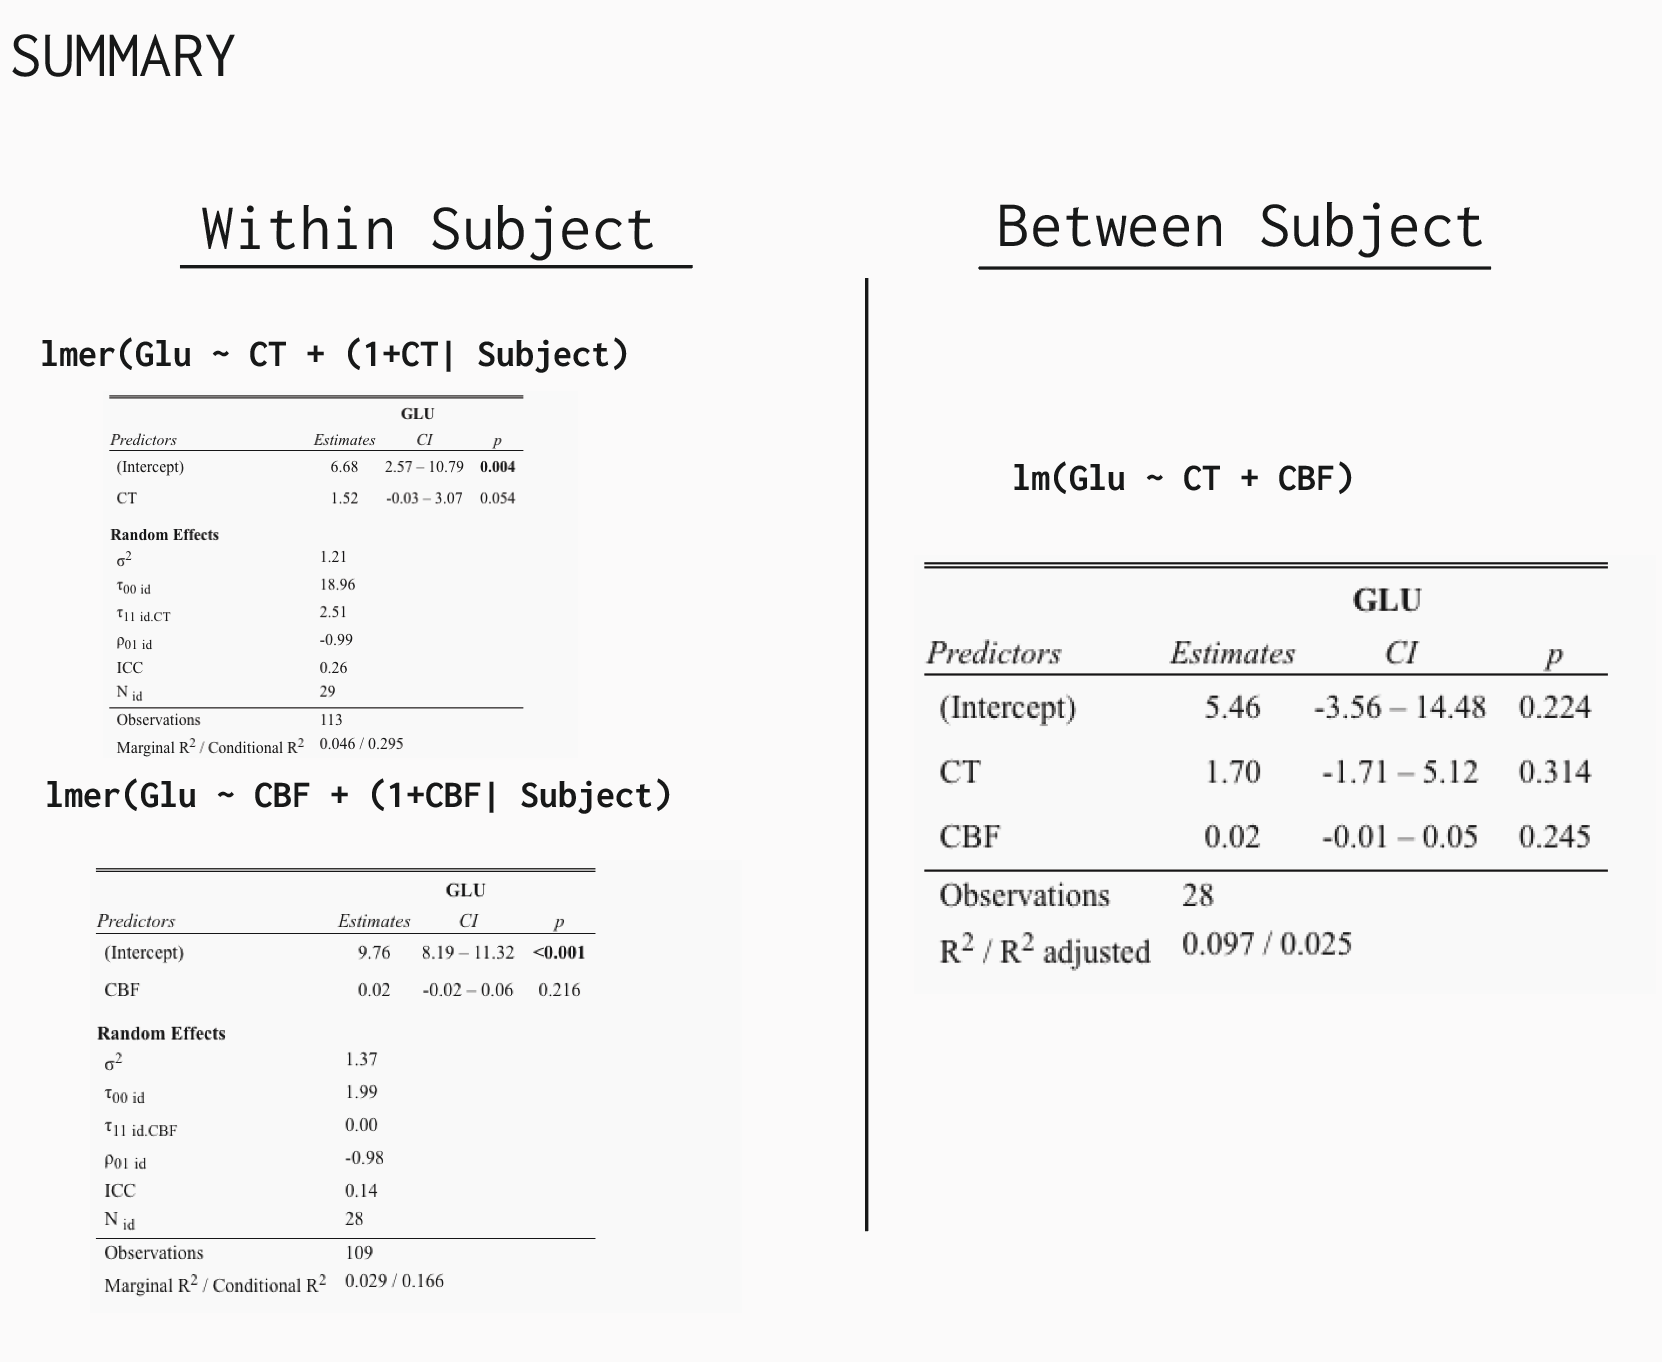
FreeSurfer Version 7.2 was used with standard defaults in native space to calculate cortical thickness at the four sub-divisions of the cingulate cortex. ASLPrep was used to calculate regional CBF in mL/gr/min, at each of the sub-divisions of the cingulate cortex in native space11. MRS data were pre-processed (e.g., frequency alignment, and eddy-current correction) and quantified using in-house MATLAB scripts. Spectral fitting was performed in LCModel version 6.312 and tissue segmentation was performed in FSL (V6.0). This information was then compiled to quantify metabolite levels in milli-molars (mM).To determine the relationship between glutamate and CT across the cingulate cortex sub-divisions, a liner-mixed model was performed in R Studio (V1.1.442- lme4 Bates Maechler & Bolker, 2012). $$Model = lmer (glutamate ~ CT + (1+CT| Subject))$$. To determine the relationship between glutamate and CBF the following model was used:$$ Model= lmer (glutamate ~ CBF + CBF+1|Subject))$$. Along with examining within-subject effects, a general linear model was performed using the average values across the cingulate cortex to examine between-subject effects. All statistical tests were performed in R Studio Version 2022.07.2.
Results
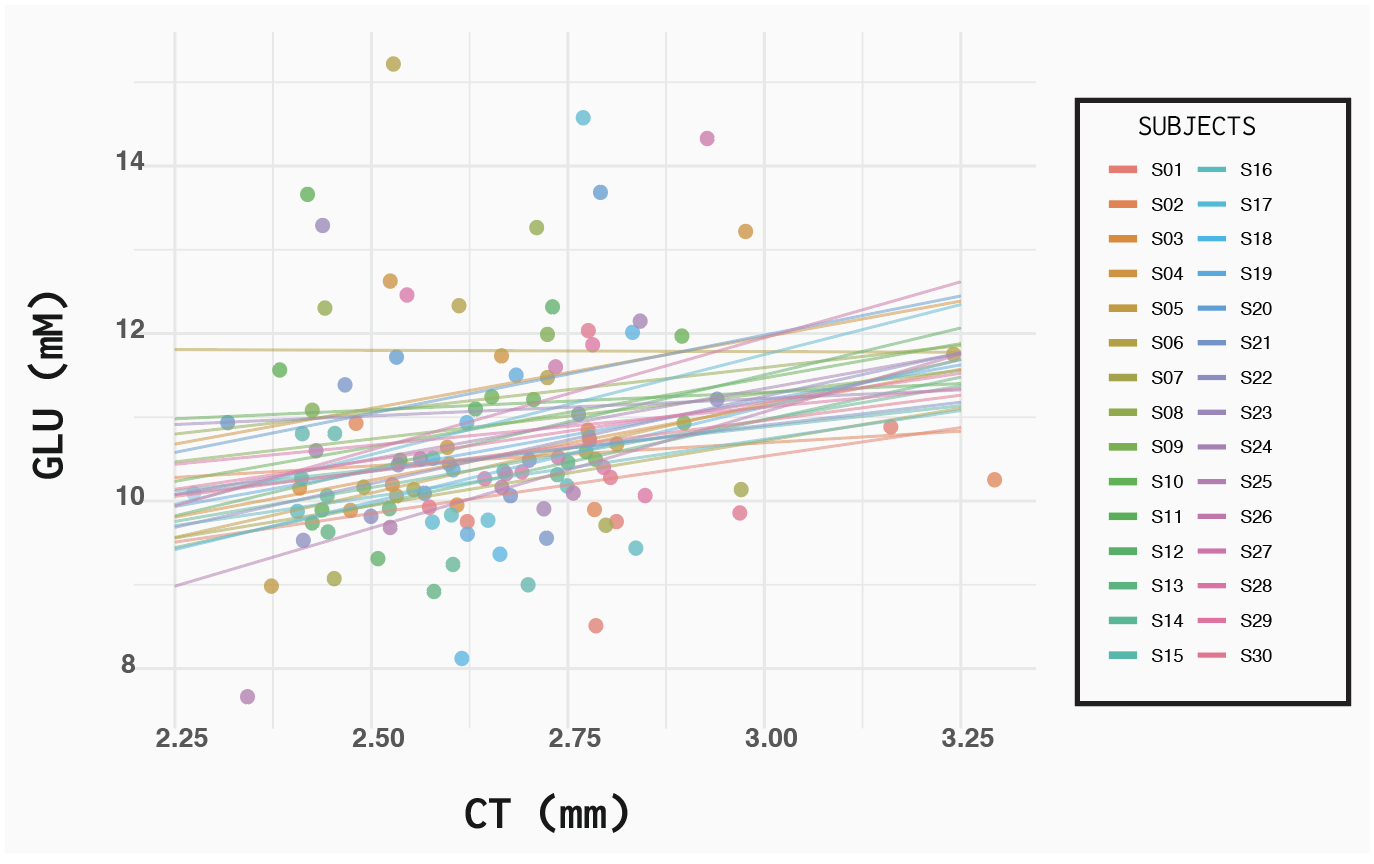
One participant’s ASL data (m) was not analyzed due to a collection error. Similarly, another’s MRS data (m) was unable to be included since the individual transients were not correctly saved. Additionally, for 3 participants we excluded metabolites from one location, due to the linewidth of the water being >10Hz. The MRS quality from the remaining 28 participants is illustrated in Figure 2. The linear mixed effects model results indicated, that for every one mm increase in CT, glutamate increased 1.5 mM (β=1.52 CI -0.03-3.07, p=0.05) Figure 3. The conditional R2 was greater (0.30 compared to the marginal R2= 0.04). No relationship was seen when evaluating the correlation between glutamate and CBF (β=0.02 CI -0.21-0.06, p=0.21). The general linear model revealed that there was no relationship between subjects. Figure 4 illustrates the summary of all the models.Discussion
In this study, we examined if morphometry, function, and metabolism are correlated in the resting healthy adult brain. We observed a within-subject relationship between glutamate and CT, but not with CBF. Blood flow is tightly coupled with metabolism and neural activity (i.e., neurovascular coupling), where increased CBF occurs in regions with active neurons13. However, this data suggests measured glutamate at rest is not coupled to blood flow in both gray and white matter. Rather, glutamate is better represented by CT than CBF. As MRS is sensitive to metabolites in all compartments and cell types, examining the relationship with functional and morphometry outcomes provides an integrative approach to studying the brain. These results can allow for comparative data when interpreting these associations in pathology as well as the examination of therapeutic interventions.Acknowledgements
We would like to thank the University of British Columbia MRI Research Centre, the International Collaboration for Repair Discoveries (ICORD) as well as volunteers who participated in the study. J. Archibald is supported by a research scholarship from the National Council of Science and Technology (CONACYT) and GSM-NSERC. E.L MacMillan receives salary support from Philips Canada.
This work is supported by NSERC Program Discovery grant held by JLKK.
References
1. Zhao, Y. et al. Cortical Thickness Abnormalities at Different Stages of the Illness Course in Schizophrenia: A Systematic Review and Meta-analysis. JAMA Psychiatry 79, 560–570 (2022).
2. Czarnecka, A., Zimny, A. & Sasiadek, M. Correlation of CT perfusion and CT volumetry in patients with Alzheimer’s disease. Polish J. Radiol. 75, 15–21 (2010).
3. Paul W. Jones, Michael R. Borich, Irene Vavsour, Alex Mackay, and L. A. B. Cortical thickness and metabolite concentration in chronic stroke and the relationship with motor function. Restor Neurol Neurosci. 21, 733–746 (2016).
4. Järnum, H. et al. Longitudinal MRI study of cortical thickness, perfusion, and metabolite levels in major depressive disorder. Acta Psychiatr. Scand. 124, 435–446 (2011).
5. Vamvakas, A. et al. Neurotransmitter receptor densities are associated with changes in regional Cerebral blood flow during clinical ongoing pain. Hum. Brain Mapp. 1–15 (2022) doi:10.1002/hbm.25999.
6. Erpelding, N., Moayedi, M. & Davis, K. D. Cortical thickness correlates of pain and temperature sensitivity. Pain 153, 1602–1609 (2012).
7. Mullins, P. G., Rowland, L. M., Jung, R. E. & Sibbitt, W. L. A novel technique to study the brain’s response to pain: Proton magnetic resonance spectroscopy. Neuroimage 26, 642–646 (2005).
8. Wijtenburg, S. A. et al. Altered Glutamate and Regional Cerebral Blood Flow Levels in Schizophrenia: A 1 H-MRS and pCASL study. Neuropsychopharmacology 42, 562–571 (2017).
9. Bojesen, K. B. et al. Glutamate levels and resting cerebral blood flow in anterior cingulate cortex are associated at rest and immediately following infusion of S-ketamine in healthy volunteers. Front. Psychiatry 9, 1–10 (2018).
10. Dai, W., Garcia, D., De Bazelaire, C. & Alsop, D. C. Continuous flow-driven inversion for arterial spin labeling using pulsed radio frequency and gradient fields. Magn. Reson. Med. 60, 1488–1497 (2008).
11. Adebimpe, A. et al. ASLPrep : a platform for processing of arterial spin-labeled MRI and quantification of regional brain perfusion. 19, (2022).
12. Provencher, S. Estimation of metabolite concentrations from localized in vivo proton NMR spectra. Magn Reson Med 30, (1993).
13. Attwell, D. et al. Glial and neuronal control of brain blood flow. Nature 468, 232–243 (2010).
Figures