0501
Differential MRS results in a clinical multisite study depending on site harmonization and analysis approach1Radiology, University of Calgary, Calgary, AB, Canada, 2University of Alberta and Stollery Children's Hospital, Edmonton, AB, Canada, 3University of British Columbia, Vancouver, BC, Canada, 4University of Montreal and St Justine Hospital, Montreal, QC, Canada, 5University of Ottawa and Children's Hospital of Eastern Ontario, Ottawa, ON, Canada, 6Psychology, University of Calgary, Calgary, AB, Canada
Synopsis
Keywords: Spectroscopy, Brain, Traumatic Brain Injury
The use of multiple sites and scanners is commonly used to increase sample size; however, this introduces unwanted variance into spectroscopy data. In this work we compare statistical co-variate techniques in combination with ComBat harmonization using data from a concussion study. We show traditional statistical methods of accounting for multi-site variance (using covariates to control for site and vendor) could result in erroneous interpretation of clinical data. Our data supports the use of ComBat harmonization and suggests how to best control for multisite data statistically.Introduction
As with many imaging modalities, the use of multiple sites and scanners is used to increase sample sizes for magnetic resonance spectroscopy (MRS) studies. However, scanner effects are substantial, both between and within vendor, and can affect MRS data. These effects can ultimately affect data interpretation. Given the increasing use of multi-site studies, a better understanding of how to account for different scanners is badly needed. Bell et al. (2022) (1) recently validated ComBat harmonization (2) for MRS data from 20 different sites in a healthy population. To our knowledge, no previous research has examined MRS data harmonization in a clinical population.Using data from a concussion population, we compare ComBat harmonization with controlling for scanner, site, and vendor as covariates to determine how to best control for multi-site/scanner data. For clarity, here, site refers to research centre, vendor is the scanner manufacturer, and scanner is an individual MRI machine (a single site may have multiple scanners).
Methods
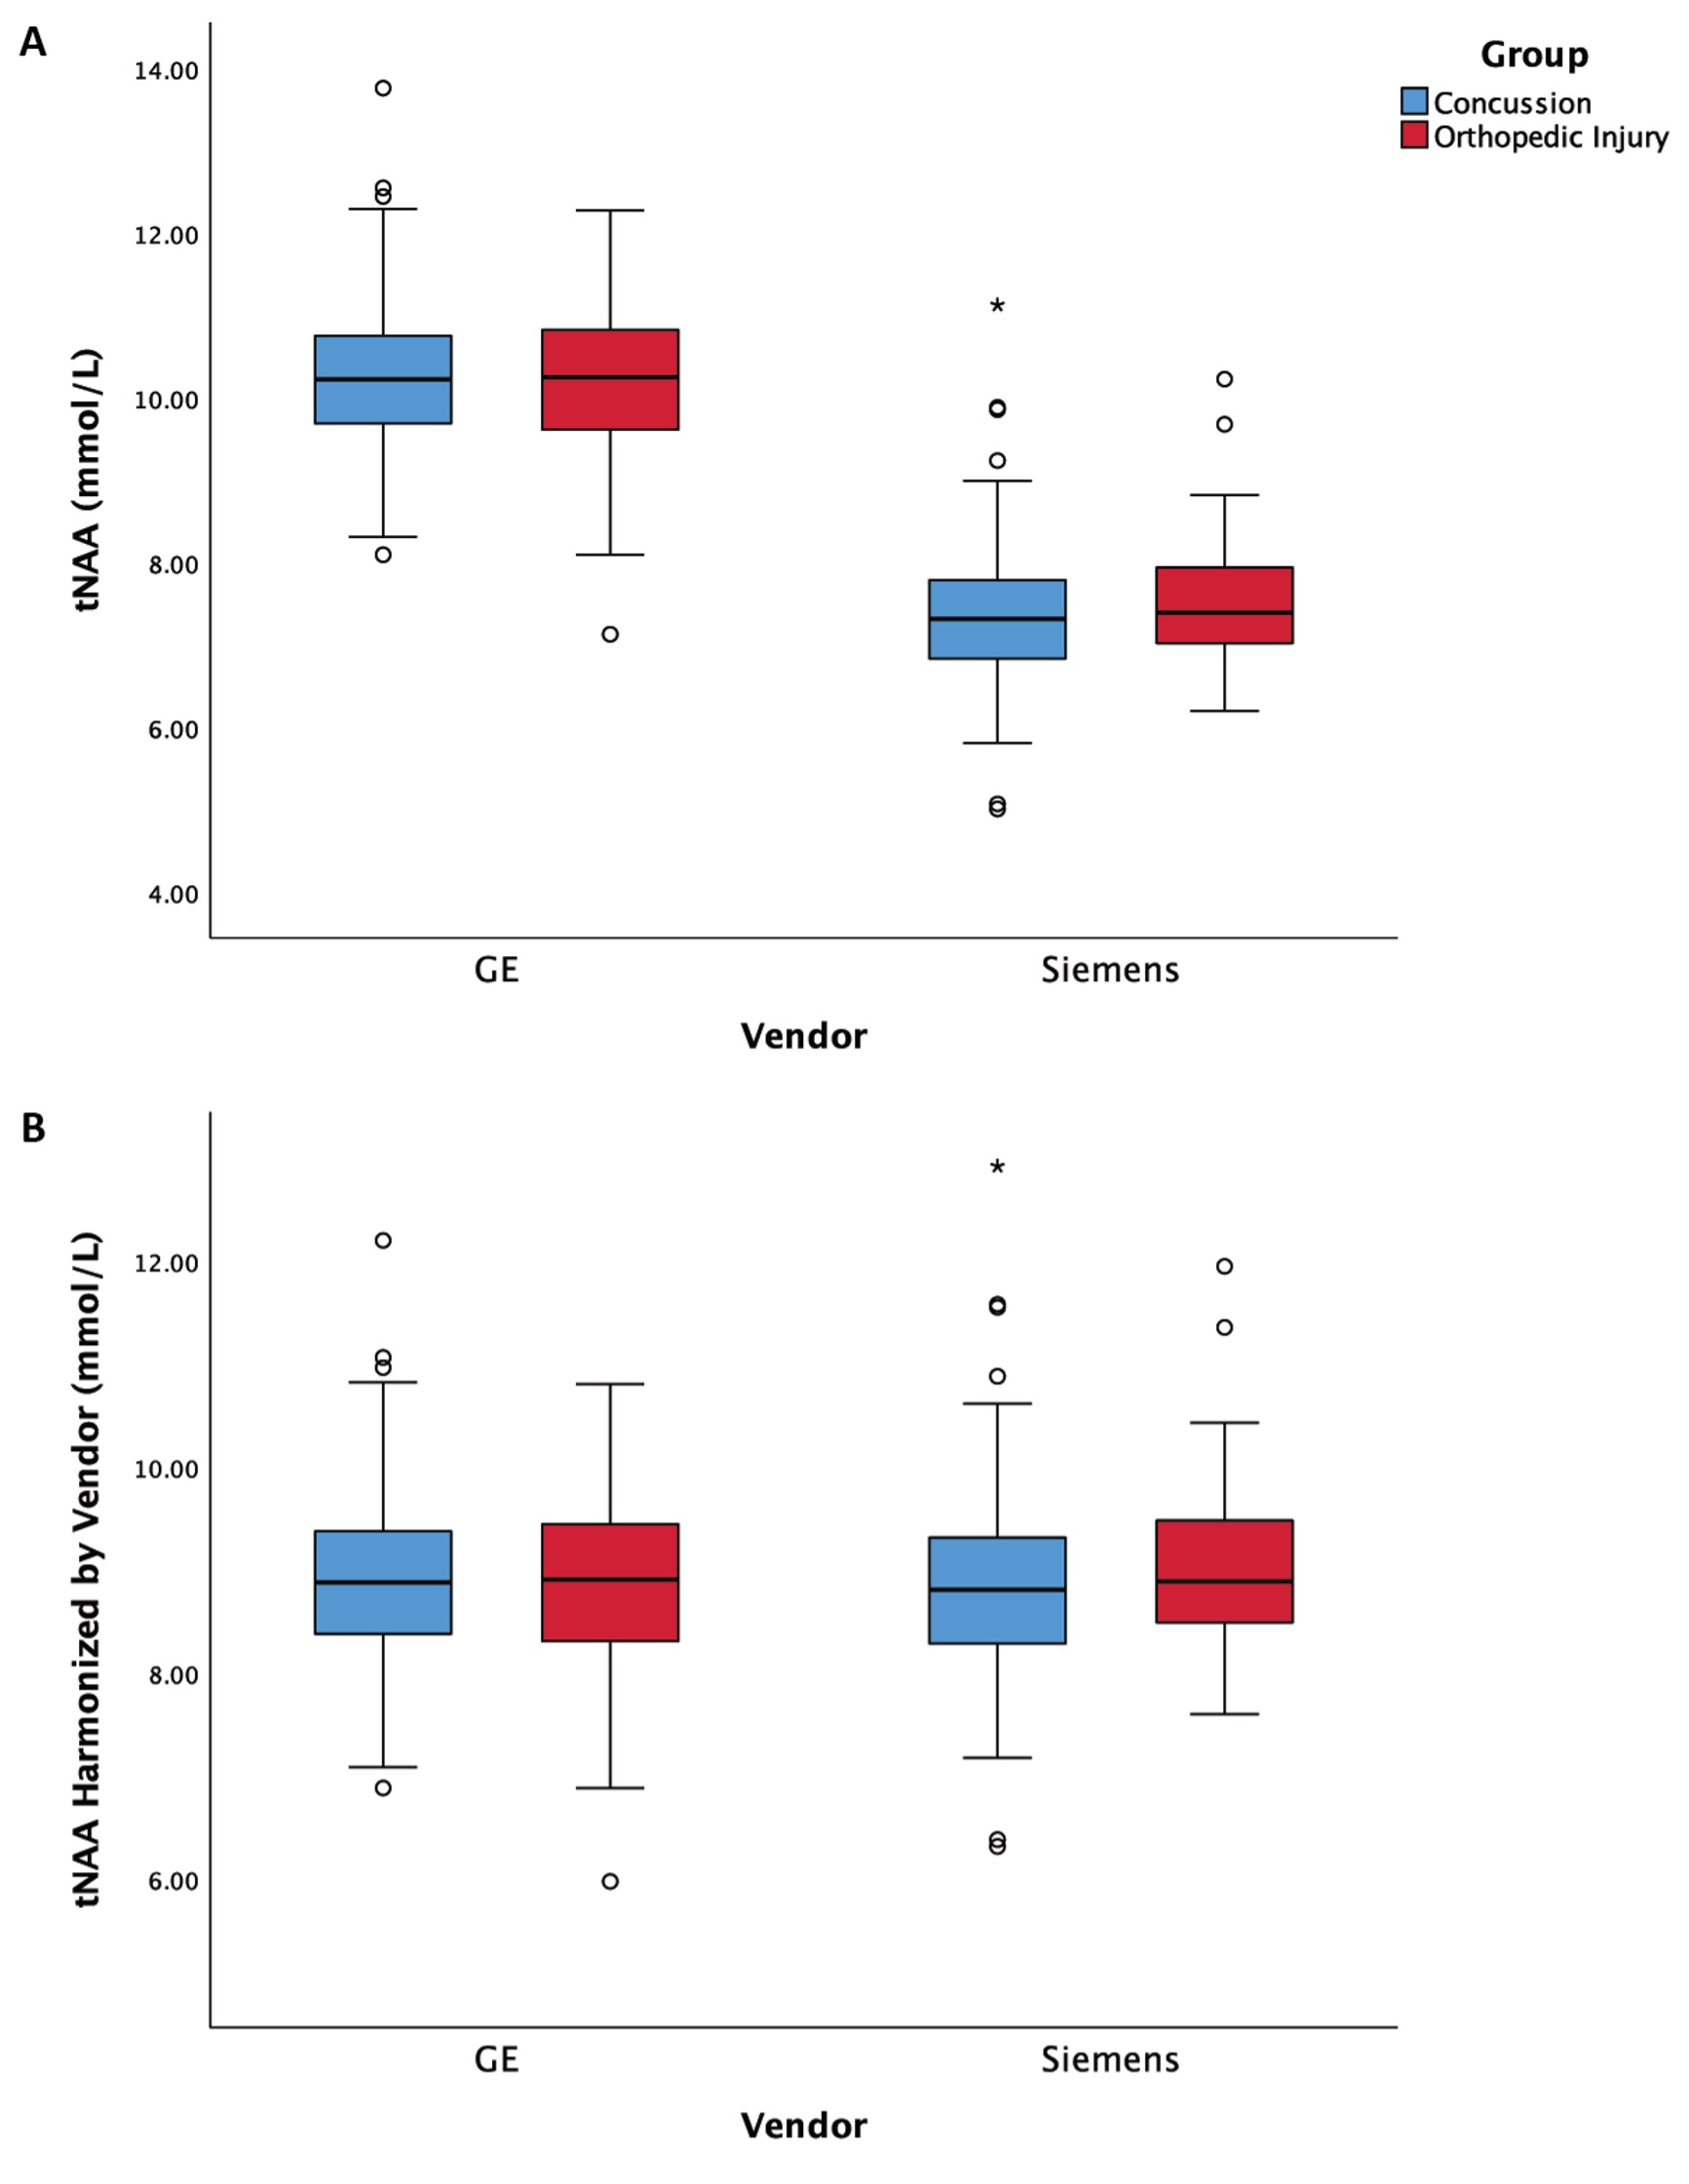
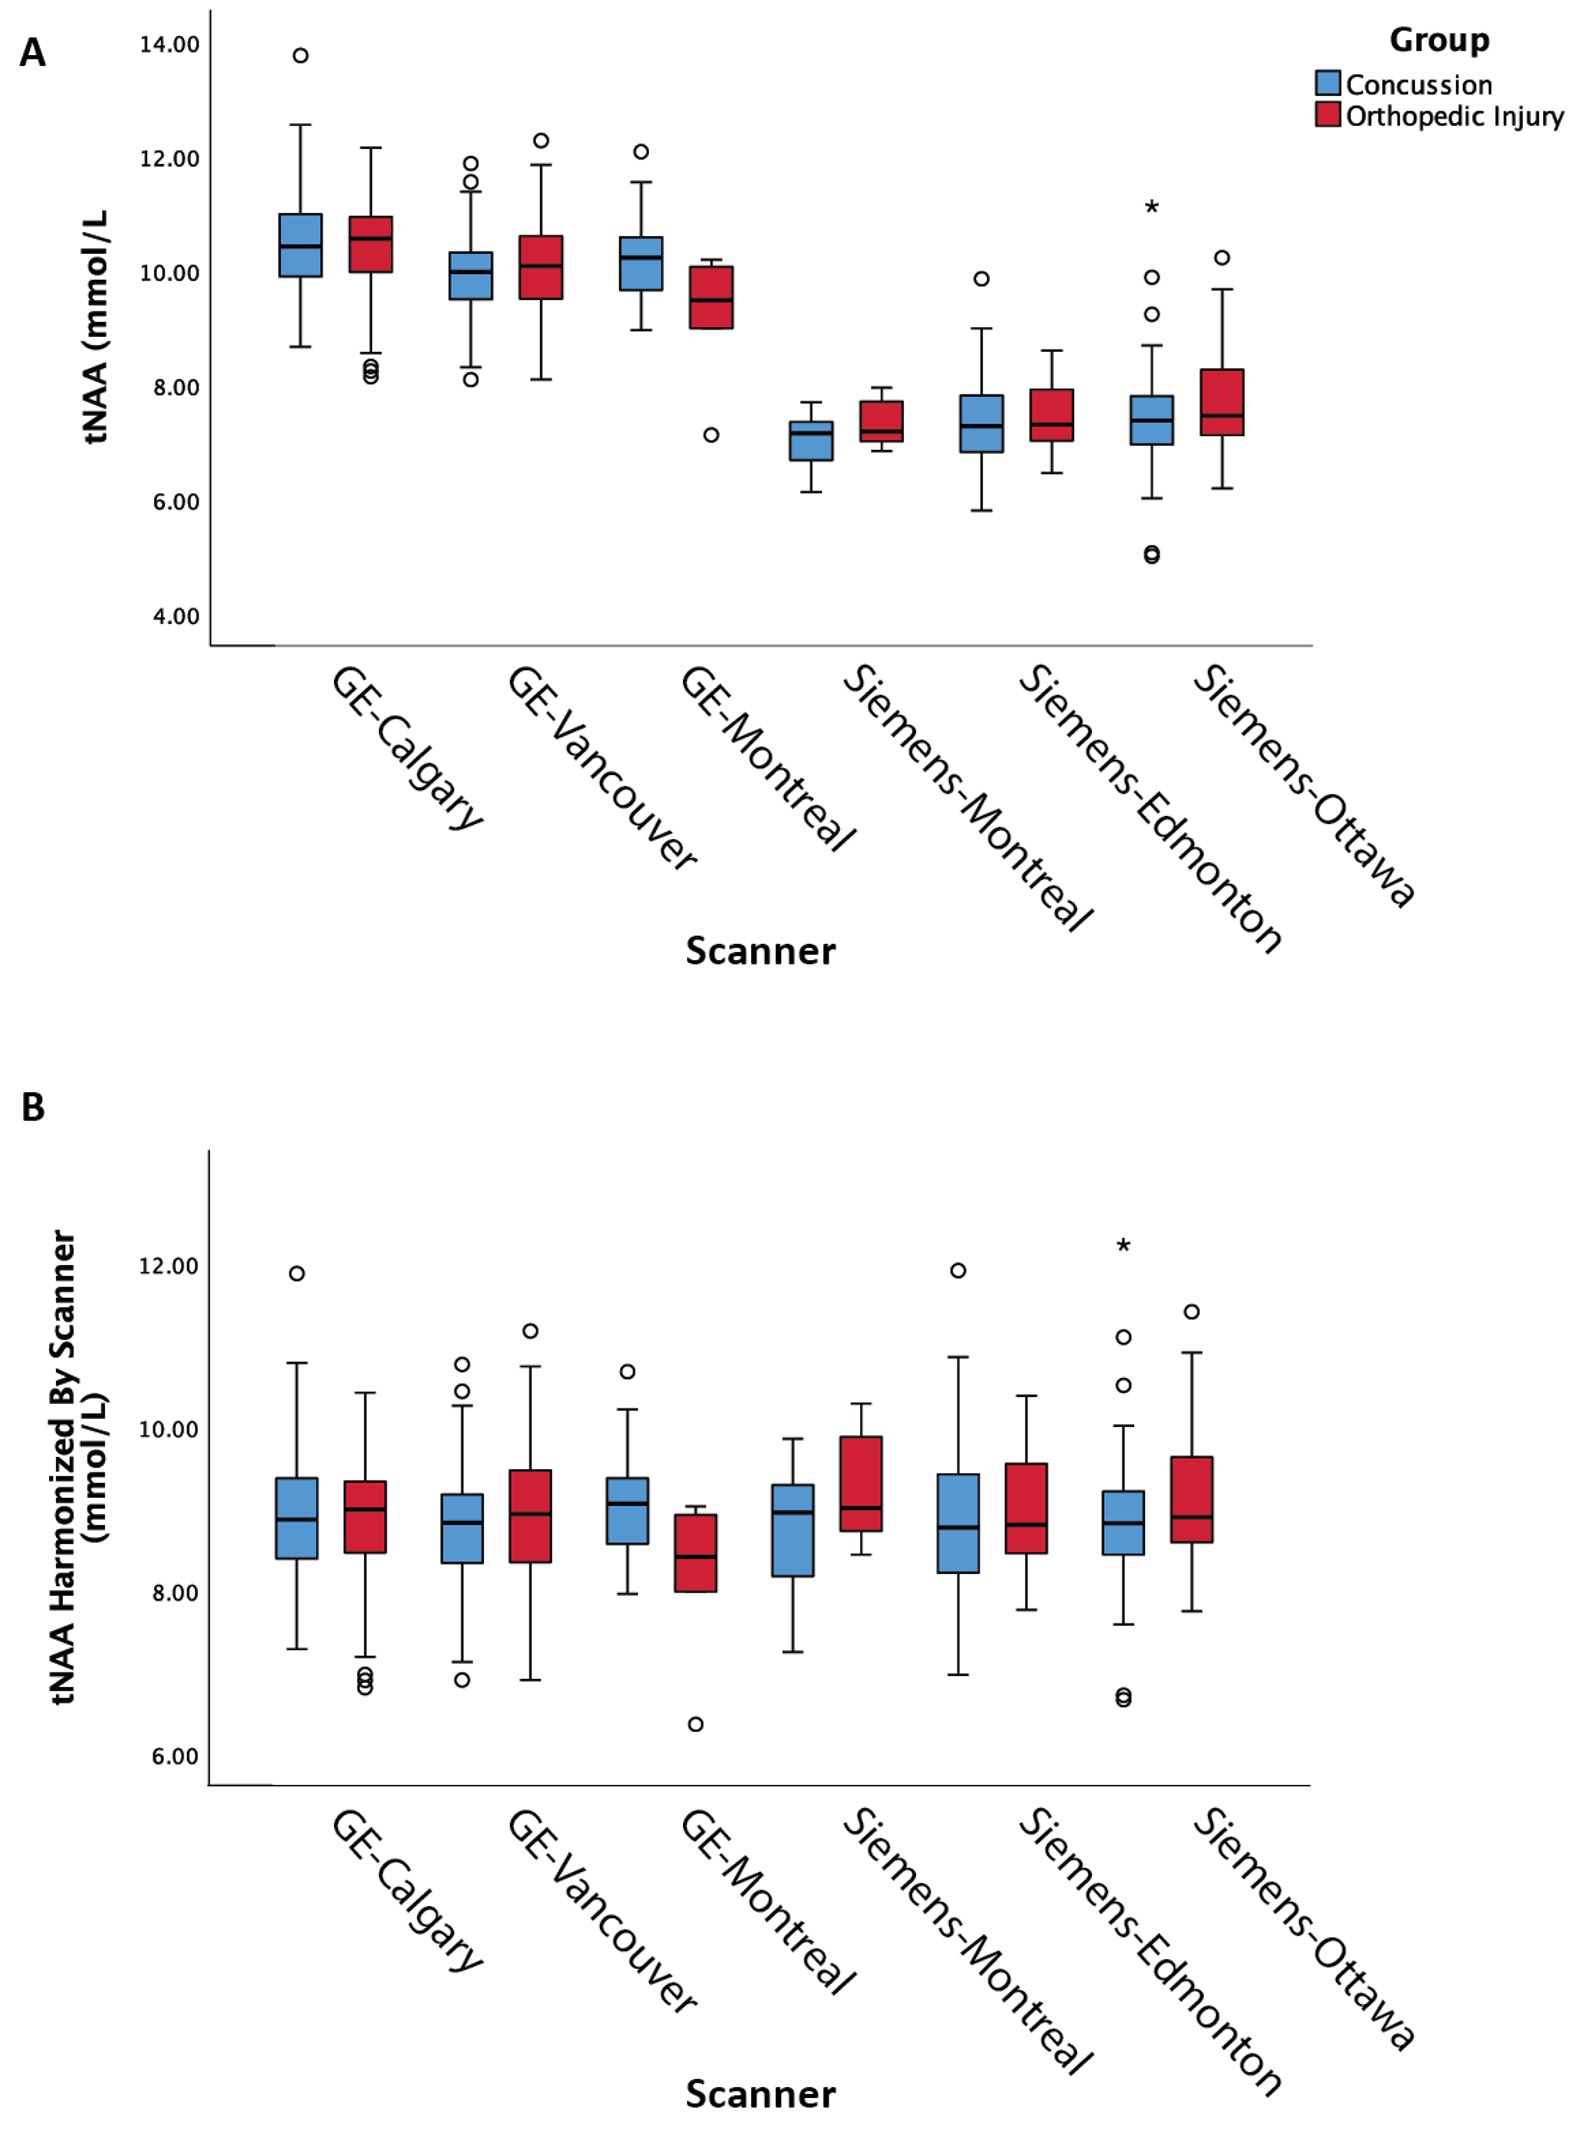
Data was acquired as part of the Advancing Concussion Assessment in Pediatrics (A-CAP) study (3). Children aged 8.00-16.99 years with either a concussion or orthopedic injury (OI) were recruited in 5 emergency departments (site). Each participant received a MRS scan at a mean of 12 days following injury. Four sites had a single 3T scanner (two were GE, two were Siemens), and one site had two scanners (one GE, one Siemens); thus, the study had data from six individual scanners. The MRS sequence used was a single voxel short-echo PRESS sequence with TE/TR: 30/2000 ms, 8 mL, 96 averages, placed in the left-dorsal lateral prefrontal cortex. Data was pre-processed with FID-A (4) and quantified with LCModel (5). While all metabolites can be harmonized, tNAA (total N-acetyl Aspartate) will be the focus here.Four approaches to account for site and vendor differences were implemented to test for differences in tNAA between concussion and OI:
1. ANCOVA model including covariates for vendor (GE or Siemens) and site (five sites)
2. ANCOVA model including a covariate for scanner (six in total)
3. ANCOVA model including a covariate for site applied to data harmonized by vendor using ComBat harmonization
4. ANCOVA model applied to data harmonized by scanner using ComBat harmonization
Each model controlled for age and sex as covariates. A follow-up analysis to test the effect of ComBat harmonization of vendor was completed where vendor was included as a covariate in the ANCOVA testing for group differences.
Results
This study had a total of 545 MRS datasets (361 concussion and 184 OI). A total of 287 participants were scanned with GE scanners and 258 participants scanned with Siemens scanners. When examining individual sites, no significant group differences were found. Given that the group comparison (concussion vs OI) was not significant at the 2 largest sites (with N = 138 and N = 125) and these group comparisons had partial eta squared effect sizes of 0.001 and 0.003, respectively, we assume there are no significant group differences in tNAA.The univariate ANCOVA including covariates for site and vendor (model 1 above) showed no significant effect of group in tNAA, but site and vendor were both significant (p<0.05, figure 1A). The univariate ANCOVA including scanner as a covariate (Model 2 above) showed a significant effect of group (p<0.05) for tNAA, where scanner was significant (p<0.05, Figure 2A).With harmonization based on vendor (Model 3 above), the univariate ANCOVA shows no significant group effect in tNAA, while site is a significant covariate (p<0.05, Figure 1B). Lastly, with harmonization based on scanner (Model 4 above), the univariate ANCOVA shows no significant group effect in tNAA (p>0.05, figure 2B). Additionally, in a follow-up analysis, harmonized data was confirmed to have corrected for the effect of vendor by also including the vendor factor in the ANCOVA model, in which there was no significant effect of vendor. As expected, the effect of age as a covariate was significant in all models.
Discussion
These results demonstrate that different approaches to accounting for sites or scanners can have a profound effect on MRS data; specifically, in the ANCOVA model that included scanner alone, a significant effect of group was shown. In all other analyses the effect of group was not significant. Given the absence of a group effect, we conclude group does not have a significant effect in this dataset and that the significant group effect in the analysis of scanner alone was erroneous.ComBat harmonization has several advantages over other harmonization techniques, including maintaining measures with meaningful values. Consistent with previous work (1), the results here support its use for MRS data while retaining meaningful biological variance.
These results are important as they indicate caution is needed when covarying for scanner/site/vendor. Future studies should take these results into consideration when interpreting previous research and implementing appropriate study design to enable correct interpretation of results.
Significance
In a large clinical population, we found that the use of different analysis techniques for the control of site and scanner in MRS data could yield varying results. The findings support the use of ComBat harmonization rather than covarying for site, vendor, or scanner effects in clinical data.Acknowledgements
This study was funded by CIHR, ADH holds a Canada Research Chair in Magnetic Resonance Spectroscopy in Brain Injury, PLL received funding from University of Calgary and Alberta Children’s Hopsital Research Institute, and additional support was provided by Alberta Children’s Hopsital Research Institute, Hotchkiss Brain Institute, and NSERC.References
1. Bell TK, Godfrey KJ, Ware AL, Yeates KO, Harris AD. Harmonization of multi-site MRS data with ComBat. Neuroimage. Elsevier Inc.; 2022;257(May).
2. Fortin JP, Parker D, Tunç B, et al. Harmonization of multi-site diffusion tensor imaging data. Neuroimage. Elsevier Ltd; 2017;161(March):149–170https://doi.org/10.1016/j.neuroimage.2017.08.047.
3. Yeates KO, Beauchamp M, Craig W, et al. Advancing Concussion Assessment in Pediatrics (A-CAP): A prospective, concurrent cohort, longitudinal study of mild traumatic brain injury in children: Protocol study. BMJ Open. 2017;7(7):1–14.
4. Simpson R, Devenyi GA, Jezzard P, Hennessy TJ, Near J. Advanced processing and simulation of MRS data using the FID appliance (FID-A)—An open source, MATLAB-based toolkit. Magn Reson Med. 2017;77(1):23–33.
5. Provencher SW. Estimation of metabolite concentrations from localized in vivo proton NMR spectra. Magn Reson Med. 1993;30(6):672–679.
Figures