0499
Intra-Subject Stability and Reproducibility of 7 T FID-CRT-MRSI
Philipp Lazen1, Benjamin Spurny-Dworak2, Wolfgang Bogner3,4, Lukas Hingerl3, Bernhard Strasser3, Rupert Lanzenberger2, Karl Rössler1, Siegfried Trattnig3,4,5, and Gilbert Hangel1,3
1Department of Neurosurgery, Medical University of Vienna, Vienna, Austria, 2Division of General Psychiatry, Department of Psychiatry and Psychotherapy, Medical University of Vienna, Vienna, Austria, 3High-field MR Center, Department of Biomedical Imaging and Image-guided Therapy, Medical University of Vienna, Vienna, Austria, 4Christian Doppler Laboratory for MR Imaging Biomarkers, Vienna, Austria, 5Institute for Clinical Molecular MRI, Karl Landsteiner Society, St. Pölten, Austria
1Department of Neurosurgery, Medical University of Vienna, Vienna, Austria, 2Division of General Psychiatry, Department of Psychiatry and Psychotherapy, Medical University of Vienna, Vienna, Austria, 3High-field MR Center, Department of Biomedical Imaging and Image-guided Therapy, Medical University of Vienna, Vienna, Austria, 4Christian Doppler Laboratory for MR Imaging Biomarkers, Vienna, Austria, 5Institute for Clinical Molecular MRI, Karl Landsteiner Society, St. Pölten, Austria
Synopsis
Keywords: Spectroscopy, Brain
We evaluated the intra-subject stability of CRT-FID-MRSI at 7 T in a cohort of 15 volunteers. Two magnetic resonance spectroscopic imaging acquisitions were performed consecutively and metabolite concentration estimates (CEs) were calculated using internal water referencing. The resulting metabolic maps were segmented in 55 brain regions. For analysis, the CEs of both acquisitions were compared and coefficients of variations (CVs) were calculated. We saw high stability in almost all volunteers, with CVs being well below 5% in the brain regions generally associated with good data quality.Introduction
Free induction decay-based magnetic resonance spectroscopic imaging using concentric ring trajectories (FID-CRT-MRSI) is a way to create high resolution metabolic maps over the whole brain in clinically relevant acquisition times1, but so far, there have been few studies regarding the robustness of this approach. In 2021, we evaluated the stability of metabolic concentration estimates between subjects in a cohort of 24 volunteers, and calculated coefficients of variation, which, averaged over 44 brain regions, were 9% for total choline, 10% for total creatine, 11% for glutamate, 10% for myo-inositol, and 9% for N-acetylaspartate.2 In addition to inter-subject stability, it is vital to analyze the stability within subjects, as it is a prerequisite for the interpretation of subject data over time and the determination of reliably distinguishable effect sizes. The purpose of this work was the evaluation of the same-session intra-subject stability of 7 T FID-CRT-MRSI.Methods
We acquired a protocol containing two MRSI acquisitions (Acq1 and Acq2, both covering the brain with a field of view of 220x220x130 mm3 using a matrix size of 64x64x39 voxels, 3.4 mm isotropic resolution, a TR of 450 ms, an acquisition delay of 1.3 ms, and a total measurement duration of 15 min), a water reference MRSI with identical geometric properties (TR = 200 ms, acquisition delay = 1.3 ms, measurement duration 3:18 min), B0 and B1 field maps, and a T1w MP2RAGE, in 15 consenting volunteers after obtaining approval from the institutional review board. Segmentation in gray and white matter (GM, WM) was performed based on the T1-weighted image.After post-processing3, spectroscopic quantification was done in LCModel4 using a basis set consisting of 15 metabolites. For all metabolites, concentration estimates (CEs) were calculated for Acq1 and Acq2.5 A B1 inhomogeneity correction was performed for each CE map6. The maps were then segmented in 55 different brain regions based on brain atlases using FreeSurfer. For each of the segmented regions, mean concentration values were calculated (for both acquisitions).2
For this analysis, we focussed on metabolites with the highest reliability in our previous work, namely N-Acetylaspartate (NAA), creatine and phosphocreatine (tCr), phosphocholine and glycerophosphocholine (tCho), glutamate (Glu), and myo-inositol (mIns). For these five metabolites, we calculated coefficients of variation (CVs) between the first and second acquisition in each region and each volunteer, according to
$$ \text{CV} = \frac{\sigma}{\mu} $$
with the sample's standard deviation $$$\sigma$$$ and the mean $$$\mu$$$.
Results
Generally, the concentration estimate maps shows good correspondence, which can be seen in Figure 1. In Figure 2, we can see a plot of concentration estimates for different metabolites within volunteers. With the exception of one subject, the concentration estimates were very stable. Since tCho has lower concentrations in the brain than the other metabolites, we also looked at the relative deviations of the concentration estimates from the second acquisition, which can be seen in Figure 3. Here, the values between scans change by less than 10%, except for one outlier. Lastly, Figure 4 shows a box plot of CVs for all regions included in Figures 2 and 3. With the exception of a few outliers, CVs lie predominantly between 0 and 5%, indicating excellent reproducibility. More specifically, the median CV is below 2.5% for all five metabolites investigated in the parietal, frontal, motor and somatosensory cortex, and below 4% for the occipital, temporal and visual cortices (see Table 1).Discussion
The results of this study suggest a high intra-subject stability, with CVs being at or below 5% in the brain regions associated with good data quality, and, with the exception of outliers, below 10% - even in less than ideal brain regions. Some regions are generally more difficult to map due to B0 field inhomogeneities (e.g. the lower parts of the frontal lobe) and insufficient excitation (e.g. lower parts of the brain such as the cerebellum). These are known weaknesses of MRSI and there exist approaches that can improve these issues, like higher order B0 shim systems and parallel transmit coils.This is the first work to investigate the intra-subject stability of high-resolution 7 T CRT-FID-MRSI. In order to rely on the quantities delivered by spectroscopic imaging, it is vital to know the limits of its precision and accuracy, and this is another step towards finding these limits. Furthermore, our findings are potentially relevant for studies relying on short-term stability, as they suggest a maximum deviation in back to back-scans.
This preliminary analysis is limited by a moderate cohort size. Another limiting factor is the use of the same water reference scan for the concentration estimates of both acquisitions, resulting in some correlation, but we believe this to be a minor effect. Further opportunities for future research include the evaluation of MRSI’s reproducibility after a longer time interval (e.g. one week) as well as a study of the stability of metabolite concentrations throughout the day.
In conclusion, we successfully demonstrated the intra-subject stability of our method, and believe that the results of this study underline the power and potential of 7 T FID-CRT-MRSI.
Acknowledgements
This study was supported by the Austrian Science Fund (FWF) projects KLI-646 FW and KLI 1089-B, as well as the 2021 Comprehensive Cancer Center grant and the Neuroscience Cluster Seed Grants 2021 of the Medical University of Vienna.References
- Hingerl L, Strasser B, Moser P, et al. Clinical High-Resolution 3D-MR Spectroscopic Imaging of the Human Brain at 7 T. Investigative Radiology. April 2020 - Volume 55 - Issue 4 - p 239-248, doi: 10.1097/RLI.0000000000000626
- Hangel, G, Spurny-Dworak, B, Lazen, P, et al. Inter-subject stability and regional concentration estimates of 3D-FID-MRSI in the human brain at 7 T. NMR in Biomedicine. 2021; 34( 12):e4596. doi: 10.1002/nbm.4596
- Hingerl L, Bogner W, Moser P, et al. Density-weighted concentric circle trajectories for high resolution brain magnetic resonance spectroscopic imaging at 7T. Magn Reson Med. 2018 Jun;79(6):2874-2885. doi: 10.1002/mrm.26987.
- Provencher SW. Estimation of metabolite concentrations from localized in vivo proton NMR spectra. Magn Reson Med. 1993 Dec;30(6):672-9. doi: 10.1002/mrm.1910300604
- Gasparovic C., Song T., Devier D., et al. Use of tissue water as a concentration reference for proton spectroscopic imaging. May 2006. Magn. Reson. Med., 55: 1219-1226. doi: 10.1002/mrm.20901
- Lazen P et al. B1+ Correction for 7T FID-CRT-MRSI. Proceedings of the International Society for Magnetic Resonance in Medicine, 2022. Digital poster, program number 2534.
Figures
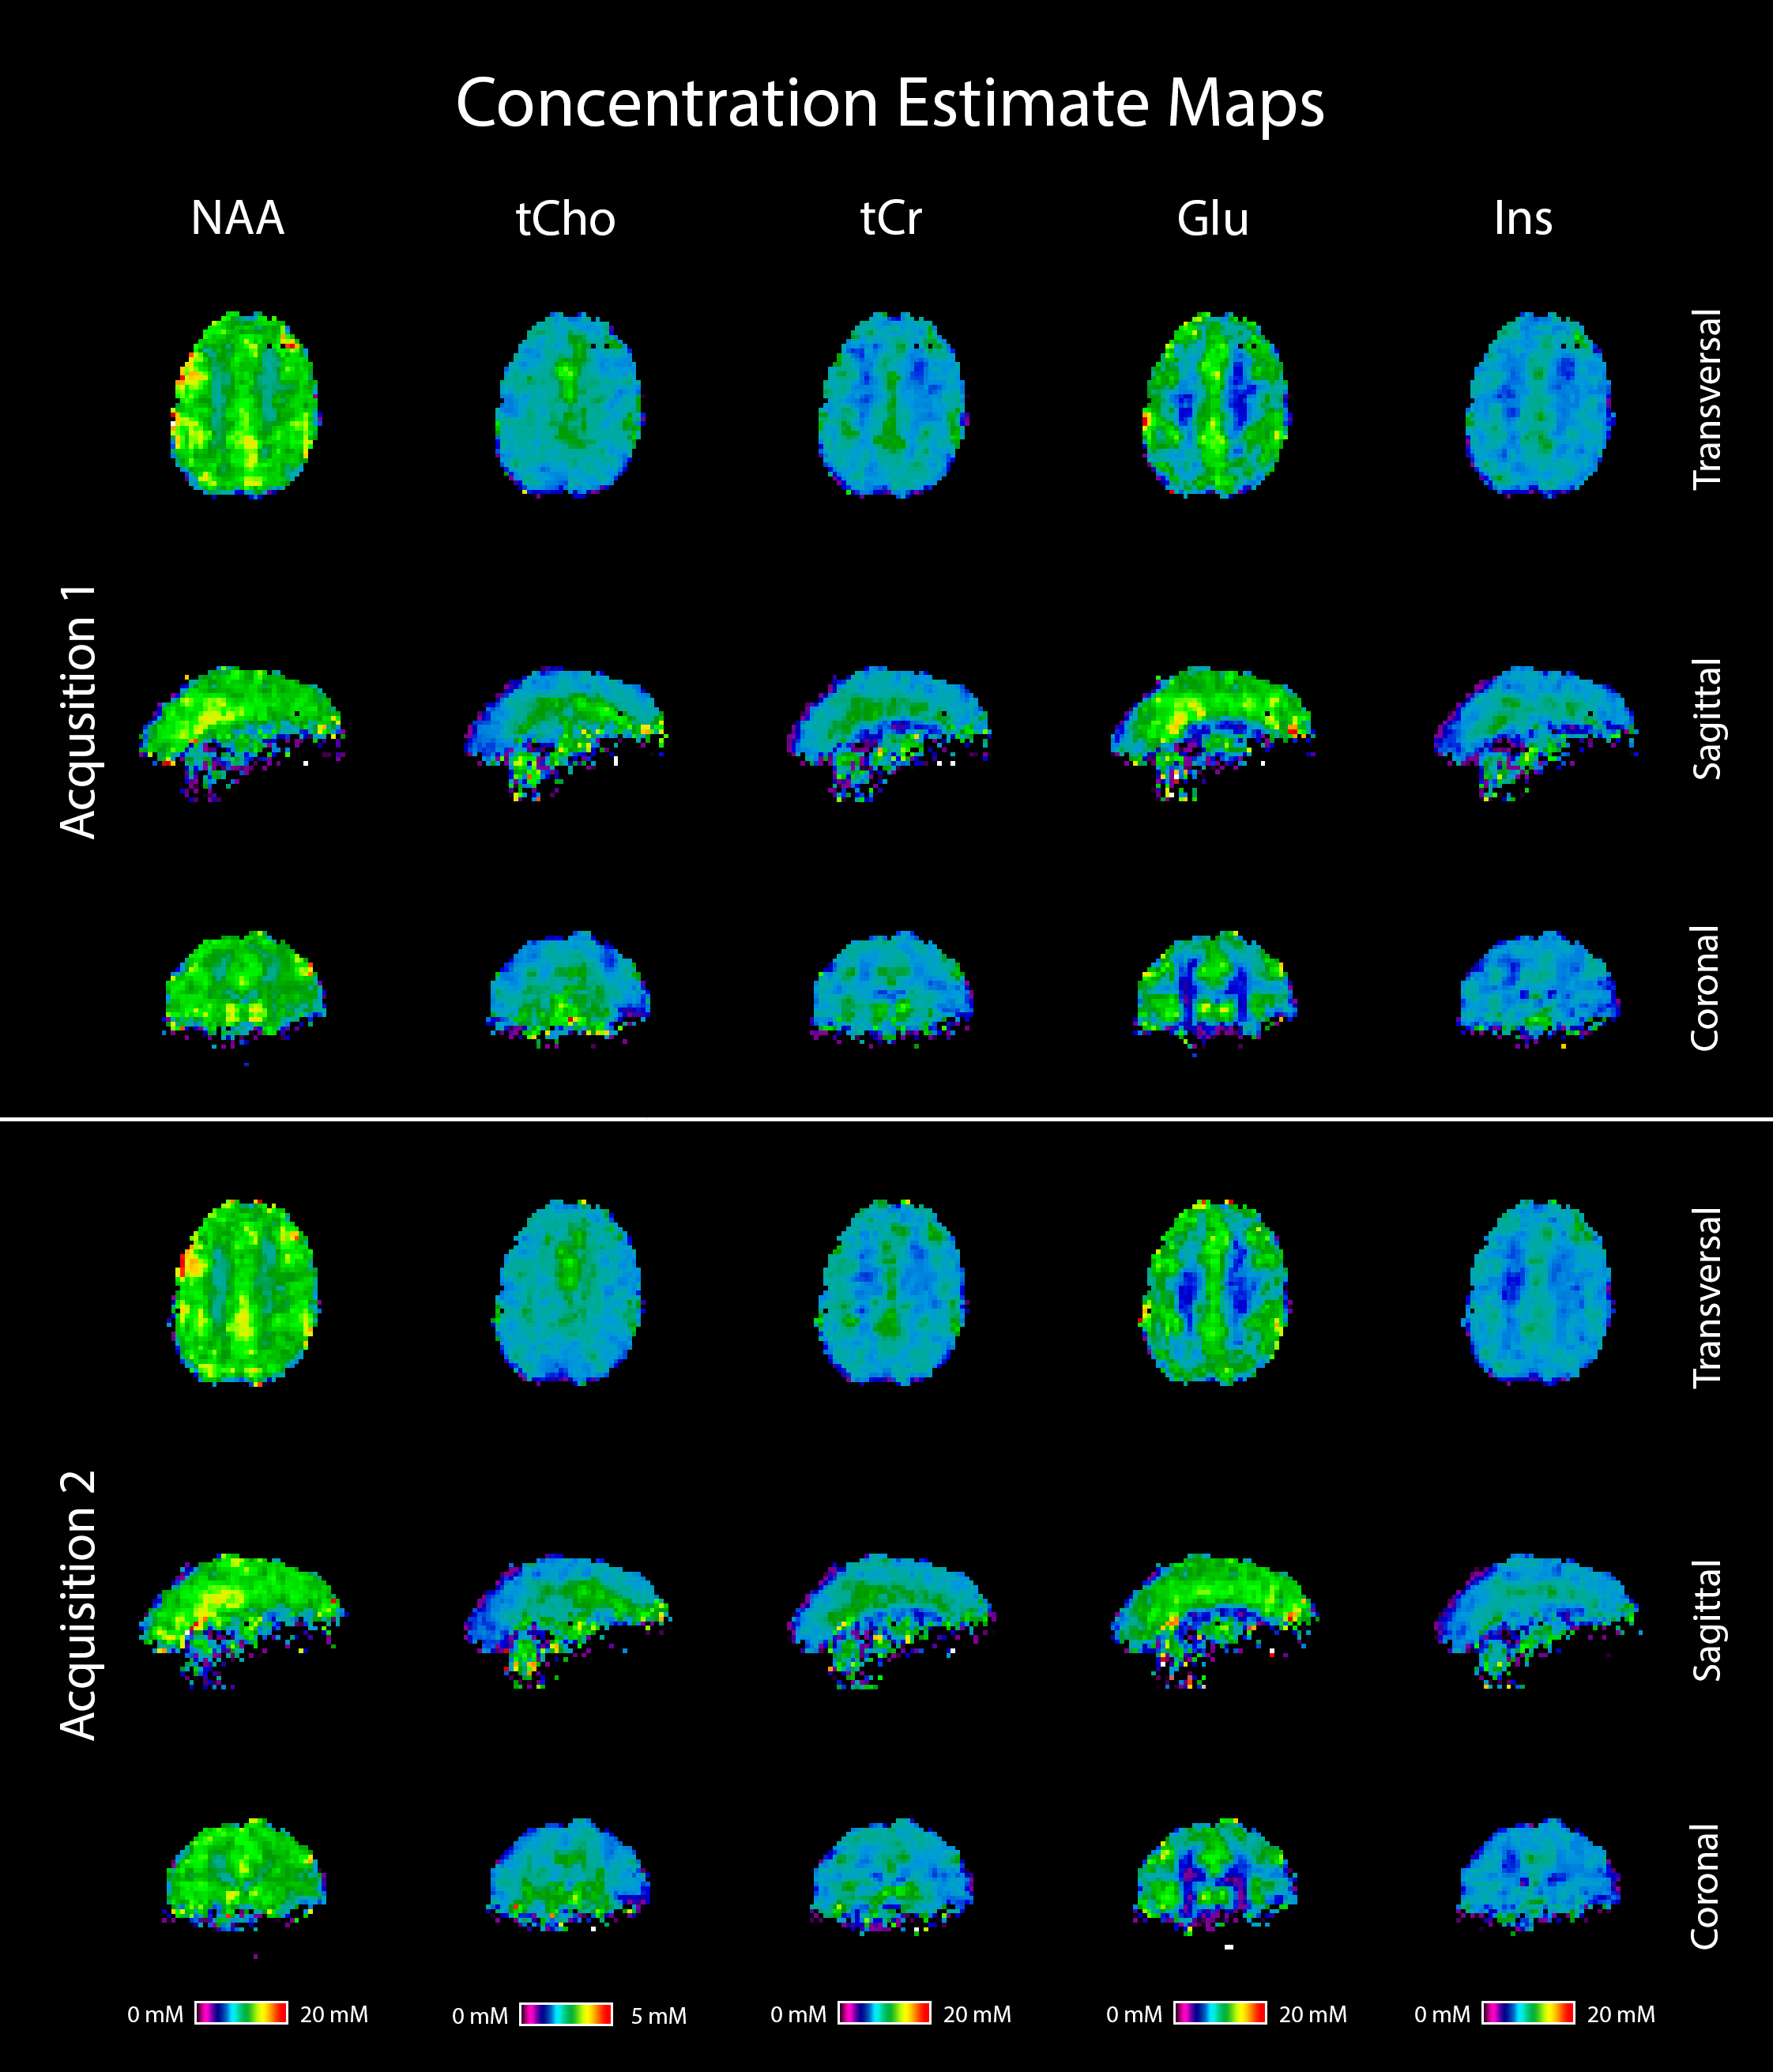
Figure 1: Concentration estimate maps of five metabolites in a volunteer, derived from two consecutive MRSI acquisitions. Both sets of maps use the same color scale, making their good correspondence immediately evident. Transversal, sagittal and coronal slices are shown, and the color scales correspond to concentration values in millimolar (mM).
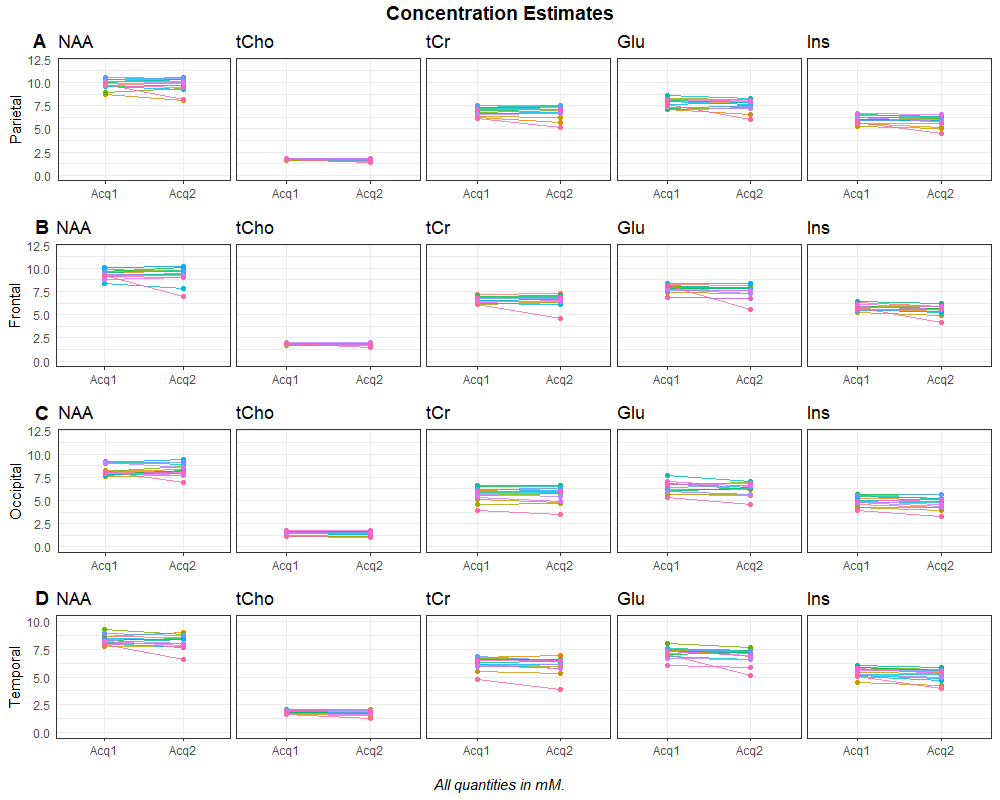
Figure 2: Concentration estimates in all volunteers for five metabolites, for two acquisitions. The rows correspond to the parietal lobe (A), the frontal lobe (B), the occipital lobe (C), and the temporal lobe (D). Generally, the concentration estimates are stable for most volunteers, with the exception of one outlier. In our previous publication about inter-subject stability, the parietal lobe was a region with good spectral quality while the other three regions had just acceptable quality.1
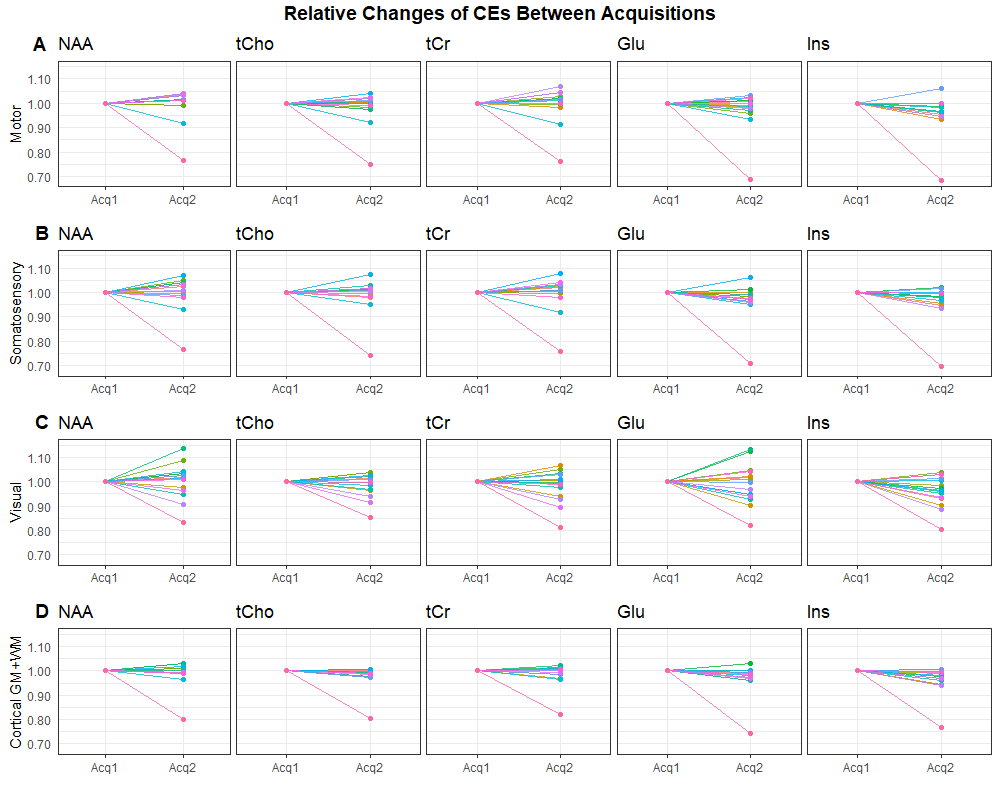
Figure 3: Relative changes of concentration estimates between two acquisitions in all volunteers for five metabolites. Here, the rows correspond to the motor cortex (A), the primary somatosensory cortex (B), the visual cortex (C), and the totality of cortical gray and white matter (D). For most volunteers, the concentration estimate changed by less than 10%, with the exception of the outlier from figure 2, which can be seen even more clearly here.
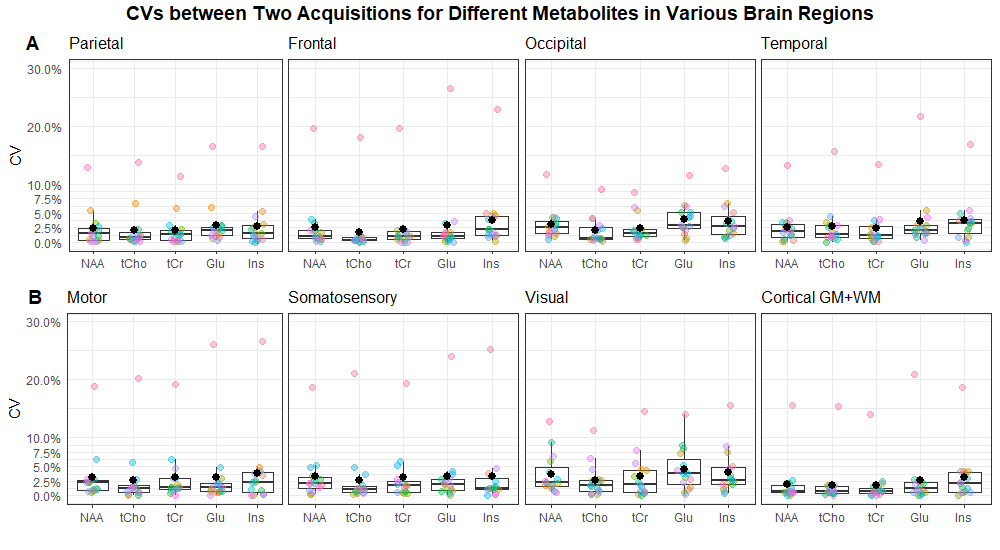
Figure 4: Coefficients of variation between two acquisitions for different metabolites in various brain regions. The first row (A) contains the regions from fig. 2, the second one (B) contains the ones from fig. 3. Most CVs are in the range of 0 and 5%, with the exception of a few outliers. Some regions perform more consistently than others, resulting in narrower value distributions and thus smaller boxes in the box plot.
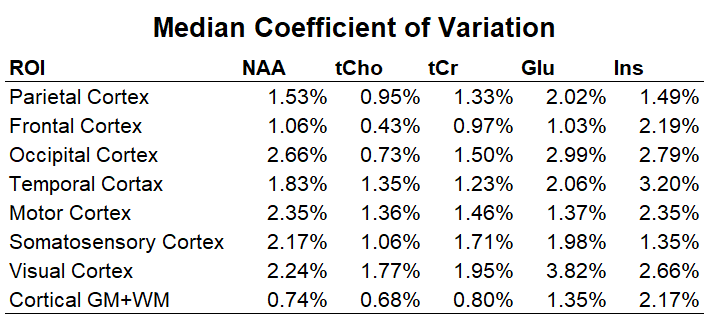
Table 1: An overview of the median intra-subject coefficient of variation in eight different brain regions of interest (ROI) for the metabolites N-acetylaspartate, total choline, total creatine, glutamate and my-inositol.
DOI: https://doi.org/10.58530/2023/0499