0498
Single-shot GABA Editing at 7 Tesla
Li An1, Maria Ferraris Araneta1, Inna Loutaev1, Tara Turon1, Christopher S Johnson1, Sungtak Hong1, and Jun Shen1
1National Institute of Mental Health, National Institutes of Health, Bethesda, MD, United States
1National Institute of Mental Health, National Institutes of Health, Bethesda, MD, United States
Synopsis
Keywords: Data Acquisition, Spectroscopy, MRS, GABA, 7 Tesla
Two-step editing techniques have been widely used to detect the GABA H4 signal at 3.01 ppm with the dominant creatine methyl proton signal cancelled by subtraction. However, subtraction is inherently sensitive to patient movements and system instability. In this work, a single-shot spectral editing technique is developed to detect the GABA H2 resonances at 2.28 ppm in the human brain at 7 Tesla. Although GABA H2 is partially overlapped by glutamate H4, we demonstrate that GABA-glutamate correlation originating from spectral overlap can be reduced to practically zero, therefore suppressing the overlapping effect of glutamate H4 on GABA H2 without subtraction.INTRODUCTION
γ-Aminobutyric acid (GABA) plays a key role in excitation-inhibition balance. Difference editing techniques have been widely used to detect the GABA H4 signal at 3.01 ppm 1. In the difference spectra, residual signal of the dominant creatine singlet due to patient movements and system instability may affect the accuracy and precision of GABA quantification. In this work, we developed a single-shot editing technique for detection of the GABA H2 signal at 2.28 ppm by applying an editing pulse at 1.89 ppm. In the meantime, the sequence timing parameters were optimized to reduce the amplitude of glutamate (Glu) H4 at 2.34 ppm as well as suppressing the correlation between GABA H2 and glutamate H4 to practically zero, therefore minimizing any spectral interference by glutamate H4 without subtraction.METHODS
The pulse sequence is sketched in Figure 1. The editing pulse was applied at 1.89 ppm to refocus the GABA H2 peak. Sequence timing was optimized to minimize GABA-Glu correlation via density matrix simulation of GABA and Glu signals. Following a previous study 2, the real-part of an in vivo spectrum in the spectral range of interest is approximated by:s(n) = c1B1(n) + c2B2(n) + e(n),
where s(n) is the nth data point in the selected ppm range of the in vivo spectrum; B1(n) and B2(n) are the basis spectra of GABA and Glu, whose concentrations are c1 and c2, respectively; e(n) is random noise. The GABA-Glu correlation coefficient r12 can be computed by:
r12 = - ∑B1(n)B2(n) / [sqrt(∑B1(n)2) sqrt(∑B2(n)2)] = - B1 · B2 / (ǁB1ǁ ǁB2ǁ),
where B1 and B2 are column vectors given by B1 = [B1(1), B1(2), …, B1(N)]T and B2 = [B2(1), B2(2), …, B2(N)]T; N is the total number of data points in the selected range and T denotes transpose. Therefore, the correlation coefficient r12 is proportional to the normalized dot product of B1 and B2 in the RN space.
The single-shot GABA editing pulse sequence with numerically optimized timing parameters was used to scan two healthy participants on a Siemens Magnetom 7 T scanner. Test and re-test were performed for each subject. The frequency deviation in each individual acquisition was determined and corrected by fitting the magnitude of the creatine and choline peaks in the spectrum with two Voigt curves. The effects of the frequency drifts on the basis functions were also corrected. The reconstructed in vivo spectrum was fitted in the range of 1.8 – 3.4 ppm by a linear combination of numerically computed metabolite basis functions and a cubic spline baseline after correction of Bloch-Siegert phase shift caused by the editing pulse. Data in the range of 2.21 – 2.40 ppm was given a weighting factor 10 times that of the rest of the fitting range to make GABA H2 the dominant signal for GABA quantification.
RESULTS
Figure 2 displays the numerically calculated basis spectra of Glu, GABA, and their sum using six different TE values under the influence of the Gaussian editing pulse. At TE = 68 ms, glutamate H4 signal intensity was reduced to a level comparable to the GABA H2 peak. However, near-zero GABA-Glu correlation coefficient was achieved only at TE = 76 ms (TE1 = 59.1 ms and Td = 22 ms).In vivo spectra acquired from the dorsal anterior cingulate cortex (dACC) of two healthy participants are displayed in Figures 3 and 4, respectively. The test-retest results demonstrated high consistency. Table 1 lists the in vivo metabolite ratios (/[tCr]) of GABA and 6 other metabolites of interest computed using a total of four MRS measurements from the two healthy participants.
DISCUSSION
In Figure 2, there are prominent changes in the spectral pattern of glutamate H4 for different TE values although the changes in GABA H2 signal are minor. At TE = 68 ms, there is a substantial positive peak at the upfield end of the glutamate H4 signal. This positive peak dominates the overlap between the Glu H4 signal and the positive GABA H2 signal, leading to a negative r12 of large magnitude (r12 = -0.553) since an overdetermination (underdetermination) of GABA H2 is compensated by an underdetermination (overdetermination) of Glu H4. As TE increases, this positive upfield peak decreases while a negative upfield peak of Glu H4 grows in significance (see Figure 2). This change in the spectral pattern of Glu H4 reduces the magnitude of r12 as contributions to Glu-GABA correlation from the positive and negative upfield peaks cancel each other. At TE = 76 ms, the basis spectra of Glu and GABA become nearly orthogonal (B1 · B2 ≈ 0), therefore minimizes spectral interference to GABA H2 by Glu H4 (r12 = 0.006). When TE reaches 88 ms, r12 is trending smaller again as the overlap between Glu H4 and GABA H2 is further reduced. However, longer TEs were not used to avoid greater T2 loss.CONCLUSION
A single-shot spectral editing method was developed to detect the GABA H2 resonances at 2.28 ppm in the human brain at 7 Tesla with minimized interference from the Glu H4 resonances. GABA was quantified in two healthy participants with a CRLB value of 9.4 ± 2.9 % and within-subject CV of 12.4 %.Acknowledgements
No acknowledgement found.References
- Puts NA, Edden RA. In vivo magnetic resonance spectroscopy of GABA: A methodological review. Prog Nucl Magn Reson Spectrosc 2012; 60:29–41.
- Hong S, An L, Shen J. Monte Carlo study of metabolite correlations originating from spectral overlap. J Magn Reson 2022;341:107257.
- Marshall I, Higinbotham J, Bruce S, Freise A. Use of Voigt lineshape for quantification of in vivo 1H spectra. Magn Reson Med 1997;37(5):651-657.
Figures
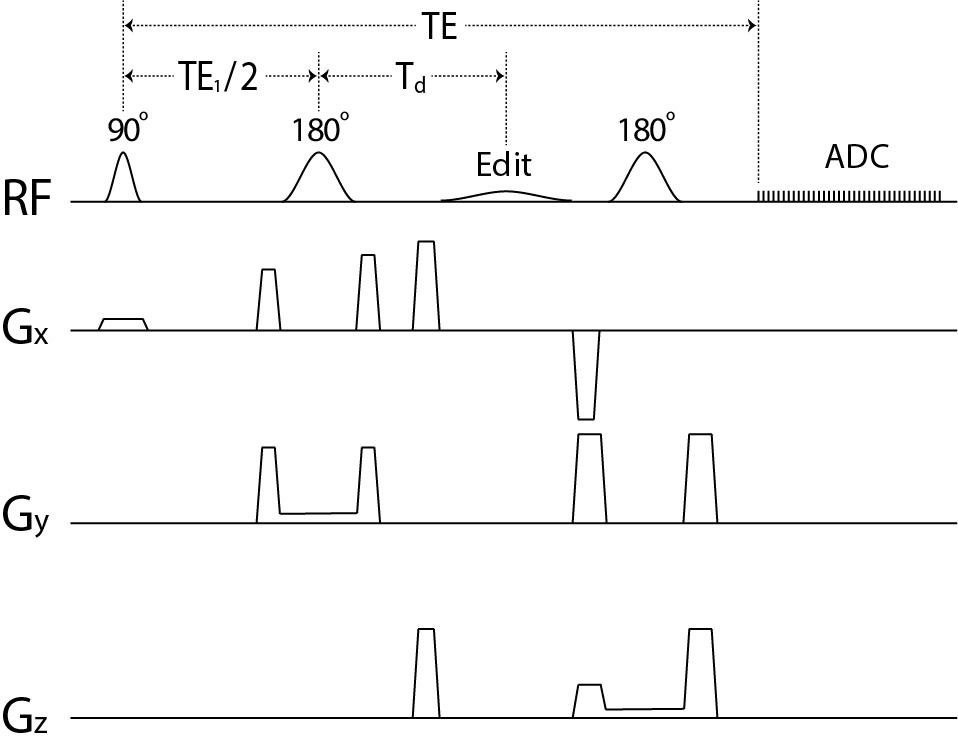
Figure 1 Schematic diagram of the single-shot
GABA editing pulse sequence using a single editing pulse (labeled as “Edit” in
the figure). The editing pulse was a truncated Gaussian pulse applied at 1.89
ppm with 15 ms duration and 180° flip angle.
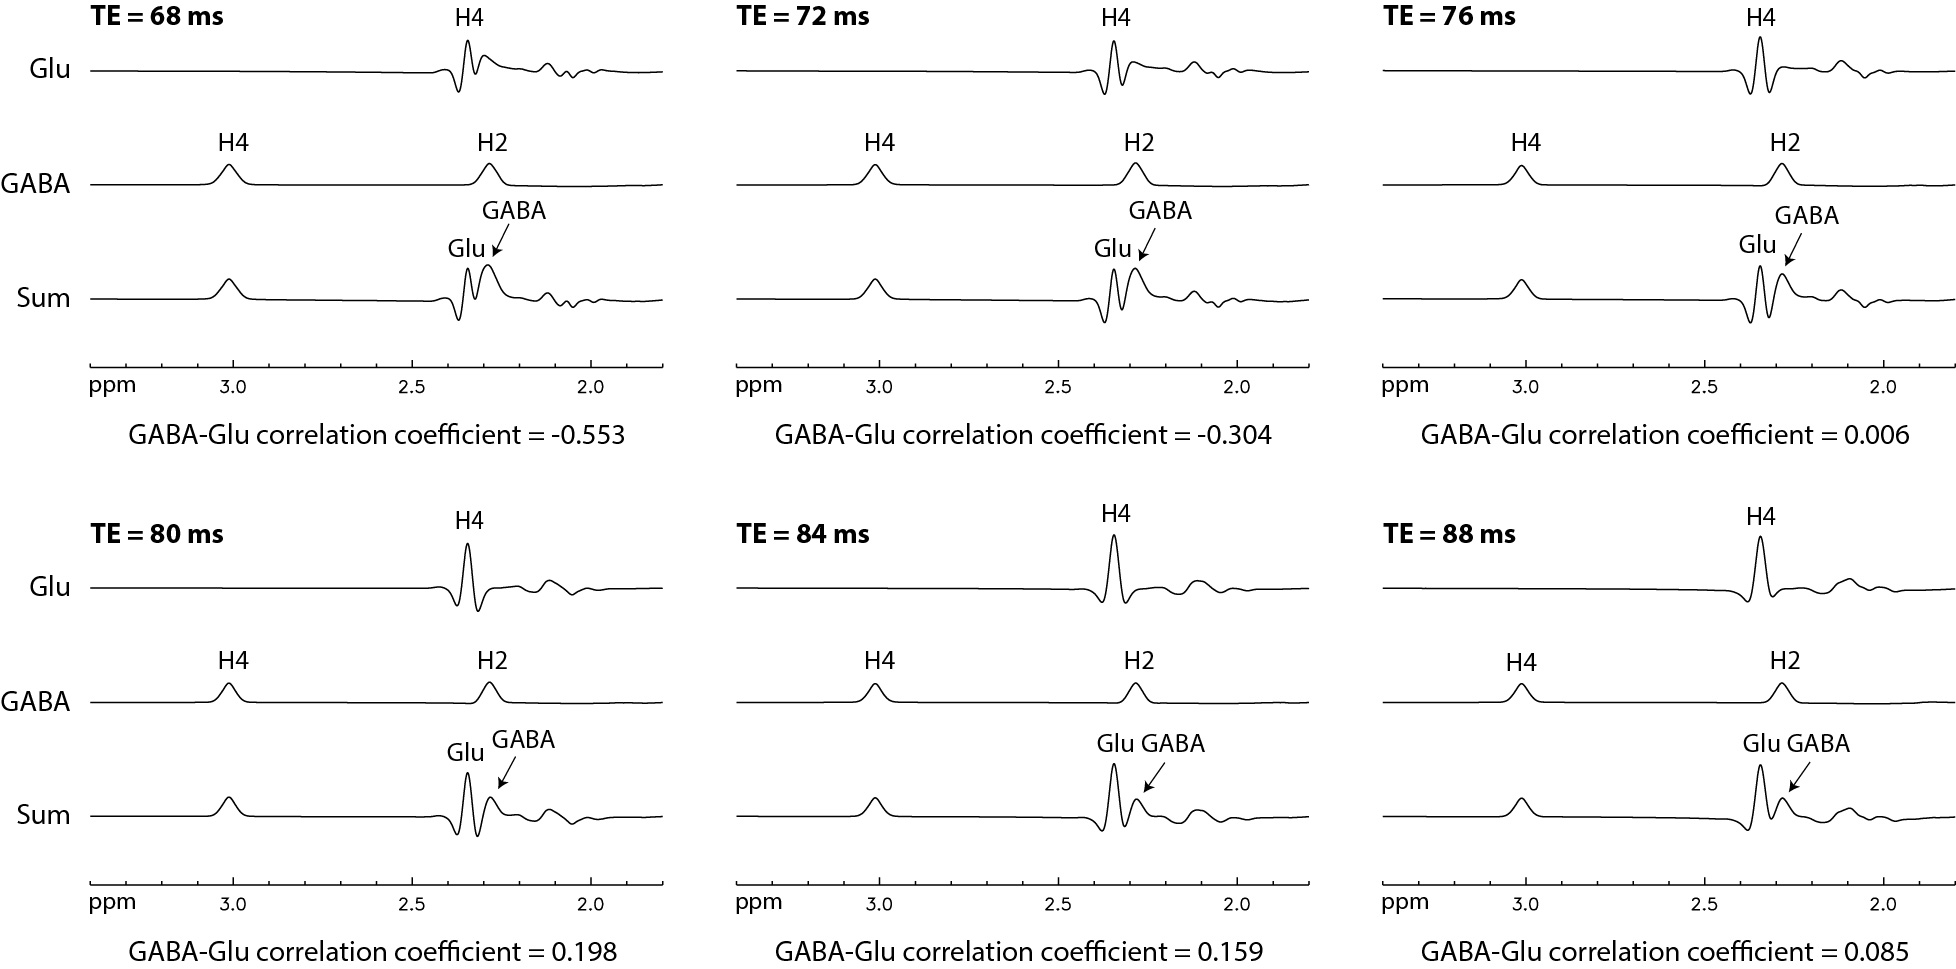
Figure 2 Numerically computed spectra
of GABA, Glu, and their sum for six different TE values. Voigt lineshape 3
with 10 Hz linewidth and 50% Lorentzian was used for all spectra. The
concentration ratio was [GABA] : [Glu] = 1 : 13. GABA-Glu correlation was
minimized at TE = 76 ms.
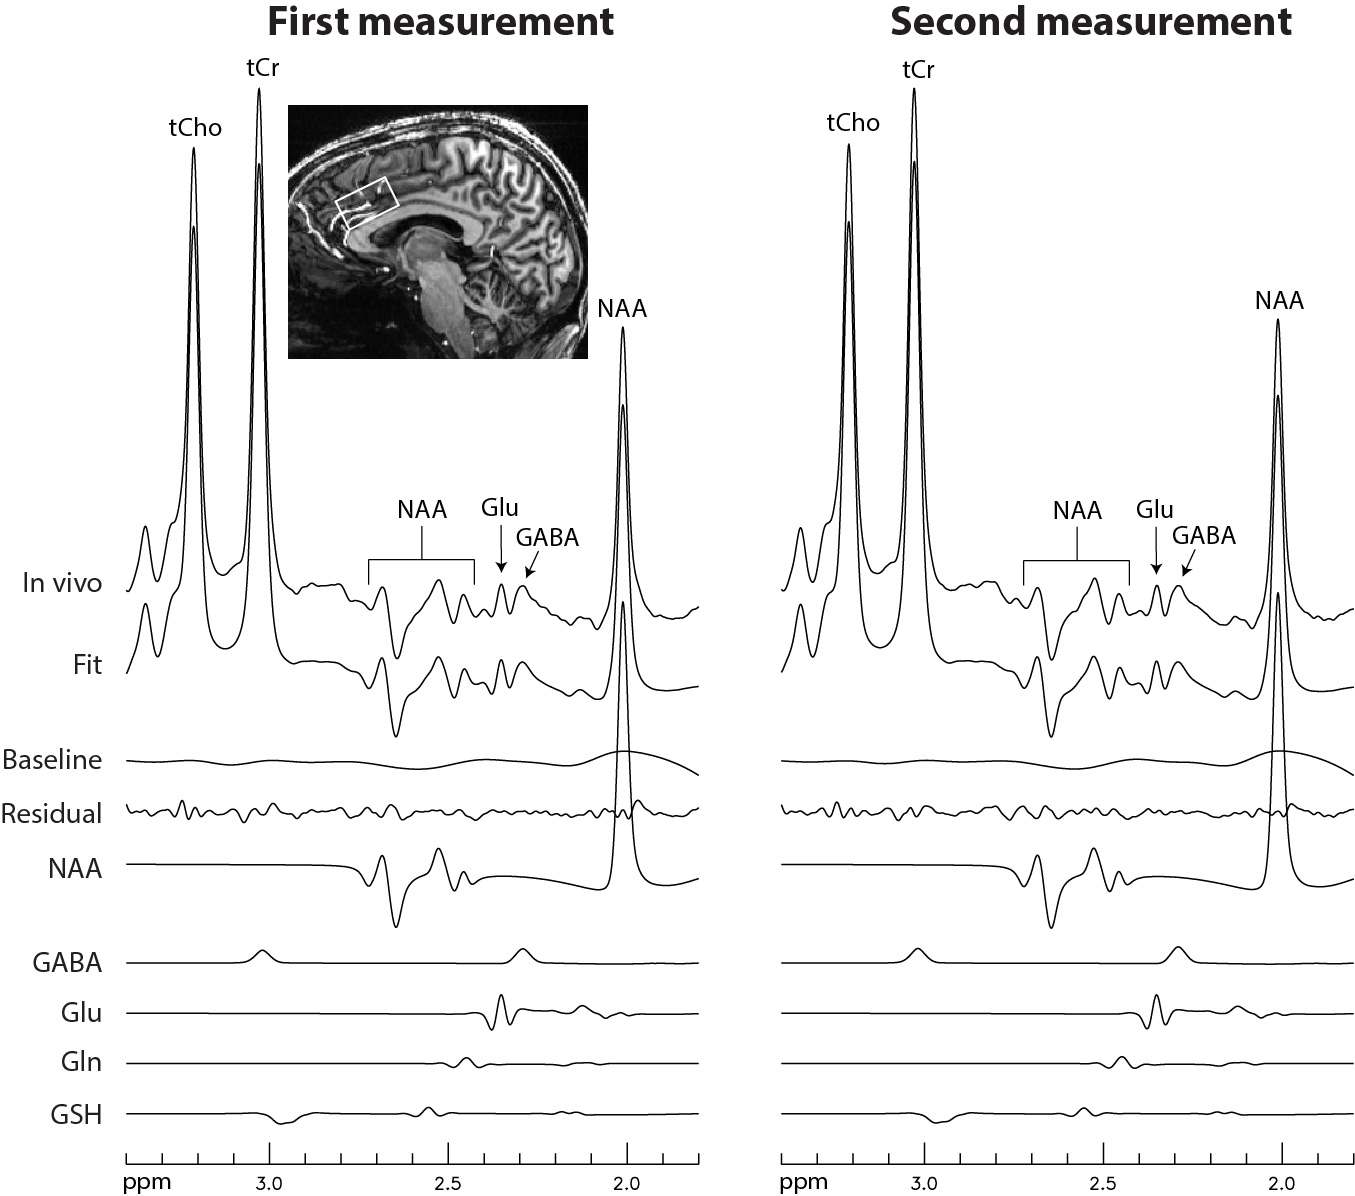
Figure 3 In vivo
spectra acquired from the dACC of the first healthy participant. No
linebroadening was applied.
Voxel size = 2 × 3.5 × 2
cm3; TR = 2.5 s; TE = 76 ms; TE1 = 59.1 ms; Td = 22
ms; spectral width = 4000 Hz; number of data points = 1024; number of averages
= 116; and total scan time = 5 min.
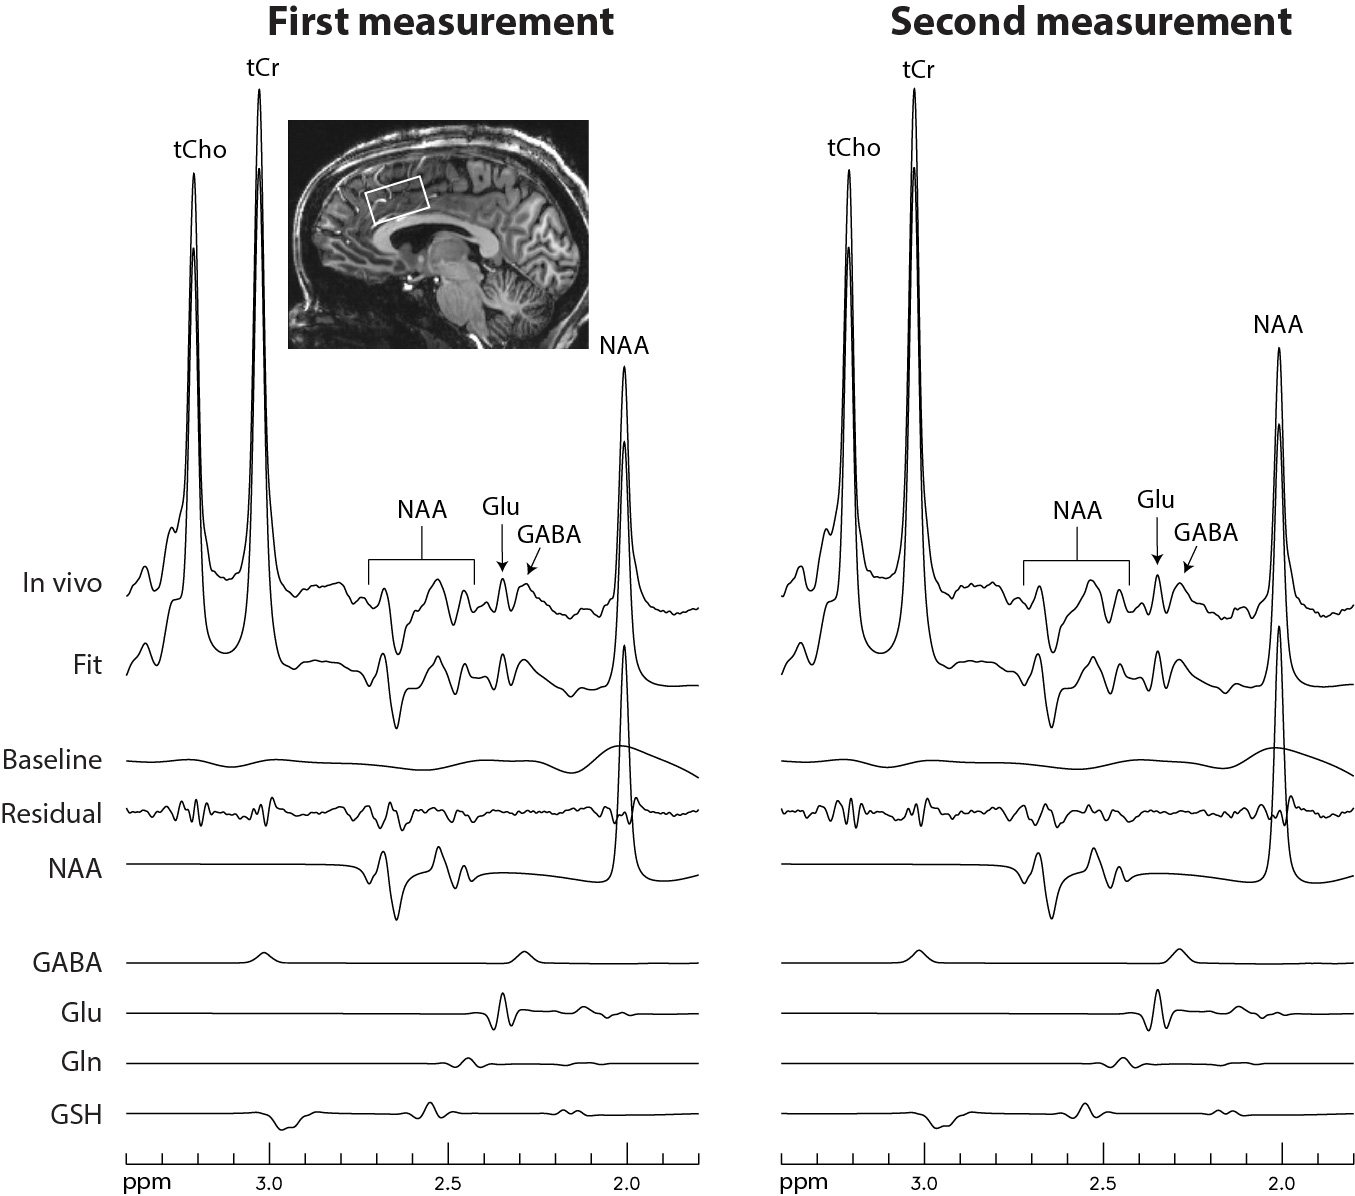
Figure 4 In vivo
spectra acquired from the dACC of the second healthy participant using the same
data acquisition parameters as in Figure 3.
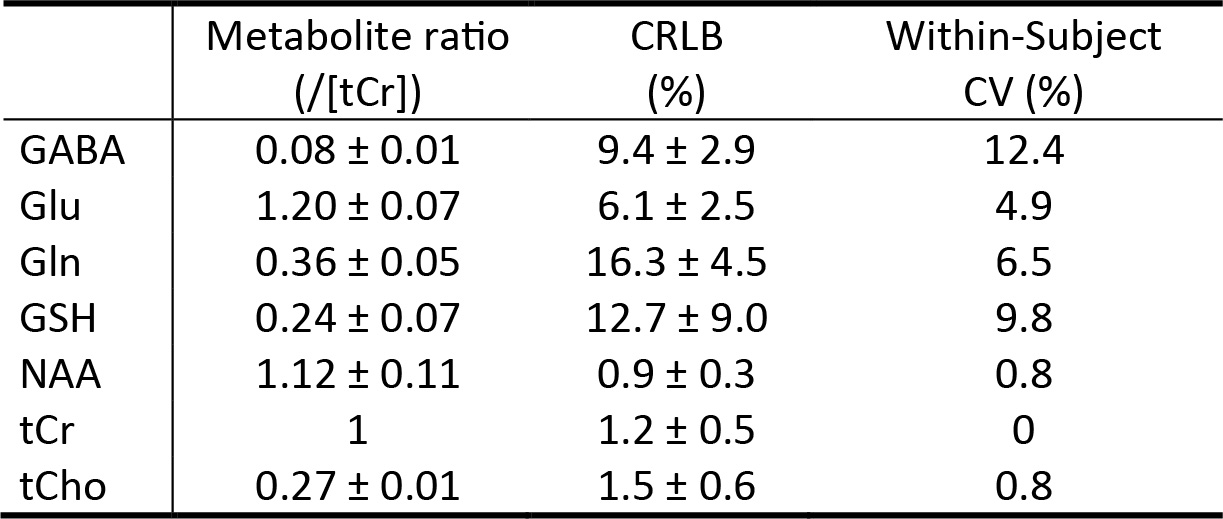
Table 1 Metabolite
ratios (/[tCr]) and corresponding Cramer-Rao lower bound (CRLB) and
within-subject coefficient of variation (CV) values measured from the dACC of
healthy participants (n = 2). The within-subject CV values were computed from the two MRS measurements
of each subject. Abbreviations: NAA, N-acetylaspartate; GABA, g-Aminobutyric acid; Glu, glutamate;
Gln, glutamine; GSH, glutathione; tCr, total creatine; tCho, total choline.
DOI: https://doi.org/10.58530/2023/0498