0496
Direct estimation of metabolite maps from undersampled k-space data using linear tangent space alignment1Radiology, Massachusetts General Hospital, Boston, MA, United States, 2Radiology, Harvard Medical School, Boston, MA, United States
Synopsis
Keywords: Spectroscopy, Image Reconstruction, MRSI quantification
Conventional MRSI methods perform MRSI image reconstruction and spectral quantification in two separate steps. This work presents a novel direct estimation method for MRSI that reconstructs high-resolution metabolite concentration maps from undersampled k-space data, leveraging a linear tangent space alignment (LTSA) model for spectral quantification and a low-rank (LR) model for denoising. Furthermore, the proposed framework allows estimating the temporal basis functions of the LR model from the undersampled, noise-corrupted k-space data, thus eliminating the need for experiment-dependent or pre-acquired spectral training data. The performance of the proposed method was validated using numerical simulation phantom and in vivo MRSI data.Introduction
MR spectroscopic imaging is a powerful non-invasive imaging tool that quantitatively maps the spatial distribution of endogenous metabolites of the human body. The SPICE (SPectroscopic Imaging by exploiting spatiospectral CorrElation) method is an emerging method for high-resolution MRSI, which leverages a subspace model for data acquisition and image reconstruction, overcoming many long-standing technical barriers of conventional MRSI1-3. In SPICE, the image reconstruction is performed using a low-rank (LR) constraint, where the temporal basis functions are estimated either from experiment-dependent low-resolution MRSI data1,2 or pre-acquired spectral training data4,5. After image reconstruction, joint spectral quantification is used to estimate metabolite concentration maps6,7.Recently, a manifold learning based-method has been proposed to leverage the intrinsic low-dimensional structure of high-dimensional data via a linear tangent space alignment (LTSA) model for dynamic MRI8 and MRSI spectral quantification9. This work presents a novel direct estimation method for MRSI that reconstructs metabolite concentration maps from undersampled k-space data, leveraging both the bilinear LTSA model for spectral quantification and the linear LR model for denoising. Furthermore, the proposed framework allows estimating the temporal basis functions of the LR model from the undersampled, noise-corrupted k-space data, thus eliminating the need for pre-acquired spectral training data. We validated the performance of the proposed method using numerical simulation phantom and in vivo 1H-MRSI data acquired at 3T.
Methods
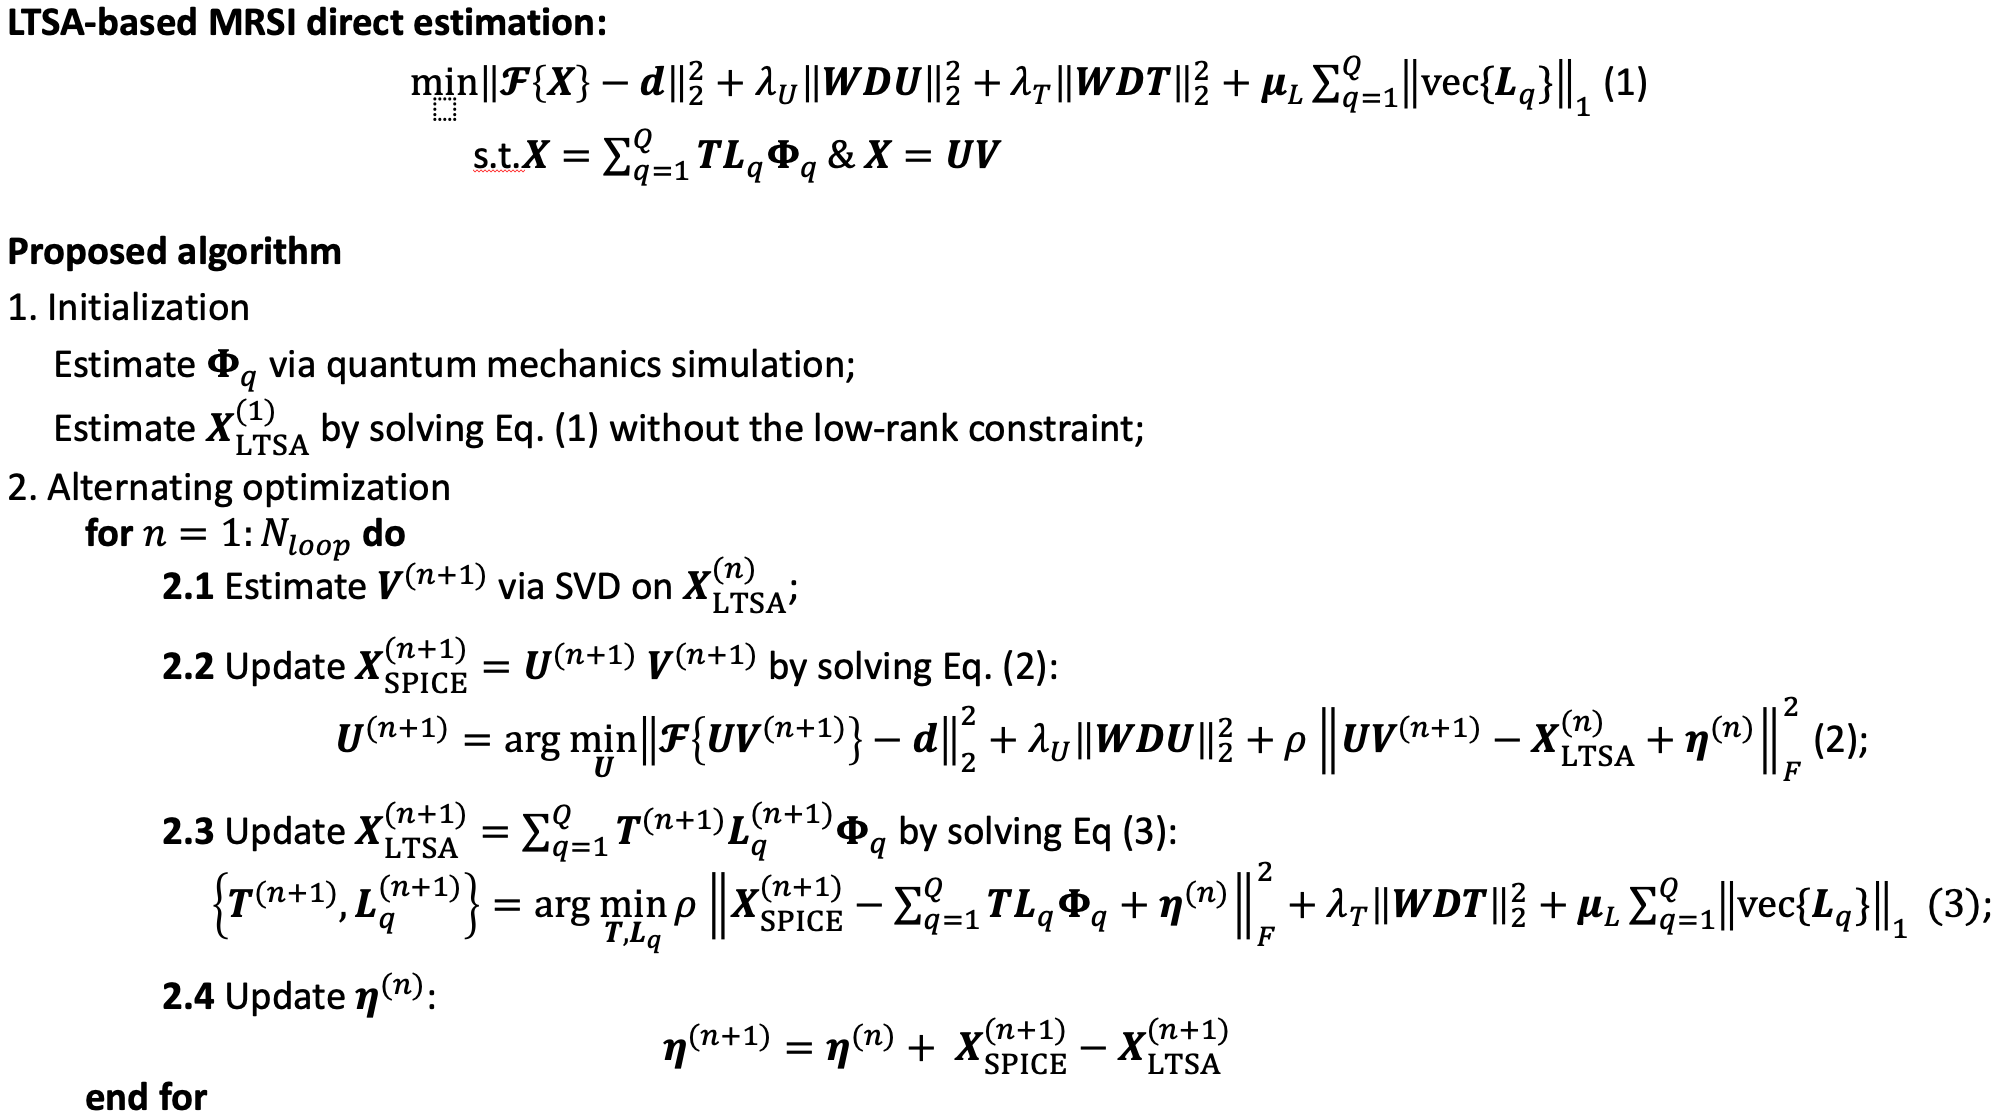
MRSI signal modeling using LTSA: The time-domain MRSI signal can be written as the sum of each metabolite signal $$$X(r,t) = \sum_{q}^{Q} X_q(r,t)$$$. The signals of each metabolite form a neighborhood, which is most intuitive when there is no overlap among the metabolite spectra in the frequency domain, while the following mathematical model allows overlap between neighborhoods and doesn’t depend on the domain of the signals. The previous work6 has shown that the neighborhood formed by each metabolite can be represented by a low-dimensional subspace. Our recent work9 has further shown that if the underlying manifold of the MRSI signal is smooth and regular, the local coordinates of the metabolite signals in each neighborhood can be aligned with the low-dimensional global coordinates of the manifold via the LTSA model:$$ X(r,t) = \sum_{q}^{Q} T(r) L_{q} \Phi_{q}(t),$$where $$$ T(r) $$$ denotes the global coordinates of the manifold; $$$ \Phi_{q}(t) $$$ denotes the temporal basis functions of the neighborhood formed by the q-th metabolite, which can be estimated via quantum mechanics simulation6; and, $$$ L_{q} $$$ is a small size matrix that aligns the local coordinates of the q-th metabolite associated with $$$ \Phi_{q}(t) $$$ to the global coordinates. The LTSA model significantly reduces the number of unknowns of the MRSI signals compared to the subspace model6.LTSA-based direct estimation for MRSI: We propose the following LTSA-based framework for direct estimation of metabolite concentration maps from undersampled k-space data:$$ \text{arg min}_{X} \parallel F\{X\} - d \parallel_2^{2} + \lambda_{U} \parallel WDU \parallel_{2}^2 + \lambda_{T} \parallel WDT \parallel_{2}^2 + \mu_{L} \sum_{q=1}^{Q} \parallel vec\{L_q\} \parallel_{1}, \text{s.t.} X = \sum_{q}^{Q} T L_{q} \Phi_{q} \text{ & } X = UV, (1)$$where $$$ F $$$ denotes the forward imaging operator accounting for Fourier transform, B0 inhomogeneity, and k-space sampling, and $$$ d $$$ denotes the undersampled k-space data. The first term of Eq. (1) is a data fidelity term; the second and the third terms incorporate anatomical prior knowledge of the spatial coefficients of the model, where $$$ D $$$ is a finite difference operator in the space domain and $$$ W $$$ denotes edge weights derived from a structural reference image2; and, the fourth term promotes the sparsity of the alignment matrix of the LTSA model, leading to a sparse representation of the local coordinates9. Besides the LTSA model, an explicit LR constraint is introduced for denoising.
The optimization problem in Eq. (1) can be solved using an ADMM-based algorithm that solves two sub-problems alternatively, illustrated in Figure 1 because of the space limit. At each iteration step, the first subproblem can be considered as an LR-based image reconstruction with an L2-norm prior obtained by the LTSA-based joint spectral quantification at the previous step. Note that the temporal basis functions of the LR constraint are estimated and updated by performing SVD on the LTSA-estimated MRSI images at each step rather than using pre-acquired training data. The second subproblem is an LTSA-based joint spectral quantification problem, which can be solved using the algorithm described in our previous work9.
Results
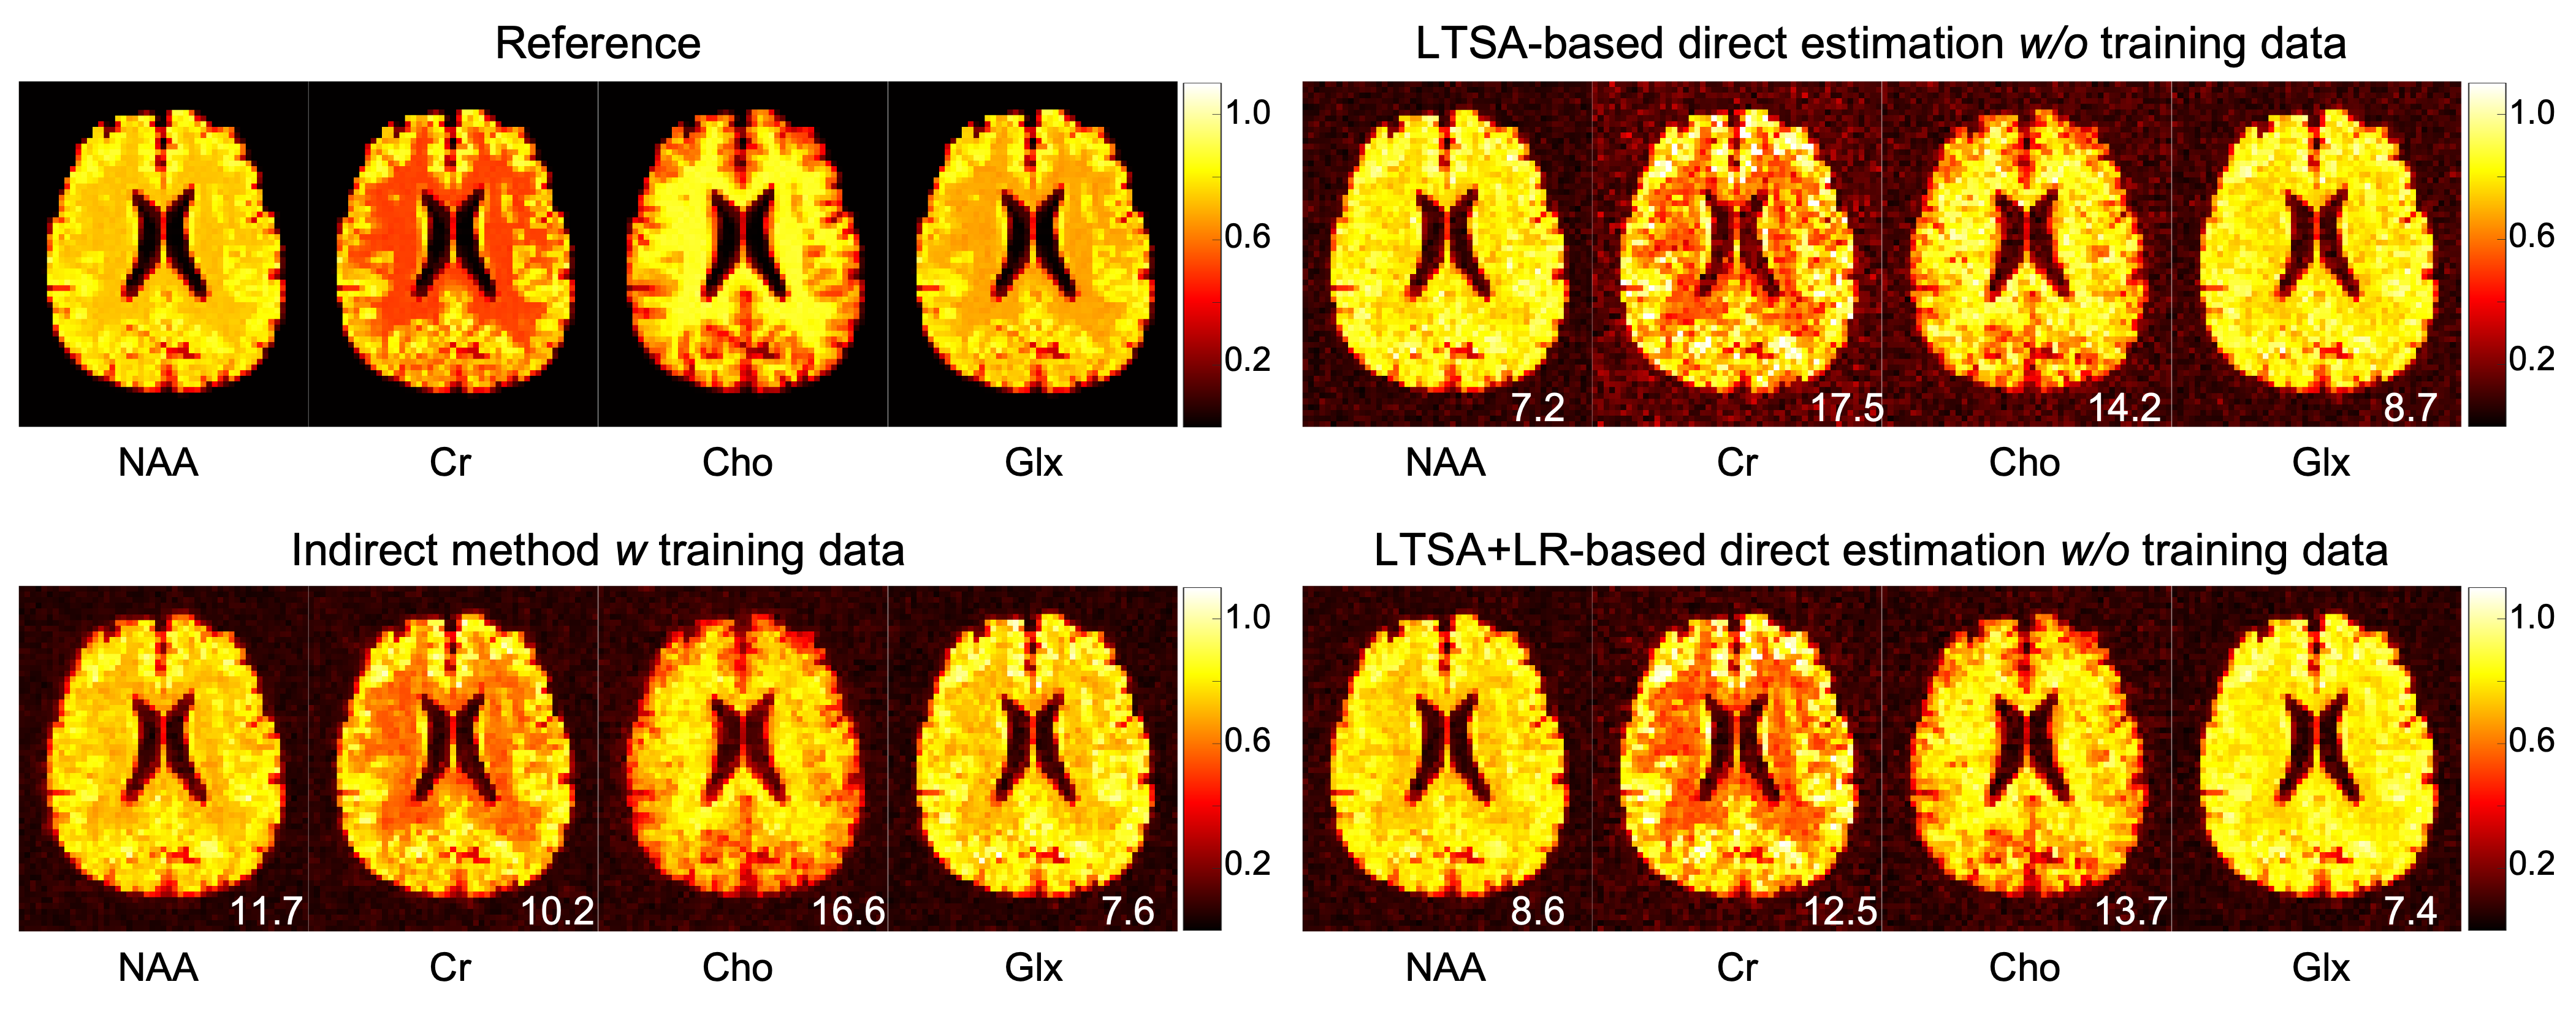
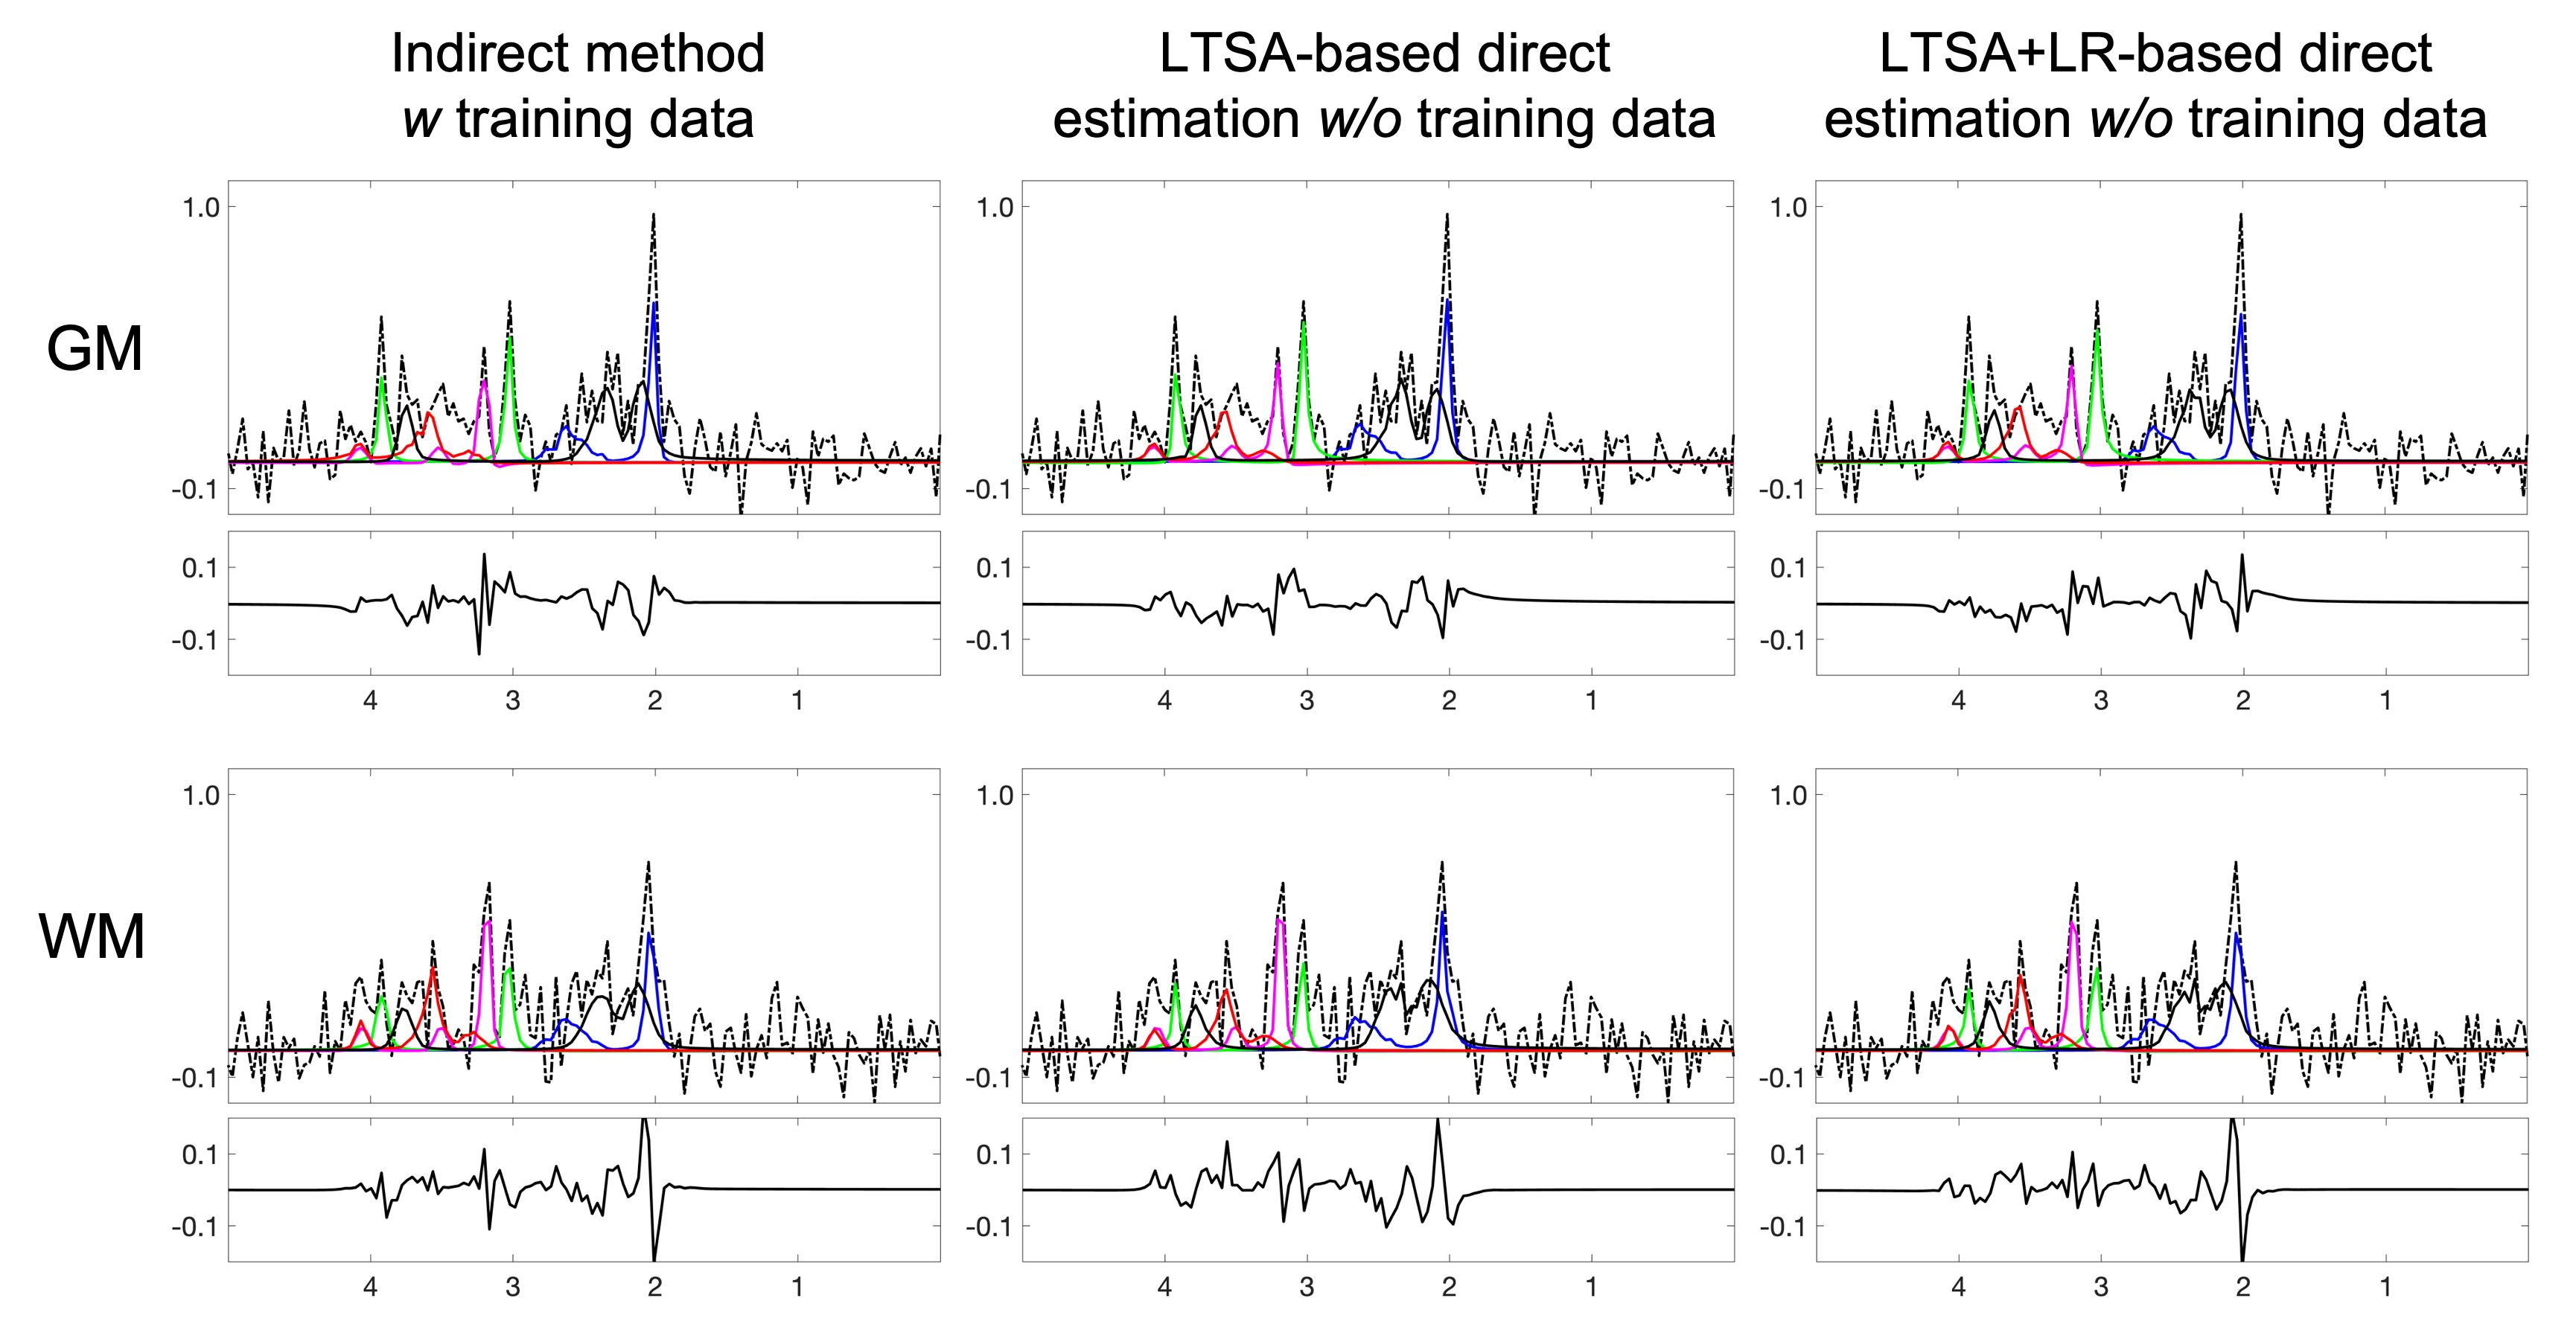
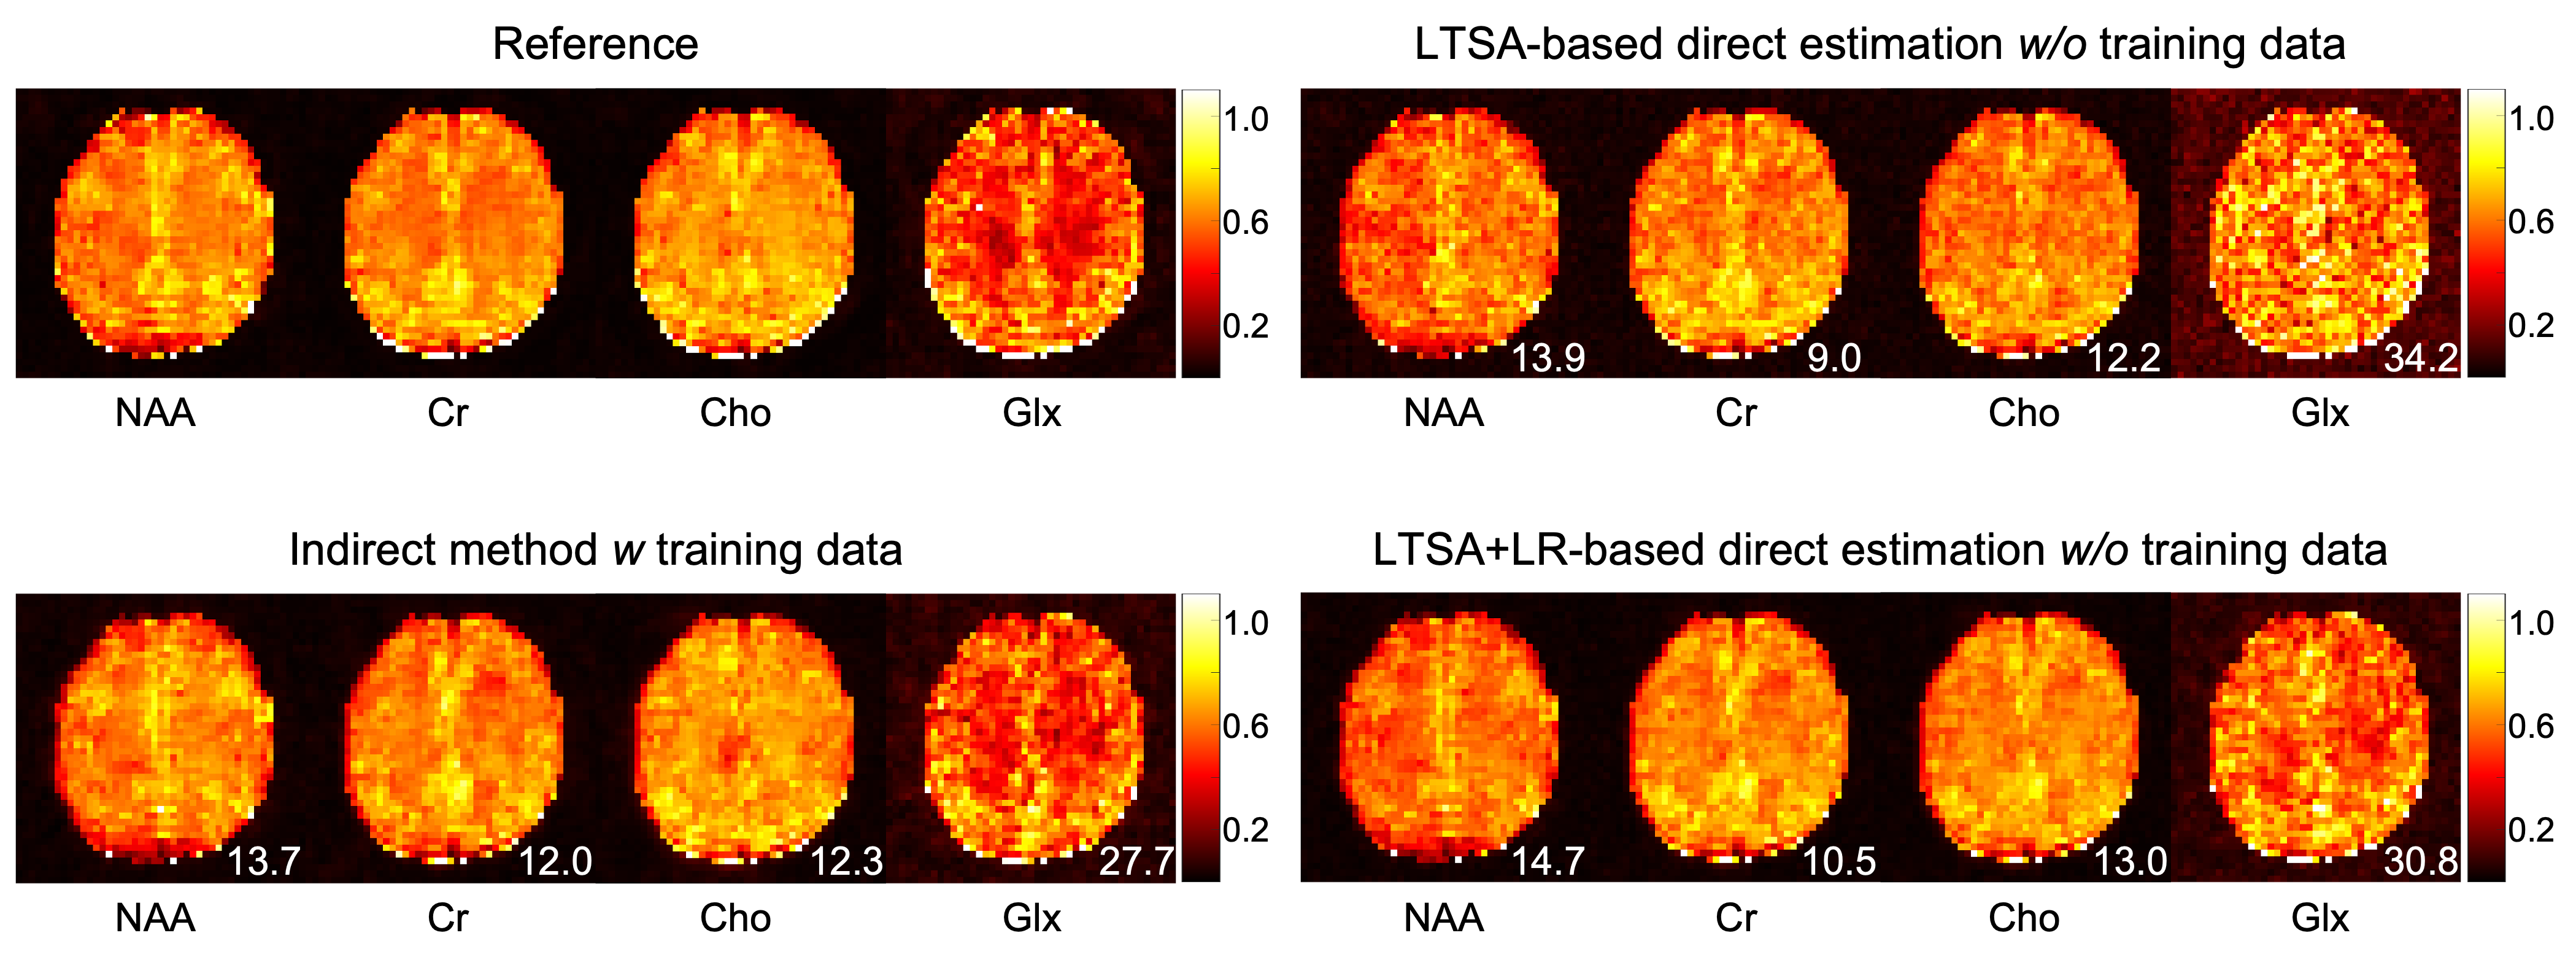
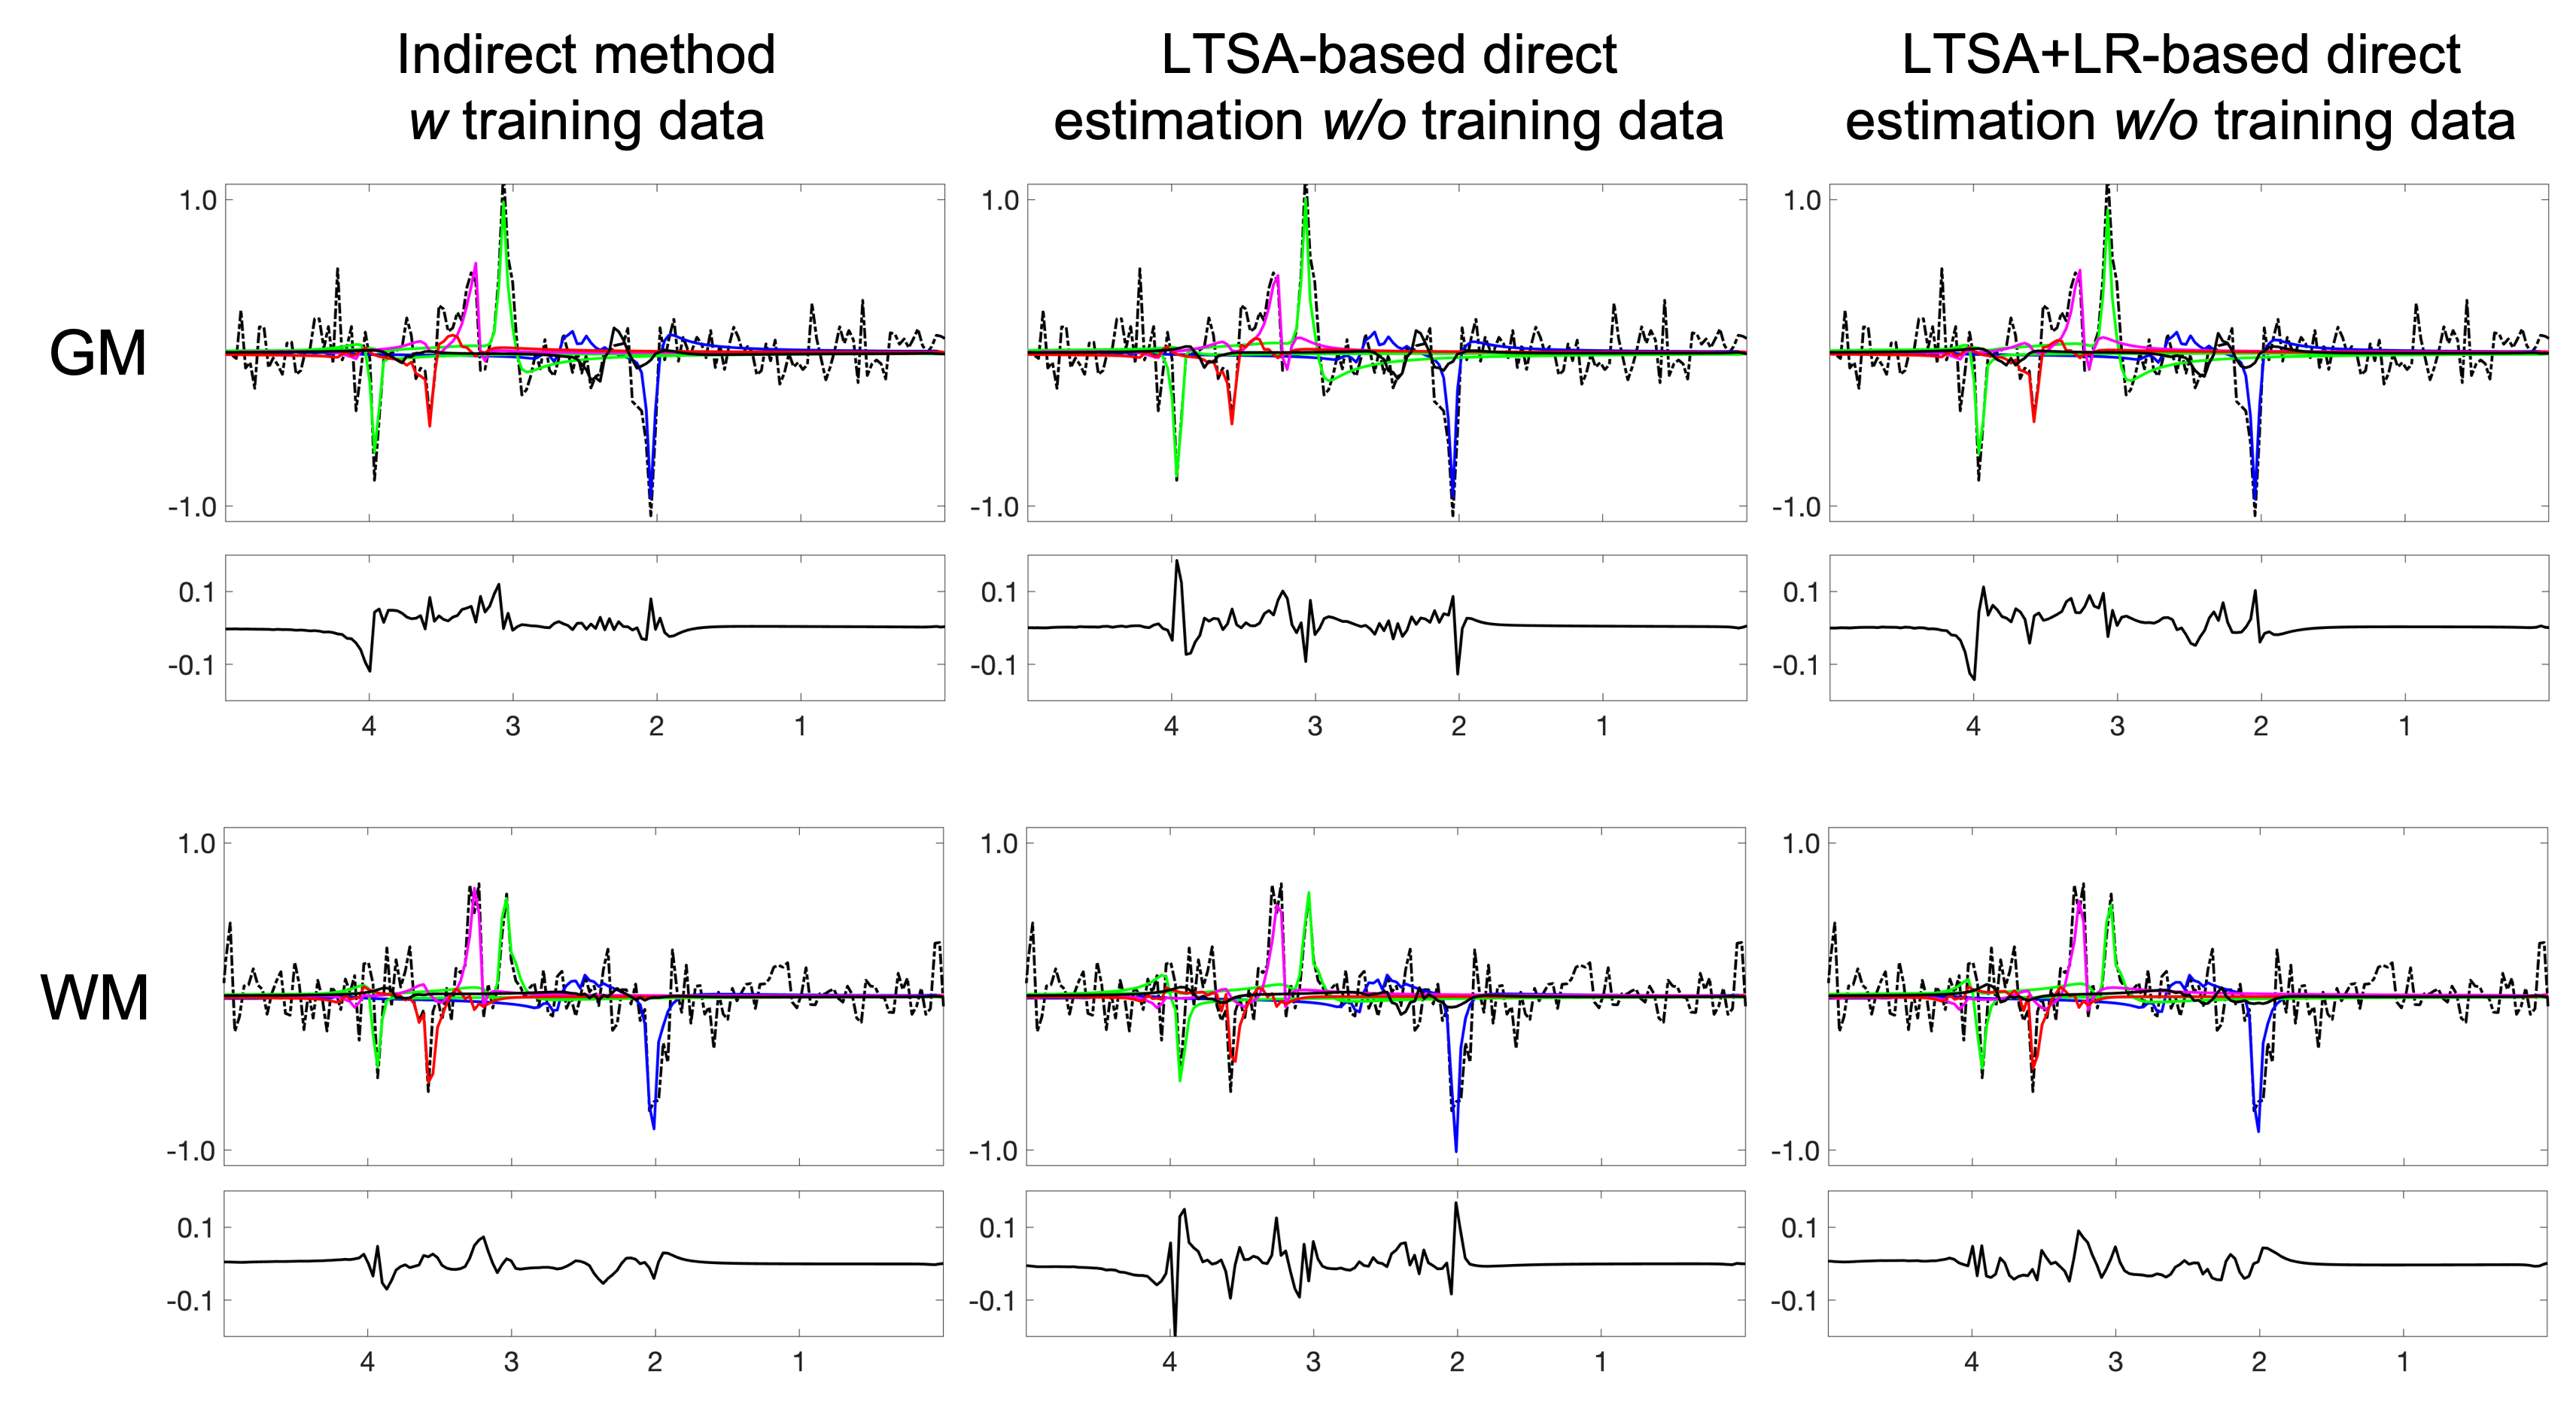
The performance of the proposed method was validated using numerical simulation data and 2D MRSI data acquired using an FID-MRSI sequence with an EPSI trajectory and 60 averages on a healthy volunteer at 3T (approved by our IRB). The reference metabolite maps of the in vivo data were created using SPICE reconstruction followed by the LTSA-based spectra quantification9. Gaussian noise was then added to reference metabolite maps to simulate undersampled (in the spectral domain) and noise-corrupted k-space data. The results are shown in Figures 2-4. The proposed direct estimation method achieved quantification accuracies comparable to the indirect method without any spectral training data. The additional LR constraint further improved the SNR of the estimated metabolite maps.Conclusion
Direct estimation of metabolite maps from undersampled k-space data can be achieved using the proposed LTSA-based framework without pre-acquired spectral training data.Acknowledgements
This work was supported in part by the National Institutes of Health (grant numbers, R01CA165221, P41EB022544, K01EB030045, and R01EB033582).References
1. Lam F, Liang ZP. A subspace approach to high-resolution spectroscopic imaging. Magn Reson Med. 2014;71:1349–1357.
2. Lam F, Ma C, Clifford B, Johnson CL, Liang ZP. High-resolution 1H-MRSI of the brain using SPICE: Data acquisition and image reconstruction. Magn Reson Med. 2016;76:1059–1070.
3. Ma C, Lam F, Johnson CL, Liang ZP. Removal of nuisance signals from limited and sparse 1H MRSI data using a union-of-subspaces model. Magn Reson Med. 2016;75:488–497.
4. Lam F, Li Y, Guo R, Clifford B, Liang ZP. Ultrafast magnetic resonance spectroscopic imaging using SPICE with learned subspaces. Magn Reson Med. 2020;83:377–390.2.
5. Lam F, Li Y, Peng X. Constrained magnetic resonance spectroscopic imaging by learning nonlinear low-dimensional models. IEEE Trans Med Imaging. 2020;39:545–555.
6. Li Y, Lam F, Clifford B, Liang ZP. A subspace approach to spectral quantification for MR spectroscopic imaging. IEEE Trans Biomed Eng. 2017;64:2486–2489.
7. Ning Q, Ma C, Lam F, Liang ZP. Spectral quantification for high-resolution MR spectroscopic imaging with spatiospectral constraints. IEEE Trans Biomed Eng. 2017;64:1178–1186.
8. Djebra Y, Marin T, Han PK, El Fakhri G, Bloch I, Ma C. Manifold learning via tangent space alignment (LTSA) for accelerated dynamic MR imaging with sparse sampling. IEEE Trans Med Imaging. 2022; doi:10.1109/TMI.2022.3207774.
9. Ma C, Han PK, Zhuo Y, Djebra Y, Marin T, El Fakhri G. Joint spectral quantification of MR spectroscopic imaging using linear tangent space alignment (LTSA)-based manifold learning. Magn Reson Med. 2022; doi: 10.1002/mrm.29526
Figures