0495
Single-shot SLOW-editing for Downfield α-Glucose MRSI at 7T Utilizing SNR-Enhancing Glucose Mutarotation Effect1Support Center for Advanced Neuroimaging (SCAN), University of Bern, Bern, Switzerland, 2Translational Imaging Center, sitem-insel, Bern, Switzerland
Synopsis
Keywords: Pulse Sequence Design, Spectroscopy, Spectral Editing
Changes in brain glucose occur in many neurological disorders as well as during aging. Most studies on the uptake of glucose in the brain use positron emission tomography, which requires injection of a radioactive tracer. Our study shows that ultra-high-field 1H-MRS single-shot SLOW-editing can be used to measure α-D-glucose at 5.22 ppm in vivo, and thus that α-D-glucose might have the potential to be used as a an economic radiation free tracer in the human brain.INTRODUCTION
Most of the glucose studies in MRS were performed using the 13C-MRS [1] and 2H-MRS [2], despite their low sensitivity and low spatial resolution. In contrast, 1H-MRS has the highest sensitivity, and is the most used technology used in the biomedical studies of the brain. Yet, 1H-MRS is not widely used in in vivo metabolic studies of glucose because of (a.) overlap of peaks with other intense metabolites for the upfield part of the spectrum and decreased signal intensity due to J-evolution; (b.) the lower intensity of the 5.22ppm α-D-glucose resonance due to α-D-glucose isomer state only accounting for 36% of the total D-glucose while β-D-glucose accounts for 64%; and (c.) imperfect water-suppression. Recently, a novel spectral editing, SLOW-editing, was proposed which was designed for whole brain 1H-MRSI at ultra-high magnetic field (UHF) [3]. In contrast to other MRS-techniques, highly frequency selective SLOW-editing pulses enable the direct in vivo detection of the 5.22ppm downfield α-D-glucose signal.METHODS
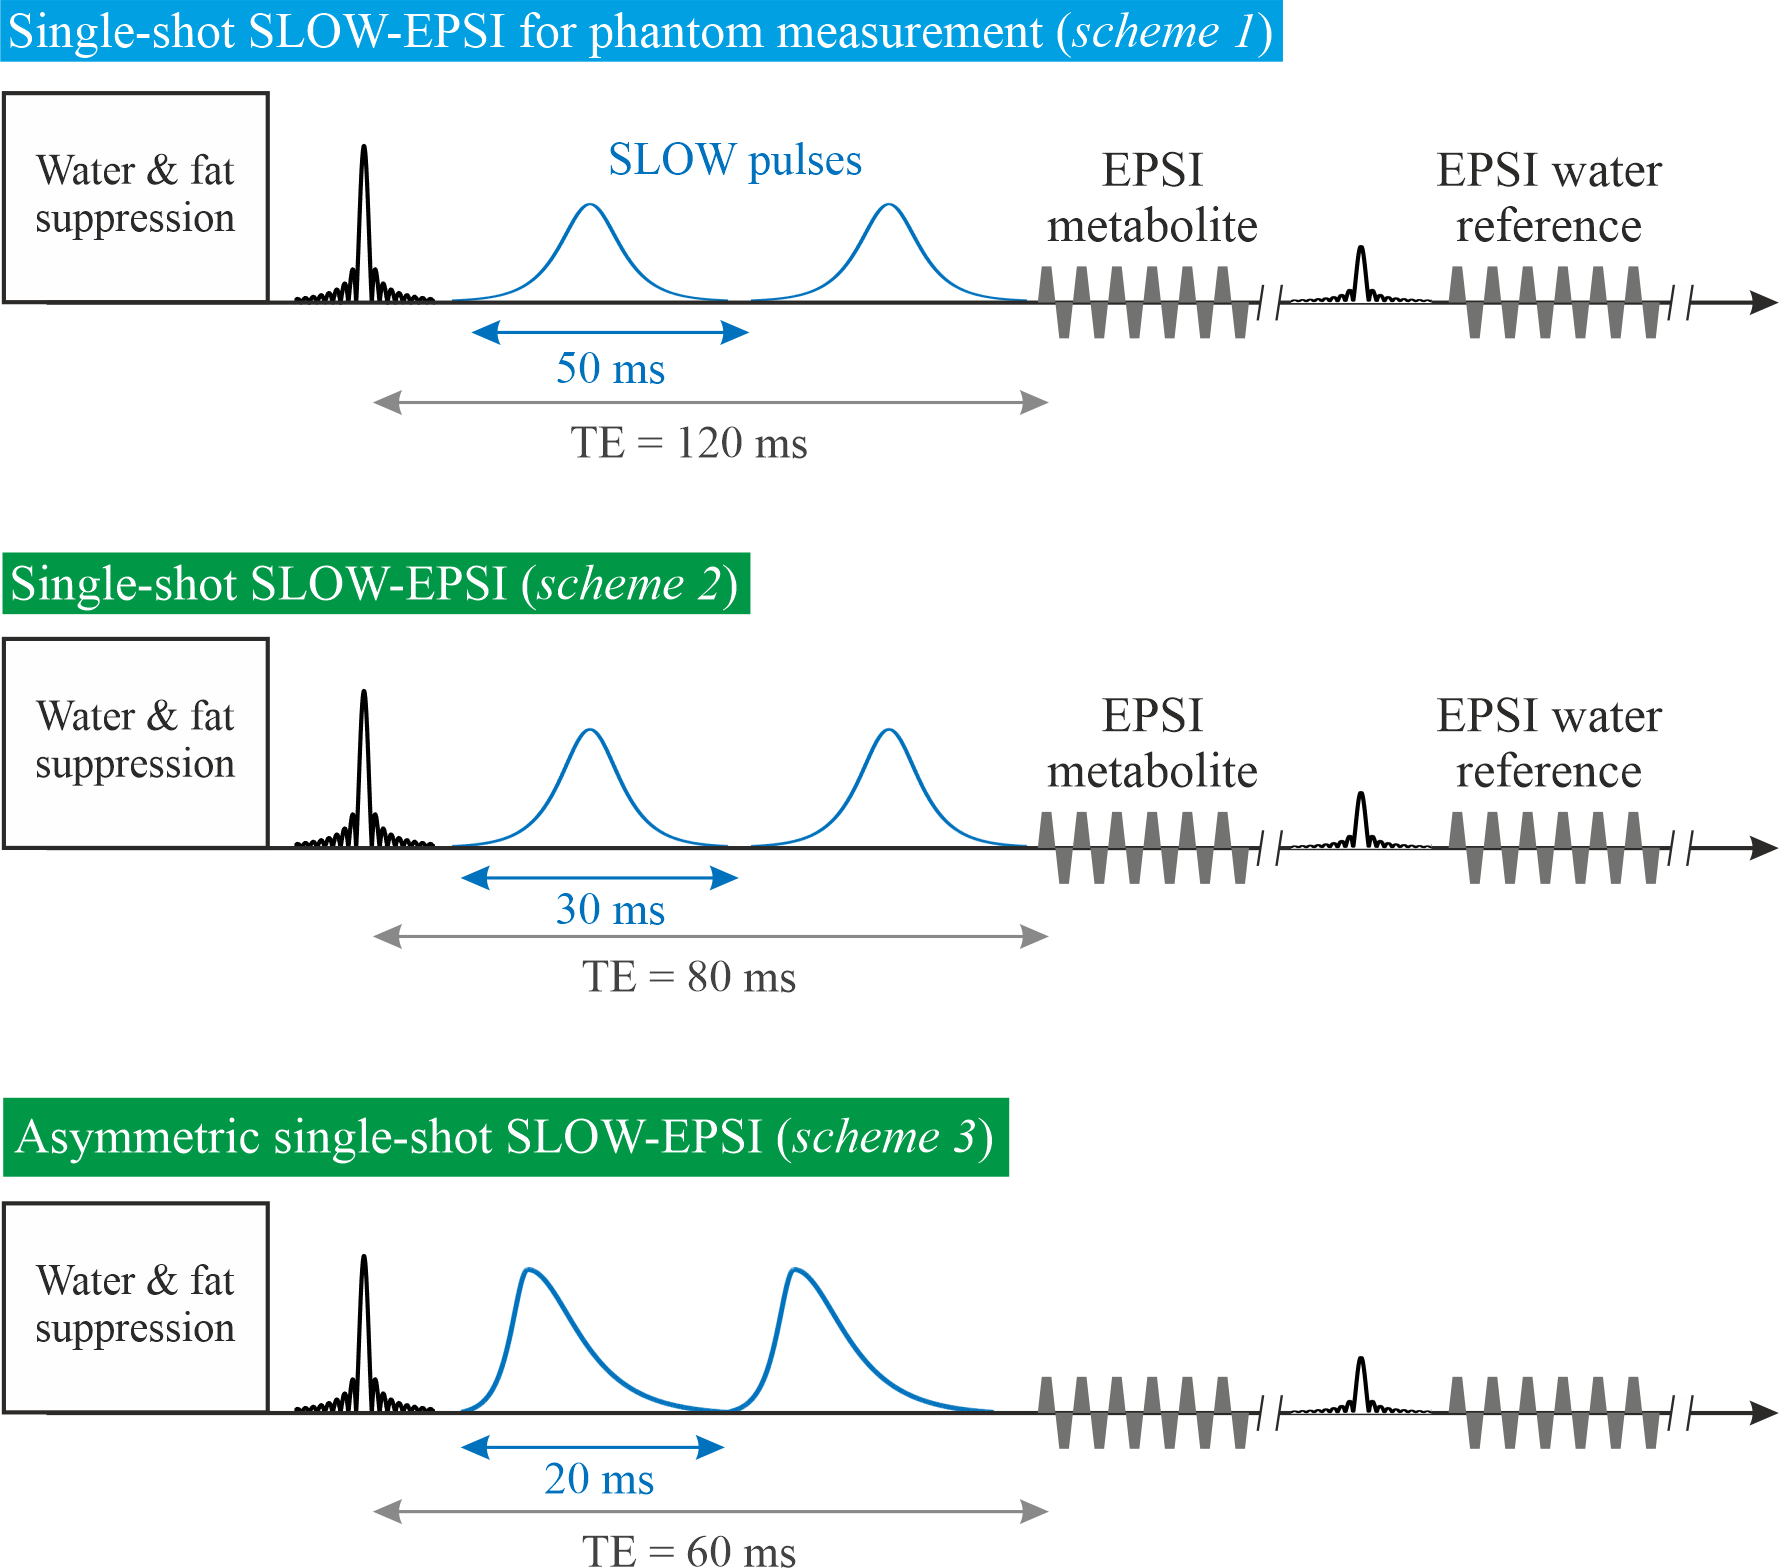
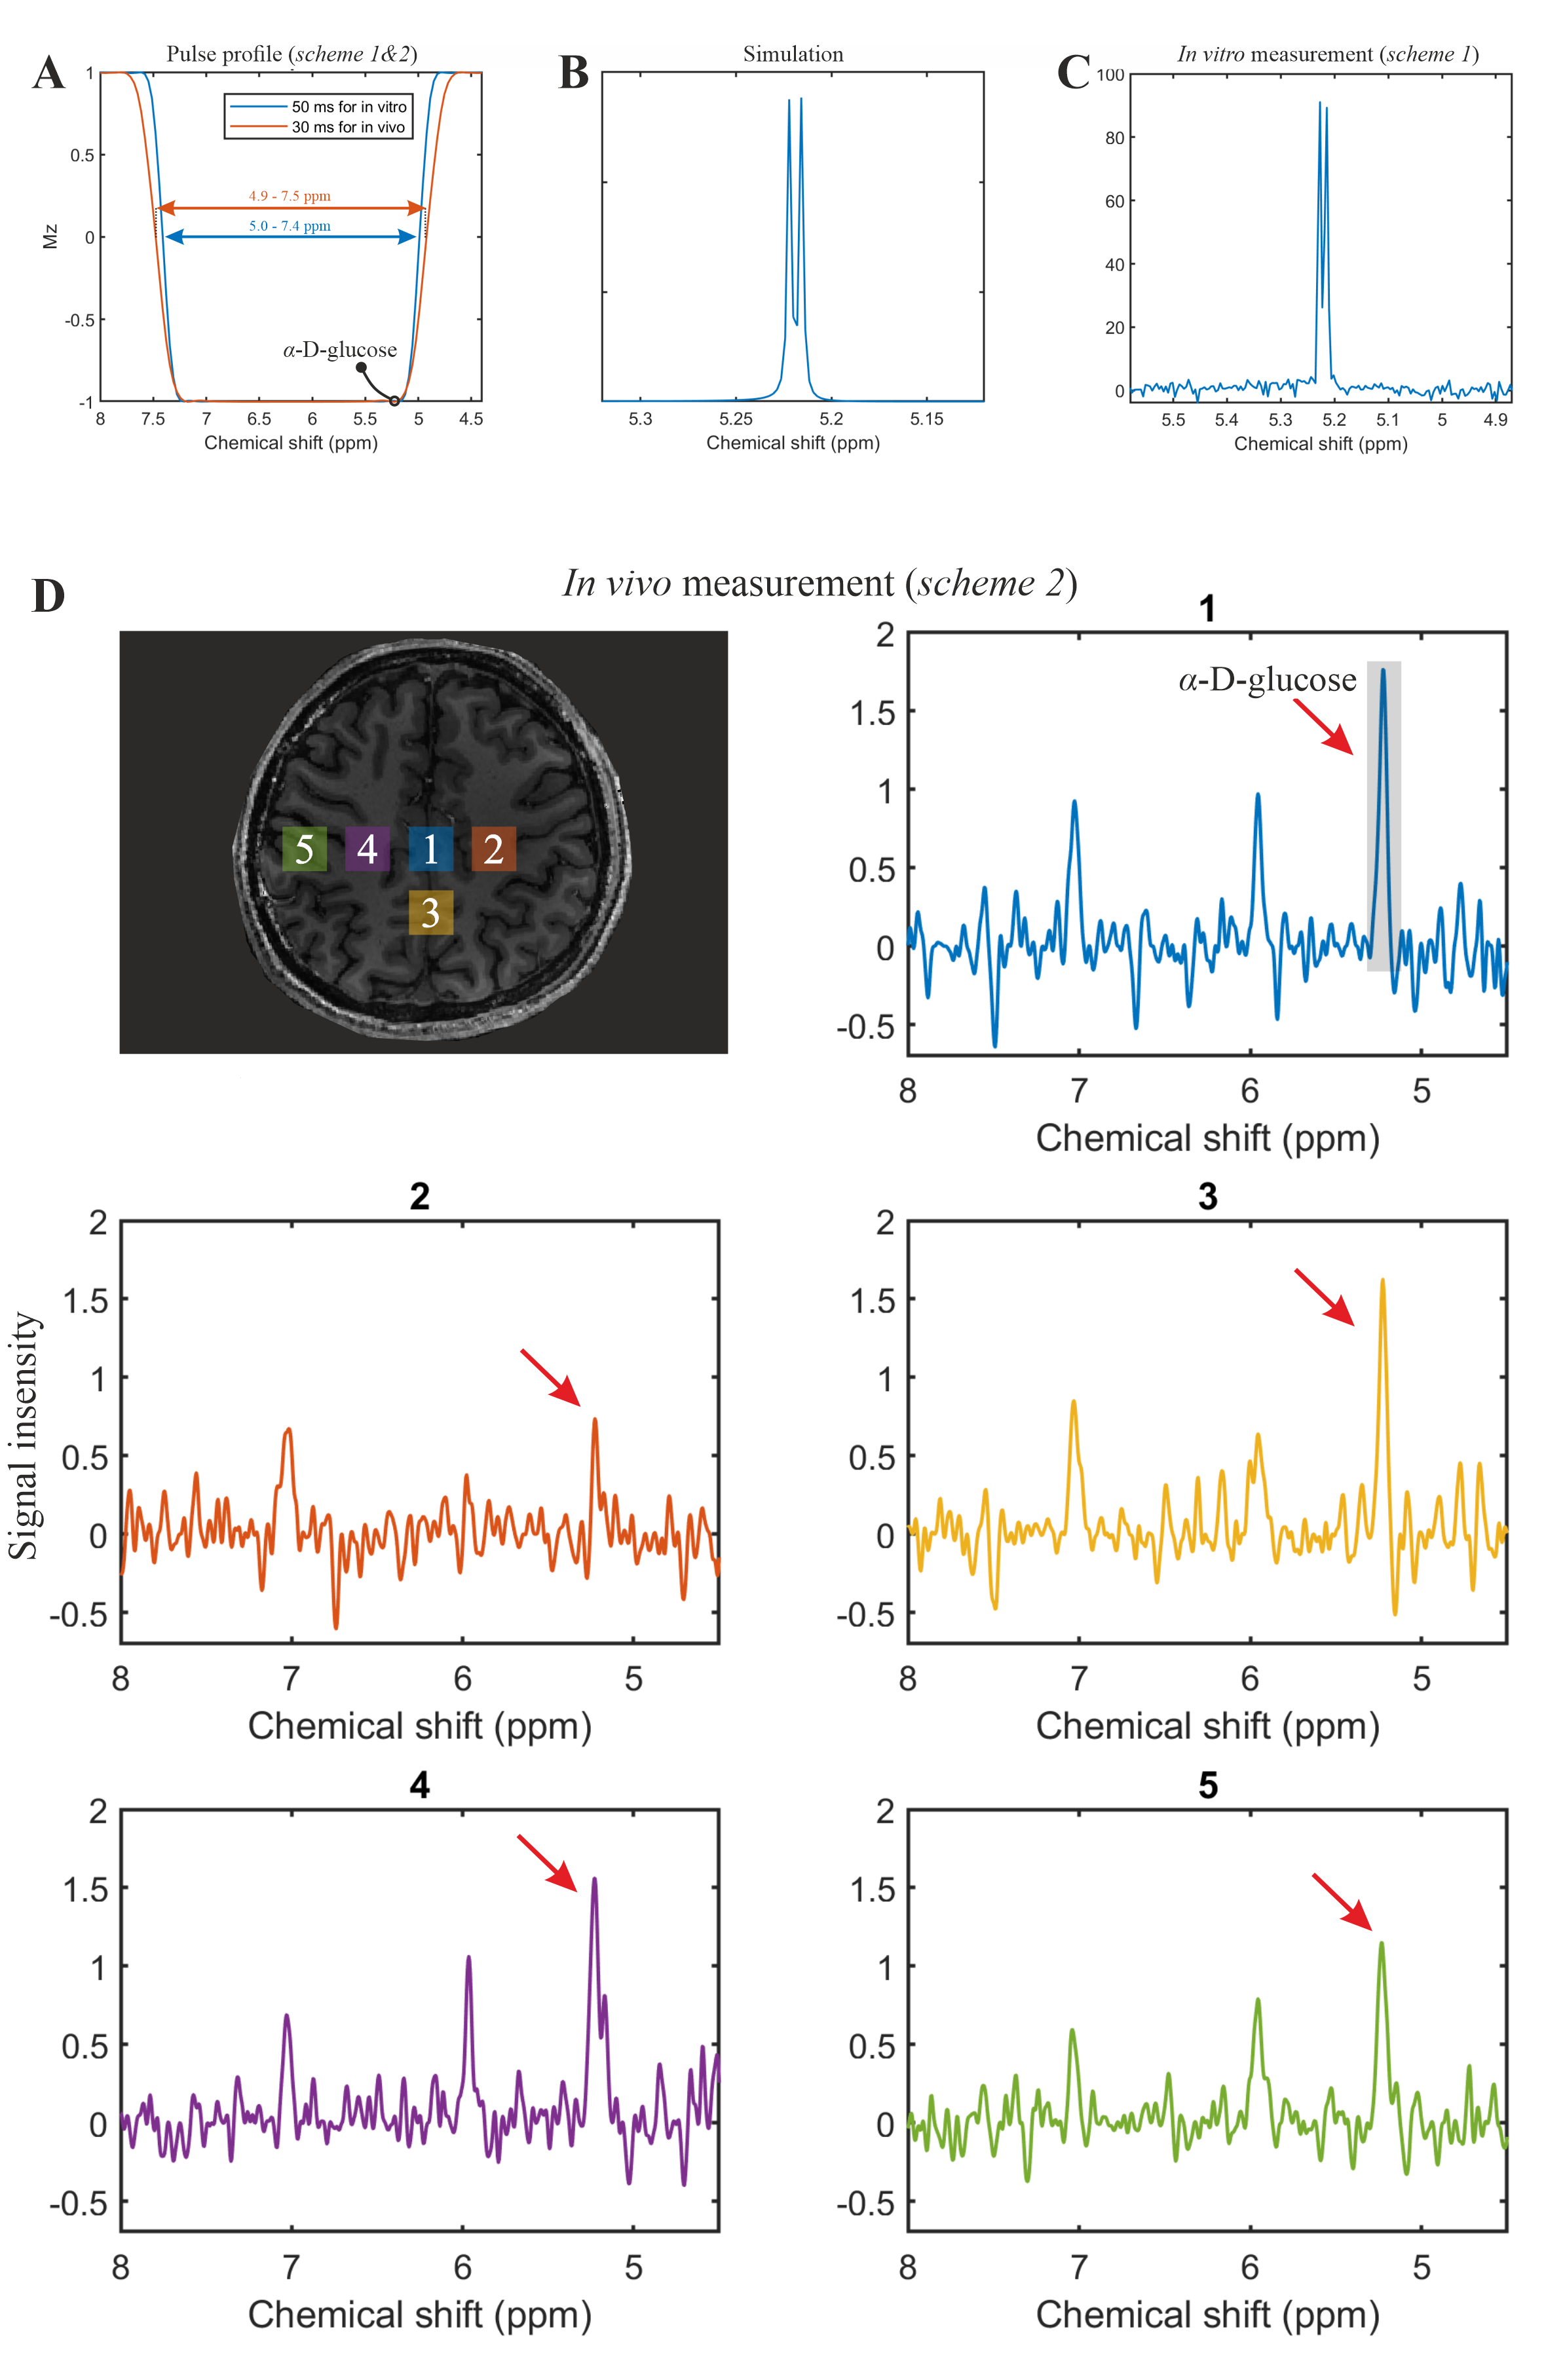
All MRSI was performed on a Siemens 7T-scanner (MAGNETOM Terra, Germany) using the Nova 1Tx32Rx head-coil.Single-shot SLOW-EPSI [3], [4] (Figure 1) was applied on phantom and two healthy subjects. (1) Sequence scheme 1: the bandwidth of the SLOW-pulses ranges from 5.0-7.4ppm and 1.8-4.2ppm for downfield and upfield glucose measurements, respectively. Pulse duration is 50ms, and TE=120ms. (2) Sequence scheme 2: the bandwidth of the SLOW pulses ranges from 4.9-7.5ppm. Pulse duration is 30ms, and TE=80ms. (3) Sequence scheme 3: the bandwidth of the SLOW-pulses ranges from 4.9-7.9ppm. Pulse duration is 20ms, and TE=60ms.
Scheme 2 and 3 were used for in vivo measurements with the following parameters: TR=1500 ms, matrix=65×23×7, FOV=280×180×70mm, resolution=4.3×7.8×10mm, averages=6, and TA=21min.
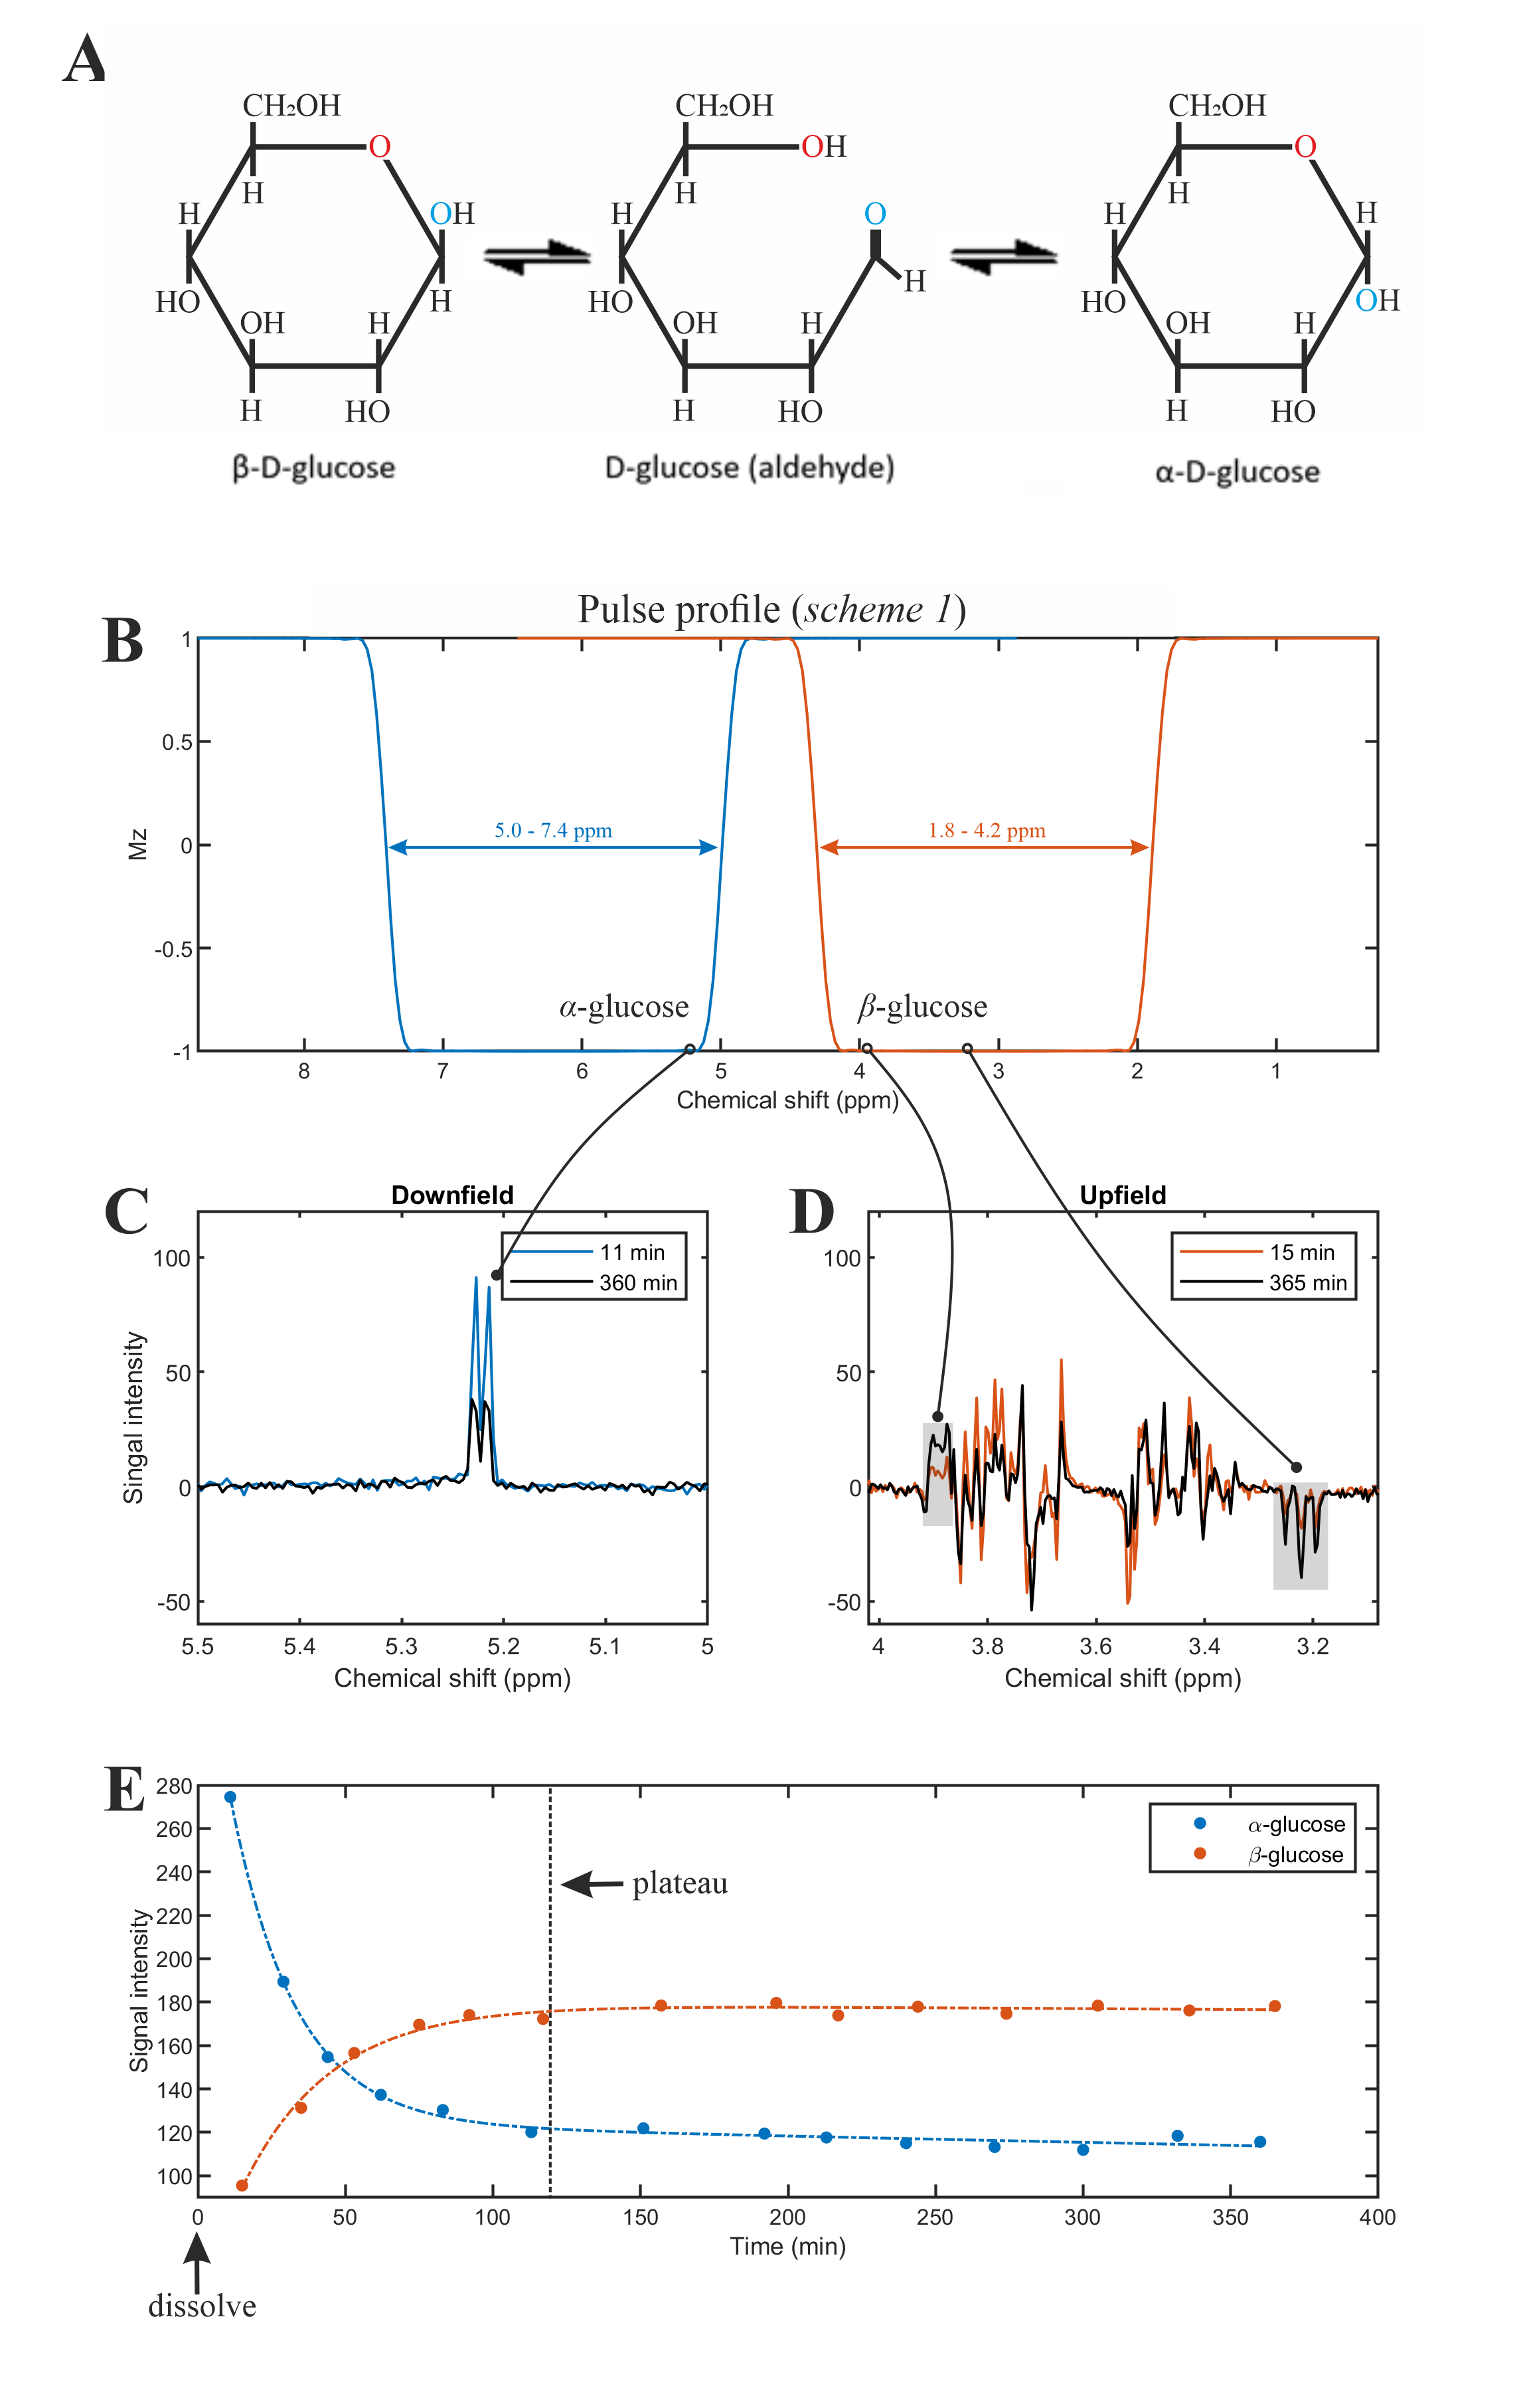
The phantom measurement was performed on a spherical glucose-phantom prepared in-house (~20 mmol/L of α-glucose kept at a constant temperature of at 24°C temperature). To detect the time-evolution of α/β-glucose thermodynamic equilibrium process, a series of measurements were applied once the pure α-glucose powder was dissolved in the phantom for both downfield (5.0–7.4ppm) and upfield (1.8–4.2ppm), shown in Figure 3B.
Subject 1: a healthy, nondiabetic, 30-year-old male. The measurement was performed without fasting period. The measurements comprised single-shot SLOW-EPSI (scheme 2) and T1-weighted MRI (TE=2.06ms, TR=6000 ms, TA=7:16min).
Subject 2: a healthy, nondiabetic, 57-year-old male. The measurements were performed with asymmetric single-shot SLOW-EPSI (scheme 3) and a T1-weighted MRI. The protocol is as follows:
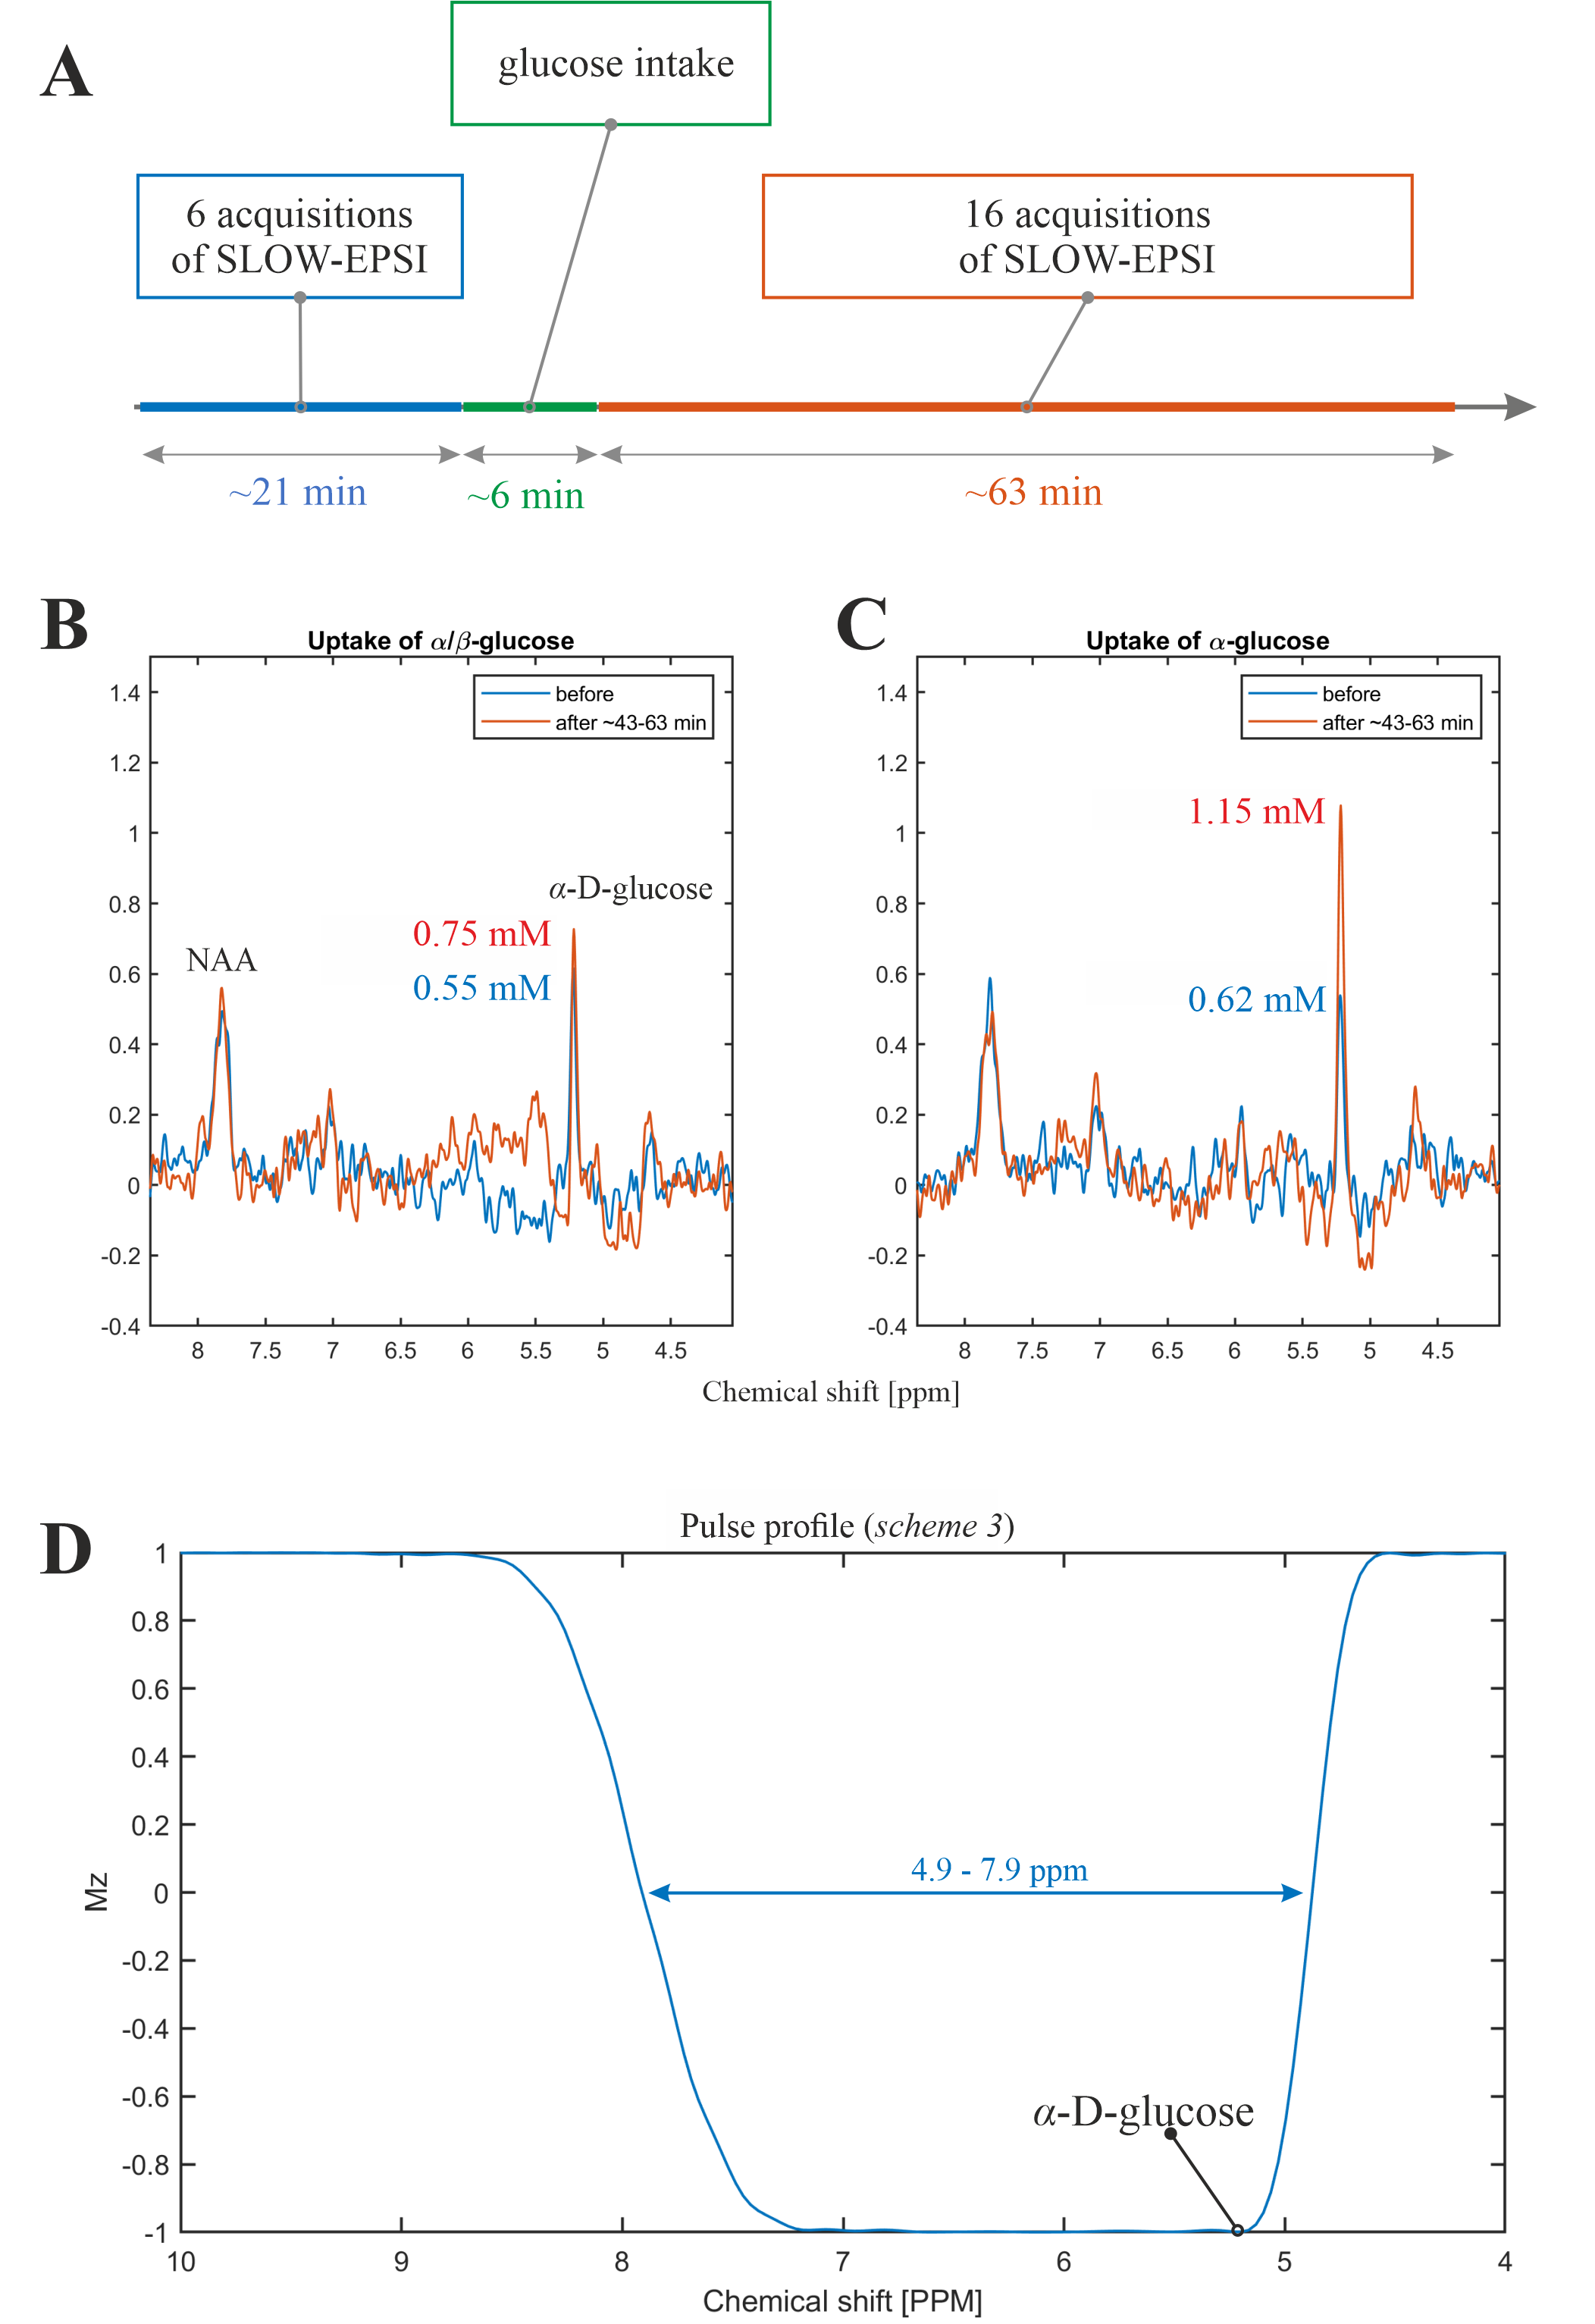
Experiment 1: (i.) Subject 2 fasted for 13 hours before the measurements; (ii.) the baseline SLOW-EPSI MRSI-measurements were performed; (iii.) the patient table of the scanner was moved back to the home position and subject drunk a few minutes before made non-equilibrium α-glucose solution (70g dissolved in 500ml tab water) solution via a flexible polyethylene tube while lying on his back, staying in the head coil; (iv.) SLOW-EPSI-measurements were continued storing every 3-4 minutes one complete dataset. The time schedule of these measurements is displayed in Figure 4A.
Experiment 2. The above-described procedure was repeated on a different day with the same subject drinking an equilibrium α/β-D-glucose solution instead of α-glucose. This solution was prepared 650 minutes before the start of the measurements.
The quantification of α-D-glucose is shown in Figure 5.
RESULTS and DISCUSSION
The phantom measurement of α-glucose at 5.22ppm is consistent with the simulation (Figure 2B-C). The in vivo measurement shows clear α-glucose signal at 5.22ppm (Figure 2D). Mutarotation is the process in which the cyclic α-D-glucose gets first converted to a linear (aldehyde) isomer, and the linear form on its turn is converted into the second cyclic form of glucose namely β-D-glucose (Figure 3A). Figure 3B shows the in vitro measurements of α/β-glucose mutarotation with two different BW-coverages. The α-glucose has a higher signal intensity at 11minutes and a lower one at 360minutes, while the β-glucose signal is lower at 15minutes and higher at 365minutes (Figure 3 C-D). The time-evolution of the α- and β-glucose was obtained by integration of the 5.22ppm and 3.88ppm resonances and showed a reversed pattern and both reached a plateau at approximately 120minutes (Figure 3E). As can be viewed in Figure 4 the first measurement revealed at baseline an estimate α-glucose concentration in the brain of 0.55 mM (a total α- and β-D-glucose of 0.55/0.36=1.53mM) and a maximum value in the time period between ~43-63 minutes after intake of 0.75; i.e., the α-D-glucose concentration increased a factor 1.36 (Figure 4B). The second measurement revealed an α-glucose baseline a value in the brain of 0.62mM (a total α- and β-D-glucose of 0.62/0.36=1.72 mM) was found and a maximum value in the time period between ~43-63minutes after intake of 1.15mM was found meaning an increase by a factor of 1.85 (Figure 4C). The difference between the two α-D-glucose concentration increase factors is due mutarotation-effects.CONCLUSION
To our best knowledge, this is the first report demonstrating that the mutarotation enhancing effect occurring in non-equilibrium α/β-D-glucose solutions can be measured in brain tissue in vivo and can be used to enhance the SNR of the glucose resonance at 5.22ppm. Since crystalline α-D-glucose costs roughly a factor 1000 less than of 18F-fluorodeoxyglucose and 13C- and 2H-enriched glucose, it could be an attractive tracer for in vivo studies of glucose-uptake and metabolism in the brain.Acknowledgements
Supported by the Swiss National Science Foundation (SNSF-182569, and SNSF-207997).References
[1] R. Gruetter et al., “Direct measurement of brain glucose concentrations in humans by 13(C NMR spectroscopy (glucose transport/blood-brain barrier/in vivo NMR/glucose metabolism),” Proc. Nail. Acad. Sci. USA, vol. 89, pp. 1109–1112, 1992.
[2] H. M. de Feyter et al., “Deuterium metabolic imaging (DMI) for MRI-based 3D mapping of metabolism in vivo,” Sci Adv, vol. 4, no. 8, pp. 7314–7336, Aug. 2018, doi: 10.1126/SCIADV.AAT7314.
[3] G. Weng et al., “SLOW: A novel spectral editing method for whole‐brain MRSI at ultra high magnetic field,” Magn Reson Med, vol. 88, no. 1, pp. 53–70, Jul. 2022, doi: 10.1002/mrm.29220.
[4] A. Ebel and A. A. Maudsley, “Improved spectral quality for 3D MR spectroscopic imaging using a high spatial resolution acquisition strategy,” Magn Reson Imaging, vol. 21, no. 2, pp. 113–120, 2003, doi: 10.1016/S0730-725X(02)00645-8.
[5] J. Slotboom et al., “Proton Resonance Spectroscopy Study of the Effects of L-Ornithine-L-Aspartate on the Development of Encephalopathy, Using Localization Pulses with Reduced Specific Absorption Rate,” J Magn Reson B, vol. 105, no. 2, Oct. 1994, doi: 10.1006/jmrb.1994.1114.
[6] Y. Li, “T1 and T2 Metabolite Relaxation Times in Normal Brain at 3T and 7T,” J Mol Imaging Dyn, vol. 02, no. 02, 2013, doi: 10.4172/2155-9937.S1-002.
Figures