0490
Simultaneous concentration and T2 mapping of brain metabolites by multi-echo spectroscopic imaging
Rudy Rizzo1,2, Angeliki Stamatelatou3, Arend Heerschap3, Tom Scheenen3, and Roland Kreis1,2
1Magnetic Resonance Methodology, Institute of Diagnostic and Interventional Neuroradiology, University of Bern, Bern, Switzerland, 2Translational Imaging Center (TIC), Swiss Institute for Translational and Entrepreneurial Medicine, Bern, Switzerland, 3Department of Medical Imaging, Radboud University Medical Center, Nijmegen, Netherlands
1Magnetic Resonance Methodology, Institute of Diagnostic and Interventional Neuroradiology, University of Bern, Bern, Switzerland, 2Translational Imaging Center (TIC), Swiss Institute for Translational and Entrepreneurial Medicine, Bern, Switzerland, 3Department of Medical Imaging, Radboud University Medical Center, Nijmegen, Netherlands
Synopsis
Keywords: Spectroscopy, Data Acquisition, T2-mapping
A multi-parametric MR Spectroscopic Imaging (MRSI) experiment (Multi-Echo Single-Shot MRSI, MESS-MRSI) deploys partially sampled multi-echo trains from single readouts combined with simultaneous multi-parametric model fitting to produce metabolite-specific T2 and concentration maps in 7min. It was tested in-vivo on a cohort of 5 subjects. Cramer-Rao Lower-Bounds (CRLBs) are used as measure of performance. The novel scheme was compared with the (i) traditional Multi-Echo Multi-Shot (MEMS) method and (ii) a truncated version of MEMS, which mimics the MESS acquisition (MESS-mocked). Results extended former findings for single voxel measurements with improvements in CRLB ranging from 17-45% for concentrations and 10-23% for T2s.Introduction
MR Spectroscopic Imaging (MRSI) aims to map spatial distributions of metabolite concentrations, which reflect tissues' biochemistry and provide insight into functionality and pathophysiology.1 Metabolite relaxation rates, which mirror cellular and sub-cellular microenvironments, could hold additional valuable information but are rarely acquired within clinical scan times.2–4 For example, the relaxation times of the neuronal marker NAA reflect the neuronal microenvironment and may operate as an independent marker of neurodegeneration or inflammation.5 So far, there is clear evidence for age-dependence of metabolite relaxation times6 but also altered values in pathologies such as multiple sclerosis,7 Alzheimer's disease,8 and cancer.9,10 Here, we extend a novel single-voxel acquisition scheme that acquires multi-TE data from single readouts twinned to a bi-dimensional fitting process11 to produce metabolite-specific T2 and concentration maps and the related CRLBs within clinical scan time.Methods
A metabolite-cycled 2D-MRSI-sLASER scheme with weighted Cartesian k-space encoding was optimized to acquire three consecutive spin-echoes in one scan (multi-echo single-shot, MESS11): The 1st spin-echo was acquired as an FID, the 2nd and 3rd spin-echoes as partially sampled full echoes, where the last sampling window lasts to achieve an overall 1-second acquisition length. The echo train was generated by extending the sLASER block with two optimized slice-selective Mao π pulses with 1.5-fold slice thickness. Acquisition setup: 16x16 grid, FOV: 200x160 mm2, VOI: 80x60x15 mm3, TR/(TEs) 1600/(35,156,278) ms, SW: 4 kHz, acquired datapoints total/(TEs) 4096/(224/448/3424), 4 weighted acquisitions, 7 min scan time. Measurements were performed on a 3T MR system (Siemens) with a 64-channel head coil.Five healthy volunteers were examined with supraventricular VOI positioning. Next to MESS, we acquired (i) traditional multi-echo multi-shot MRSI sampling of three fully sampled spin-echoes (MEMS, 21min scan time), and (ii) a truncated version of the MEMS acquisition, which mimics the MESS setup (MESS-mocked).
Simultaneous 2D fit ran in FitAID12 with time-domain model and frequency domain χ2-minimization. The half-echo of the shortest TE was fitted with the full-echo recorded for later TEs, including the extended tail of the last echo that provides resolution information for the whole echo train. FID and 2nd echo of MESS were zero-filled to match the 3rd echo. Fit assumptions and prior knowledge:
- Gaussian line-broadening with resulting Voigt-line shape where the Lorentzian component represents T2 contribution;
- basis sets simulated in Vespa, 16 metabolites;
- macromolecular background (MMBG) pattern simulated as the sum of overlapping densely and equally spaced Voigt lines13;
- T2s fitted freely for five major metabolites and MMBG, while T2s linked for all other metabolites;
- tissue concentrations calculated referencing to water with T1 corrections from literature13;
- white (WM), gray (GM) matter, and CSF segmentation to include tissue-specific water relaxation and tissue fraction corrections14;
- CRLBs are taken as measure for achievable precision. To compare equivalent total experimental time, CRLBs of MEMS and MESS-mocked were corrected by $$$\sqrt{3}$$$.
The precision gain (CRLBs) of MESS was tested with statistical inference considering distributions of concentrations and T2s on the cohort of five volunteers. Subsets of WM and GM voxels from the acquired 6x6 VOI grid were selected according to tissue segmentation (fractional volume of parenchymal water of WM or GM > 70%) and grouped across subjects to be used as cohort population.
Results & Discussion
Fig.1 illustrates the acquisition setup, together with MEMS and MESS data, fit, and residues, for voxels in (i) WM and (ii) GM. Short-TE MESS spectra show limited spectral resolution. TE2 and TE3 spectra feature linear phase offsets due to partial-echo acquisitions. The overall quality of the fits is good. Residues are limited and follow a white-noise distribution for MEMS and MESS at TE3. Signal truncation for TE1 and TE2 creates ripples but acceptable residues.Estimated concentrations and T2 values for a subset of metabolites are reported spectrum-by-spectrum throughout the VOI (Fig.2). The evaluation considers fitting on a zero-filled k-space grid with cropped voxels at the edges to minimize partial volume effects (8x8 voxels). Values and trends are comparable. The figure includes fit uncertainties (CRLBs). Precision for concentration and T2 estimates is equivalent or better for MESS (c.f. CRLBs, Fig.2-red).
A comparison of concentration and T2 maps across two volunteers is reported in Fig.3 and Fig.4 for a subset of metabolites. MESS-mocked replicates MEMS adequately, thus signal truncation is found suitable for concentration and T2 mapping. MESS yields maps that overall agree with the 3-fold slower MEMS technique here considered the gold standard for comparison. The distribution of concentrations and T2s between GM and WM is reported in general agreement with the literature.13,15–19
Fig.5 reports a cohort analysis of the methods' precision. MESS yields, on average, a precision increase for concentrations from 17% to 45% and for T2s from 10% to 23%, comparable to single-voxel similar experiments.11 As expected, MESS-mocked shows the lowest precision given signal truncation and 3-fold slower acquisition.
Conclusions
The novel MESS-MRSI approach yields metabolite-specific T2 maps. It provides increased precision or inversely shorter experimental time (3-fold) compared to traditional approaches while achieving comparable accuracy of estimates, extending results from single-voxel experiments.11 This promises to be useful in functional or multi-parametric MRS, where concentrations provide insight into functionality and pathophysiology, and relaxation rates act as additional potential biomarkers of abnormality, mirroring information on the cellular microenvironment.Acknowledgements
This work is supported by the Marie-Sklodowska-Curie Grant #813120 (Inspire-Med) and the Swiss National Science Foundation (#320030-175984).References
- Maudsley, A. A. et al. Advanced magnetic resonance spectroscopic neuroimaging: Experts’ consensus recommendations. NMR Biomed. 34, 1–22 (2021).
- Kreis, R., Slotboom, J., Hofmann, L. & Boesch, C. Integrated data acquisition and processing to determine metabolite contents, relaxation times, and macromolecule baseline in single examinations of individual subjects. Magn. Reson. Med. 54, 761–768 (2005).
- Just I, K. et al. Two-dimensional spectroscopic imaging with combined free induction decay and long-TE acquisition (FID echo spectroscopic imaging, FIDESI) for the detection of intramyocellular lipids in calf muscle at 7 T. NMR Biomed 27, 980–987 (2014).
- An, L., Li, S. & Shen, J. Simultaneous determination of metabolite concentrations, T1 and T2 relaxation times. Magn. Reson. Med. 78, 2072–2081 (2017).
- Kulpanovich, A. & Tal, A. What is the Optimal Schedule for Multiparametric MRS? A Magnetic Resonance Fingerprinting Perspective. NMR Biomed 34, e4196 (2021).
- Kirov, I. I. et al. Age Dependence of Regional Proton Metabolites T2 Relaxation Times in the Human Brain at 3 Tesla. Magn Reson Med 60, 790–795 (2008).
- Kirov, I. I. et al. Brain Metabolite Proton T2 Mapping at 3.0 T in Relapsing-Remitting Multiple Sclerosis. Radiology 254, 858–866 (2010).
- Dumoulin, M., Zimmerman, E., Hurd, R. & Hancu, I. Increased brain metabolite T2 relaxation times in patients with Alzheimer’s disease. in International Society for Magnetic Resonance in Medicine 1179 (2005).
- Isobe, T. et al. Quantification of cerebral metabolites in glioma patients with proton MR spectroscopy using T2 relaxation time correction. Magn Reson. Imaging 20, 343–349 (2002).
- Li, Y. et al. Comparison of T 1 and T 2 metabolite relaxation times in glioma and normal brain at 3 T. J Magn Reson Imaging 28, 342–350 (2008).
- Rizzo, R. & Kreis, R. Multi-Parametric Single-Shot Magnetic Resonance Spectroscopy for Fast Metabolite Specific Concentration and T2 Determination. in International Society for Magnetic Resonance in Medicine 311 (2022).
- Chong, D. G. Q., Kreis, R., Bolliger, C. S., Boesch, C. & Slotboom, J. Two-dimensional linear-combination model fitting of magnetic resonance spectra to define the macromolecule baseline using FiTAID, a Fitting Tool for Arrays of Interrelated Datasets. Magn. Reson. Mater. Physics, Biol. Med. 24, 147–164 (2011).
- Hoefemann, M., Bolliger, C. S., Chong, D. G. Q., van der Veen, J. W. & Kreis, R. Parameterization of metabolite and macromolecule contributions in interrelated MR spectra of human brain using multidimensional modeling. NMR Biomed 33, e4328 (2020).
- Near, J. et al. Preprocessing, analysis and quantification in single-voxel magnetic resonance spectroscopy: experts’ consensus recommendations. NMR Biomed. 34, e4257 (2021).
- De Graaf, R. A. In vivo NMR spectroscopy: Principles and techniques. (John Wiley & Sons, 2019).
- Srinivasan, R. et al. TE-averaged two-dimensional proton spectroscopic imaging of glutamate at 3 T. Neuroimage 30, 1171–1178 (2006).
- Pouwels, P. J. W. & Frahm, J. Differential distribution of NAA and NAAG in human brain as determined by quantitative localized proton MRS. NMR Biomed. 10, 73–78 (1997).
- Wyss, P. O. et al. In vivo estimation of transverse relaxation time constant (T2) of 17 human brain metabolites at 3T. Magn. Reson. Med. 80, 452–461 (2018).
- Traber, F., Block, W., Lamerichs, R., Gieseke, J. & Schild, H. H. 1H metabolite relaxation times at 3.0 tesla: Measurements of T1 and T2 values in normal brain and determination of regional differences in transverse relaxation. J Magn Reson Imaging 19, 537–545 (2004).
Figures
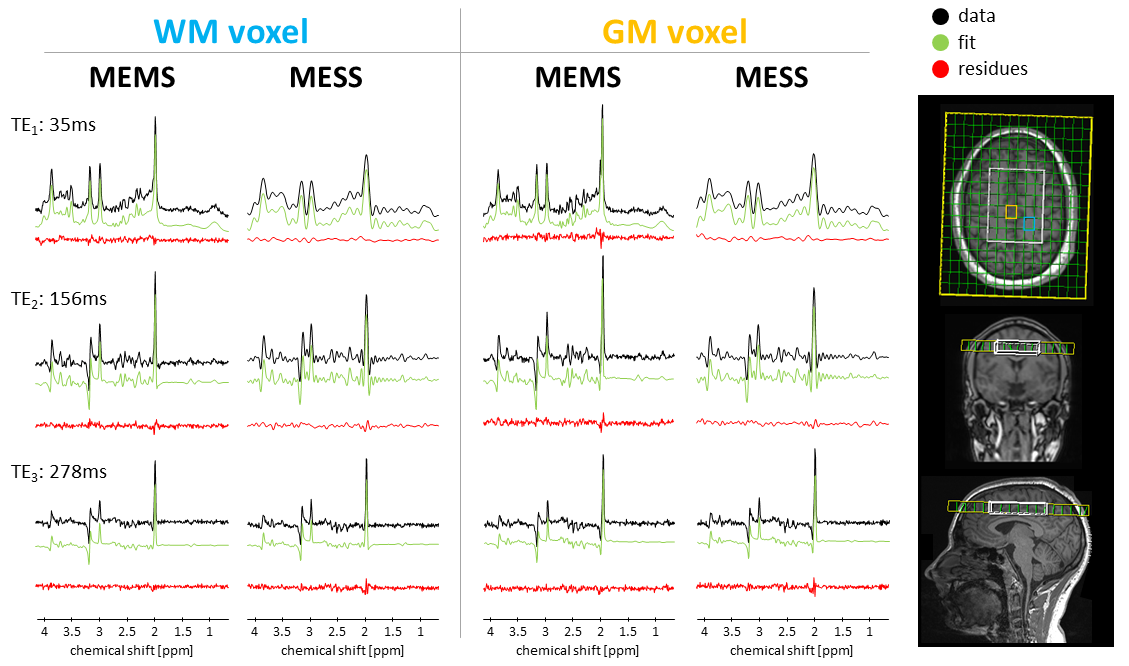
Fig.1: Acquired data (black), fitted model (green),
and residues (red) for one volunteer. MEMS and MESS acquisition are reported
for two voxels, one in prevalent WM tissue (blue) and the other in prevalent GM
tissue (orange). The acquisition setup displays the MRSI FOV (green), and VOI
(white) overlapped to a T1w-MPRAGE anatomical reference.
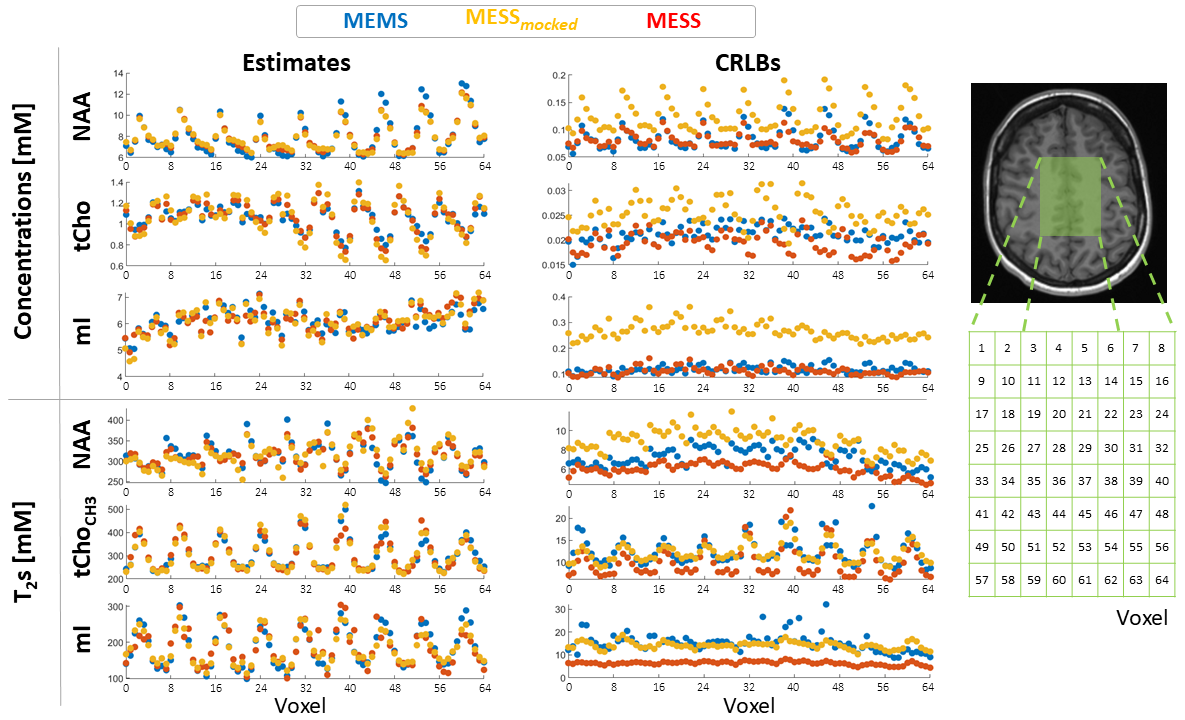
Fig2.: Estimates and uncertainties (CRLBs) for tissue concentrations (NAA: N-acetylaspartate, tCho: total choline and mI: myo-inositol) and T2s (NAA: N-acetylaspartate-singlet at 2ppm, tCho-CH3:
tCho singlet at 3.2ppm and mI: myo-inositol). Estimates from MEMS (blue),
MESS-mocked (orange), and MESS (red) overlap nicely, and their oscillation
throughout the VOI reflects WM and GM variation. CRLBs report higher precision
for MESS. (Right) Voxel numbering referenced to the VOI.
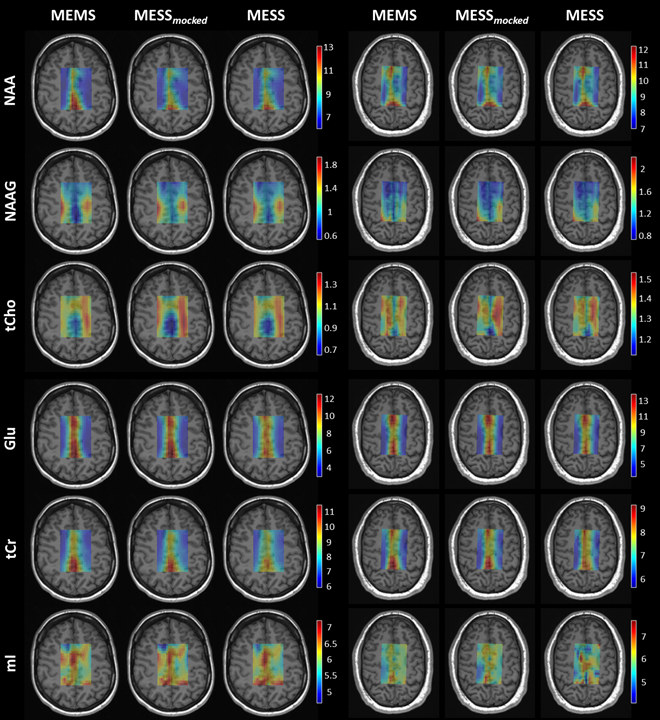
Fig.3: Concentration
maps in milli-molar units [mM] for a subset of metabolites displayed for two
subjects and the three methods (MEMS, MESS-mocked, and MESS). NAA: N-acetylaspartate, NAAG: N-acetylaspartylglutamate, tCho: total choline, Glu: glutamate, tCr: total creatine,
and mI: myo-inositol. Maps
are displayed with zero-filling
in spatial domain with cropped voxels at the edges (20x20 voxels).
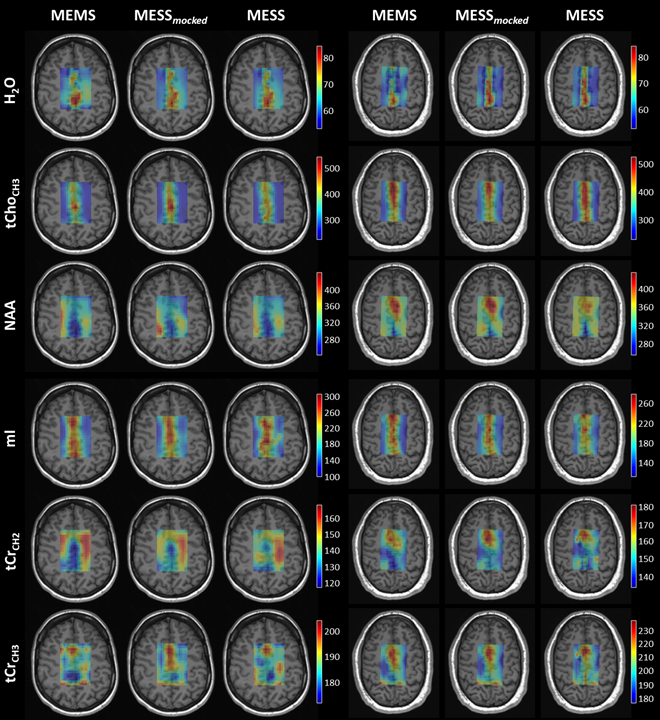
Fig.4: T2 maps in millisecond units
[ms] of parenchymal water and a subset of metabolites, reported for two
subjects and the three methodologies. H2O: parenchymal water, tCho-CH3: total choline singlet at
3.2ppm, NAA: N-acetylaspartate singlet at 2ppm, mI: myo-Inositol, tCr-CH2:
total creatine methylene resonance at 3.9ppm and tCr-CH3: tCr methyl resonance
at 3ppm. Maps
are displayed with zero-filling
in spatial domain with cropped voxels at the edges (20x20 voxels).
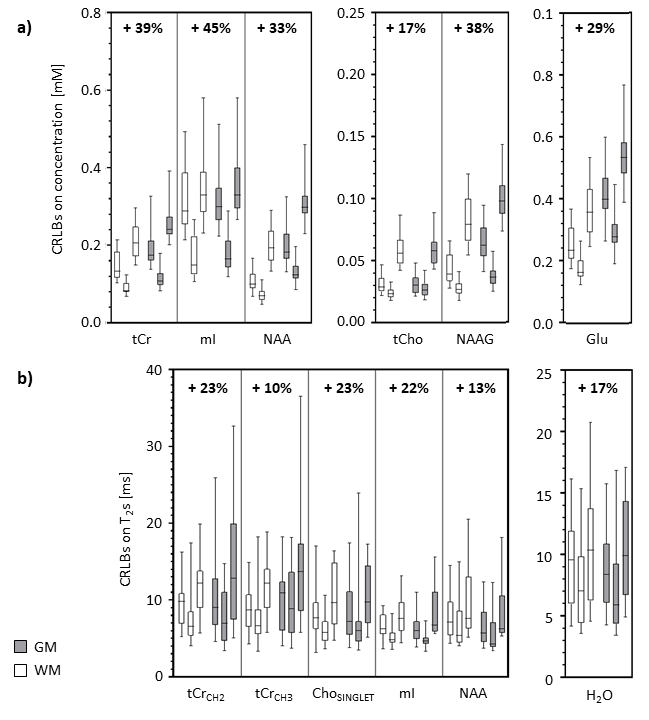
Fig.5: Comparison of methods' precision across the cohort of volunteers/voxels.
Boxplots display the distributions for white (WM) and gray (GM) matter voxels
for CRLBs of a) concentrations and b) T2s. Results are reported
for metabolite subsets, such as in Fig.3 and Fig.4. Methodologies are compared for
each metabolite in three candles: MEMS, MESS, and MESS-mocked from left to
right. The gain in precision of MESS vs. MEMS as averaged across the cohorts
and tissue type is reported numerically on top.
DOI: https://doi.org/10.58530/2023/0490