0485
Age-related differences in dynamic cerebrovascular reactivity based on CO2-response modelling1School of Life Sciences, University of Nottingham, Nottingham, United Kingdom, 2Research, Rotman Research Institute, Toronto, ON, Canada, 3Research, Baycrest Health Sciences Centre, Toronto, ON, Canada, 4Department of Medical Biophysics, University of Toronto, Toronto, ON, Canada, 5Institute of Biomedical Engineering, University of Toronto, Toronto, ON, Canada
Synopsis
Keywords: Data Analysis, Neuroscience, blood vessels, cerebrovascular reactivity, deconvolution Secondary category: contrast mechanism
Cerebrovascular Reactivity (CVR) was measured in healthy, young and older adults. Specifically, dynamic CVR (dCVR) was measured as the carbon dioxide (CO2)-response function. This was estimated by deconvolving a sinusoidal hypercapnic time course from simultaneously acquired blood oxygen level dependent (BOLD) fMRI data using a canonical-correlation (CCA) based approach. The results demonstrate differences in dCVR amplitude and rise time between age groups. This proof-of-concept study establishes the feasibility of dCVR modelling for the study of aging.INTRODUCTION
Cerebrovascular reactivity (CVR) can become altered as part of the normal aging process, but thus far, there are few studies to map quantitative CVR differences between age groups[1]. Manipulation of inspired carbon dioxide (CO2) coupled with blood oxygen level dependent (BOLD) fMRI measurements have long been used for mapping the amplitude of CVR. However, the sensitivity of CVR amplitude to age and related effects can be limited[2]. Recently, it has become of interest to map dynamic CVR (dCVR), that is, the response timing in addition to the amplitude of CVR[3,4,5]. This study aims to demonstrate the feasibility of dCVR modelling using a novel canonical-correlation (CCA) based approach[6] to assess age-related differences in dCVR.METHODS
Participants: Young (N=18, F=10 aged 18-43, mean±standard deviation 26.3±6.5) and older healthy adults (N=9, F=5, aged 67-85, 72.6±5.7) were recruited following local ethics approval.Tasks: The sinusoidal CO2 challenge[7] used computer-controlled, targeted gas delivery to the end tidal CO2 pressure (PETCO2)[8] ±4mmHg the participants normocapnia (natural) baseline (RespirAct™, Thornhill Research, Toronto, Canada) sinusoidally. This involved 60s baseline followed by three rounds of 120s of sinusoid for a total of 420s (see Fig.1).
Imaging: Participants were scanned using a 3T Prisma scanner (Siemans, Erlangen, Germany) using the vendors 32-channel receive coil for a 3D MPRAGE T1-weighted anatomical scan (1x1x1mm) for registration, and a dual-echo pCASL (DE-pCASL) sequence that allowed simultaneous acquisition of blood oxygenation level dependent (BOLD) and cerebral-blood flow data (DE-pCASL, dual echo pseudocontinuous arterial labelling), (FOV = 220mm2, 3.4x3.4x5.00mm3 matrix, 18 slices, TR=4s TE=10/25ms, BW=2520Hz/px, post label delay (PLD)=1000ms, label duration=1500ms)[9].
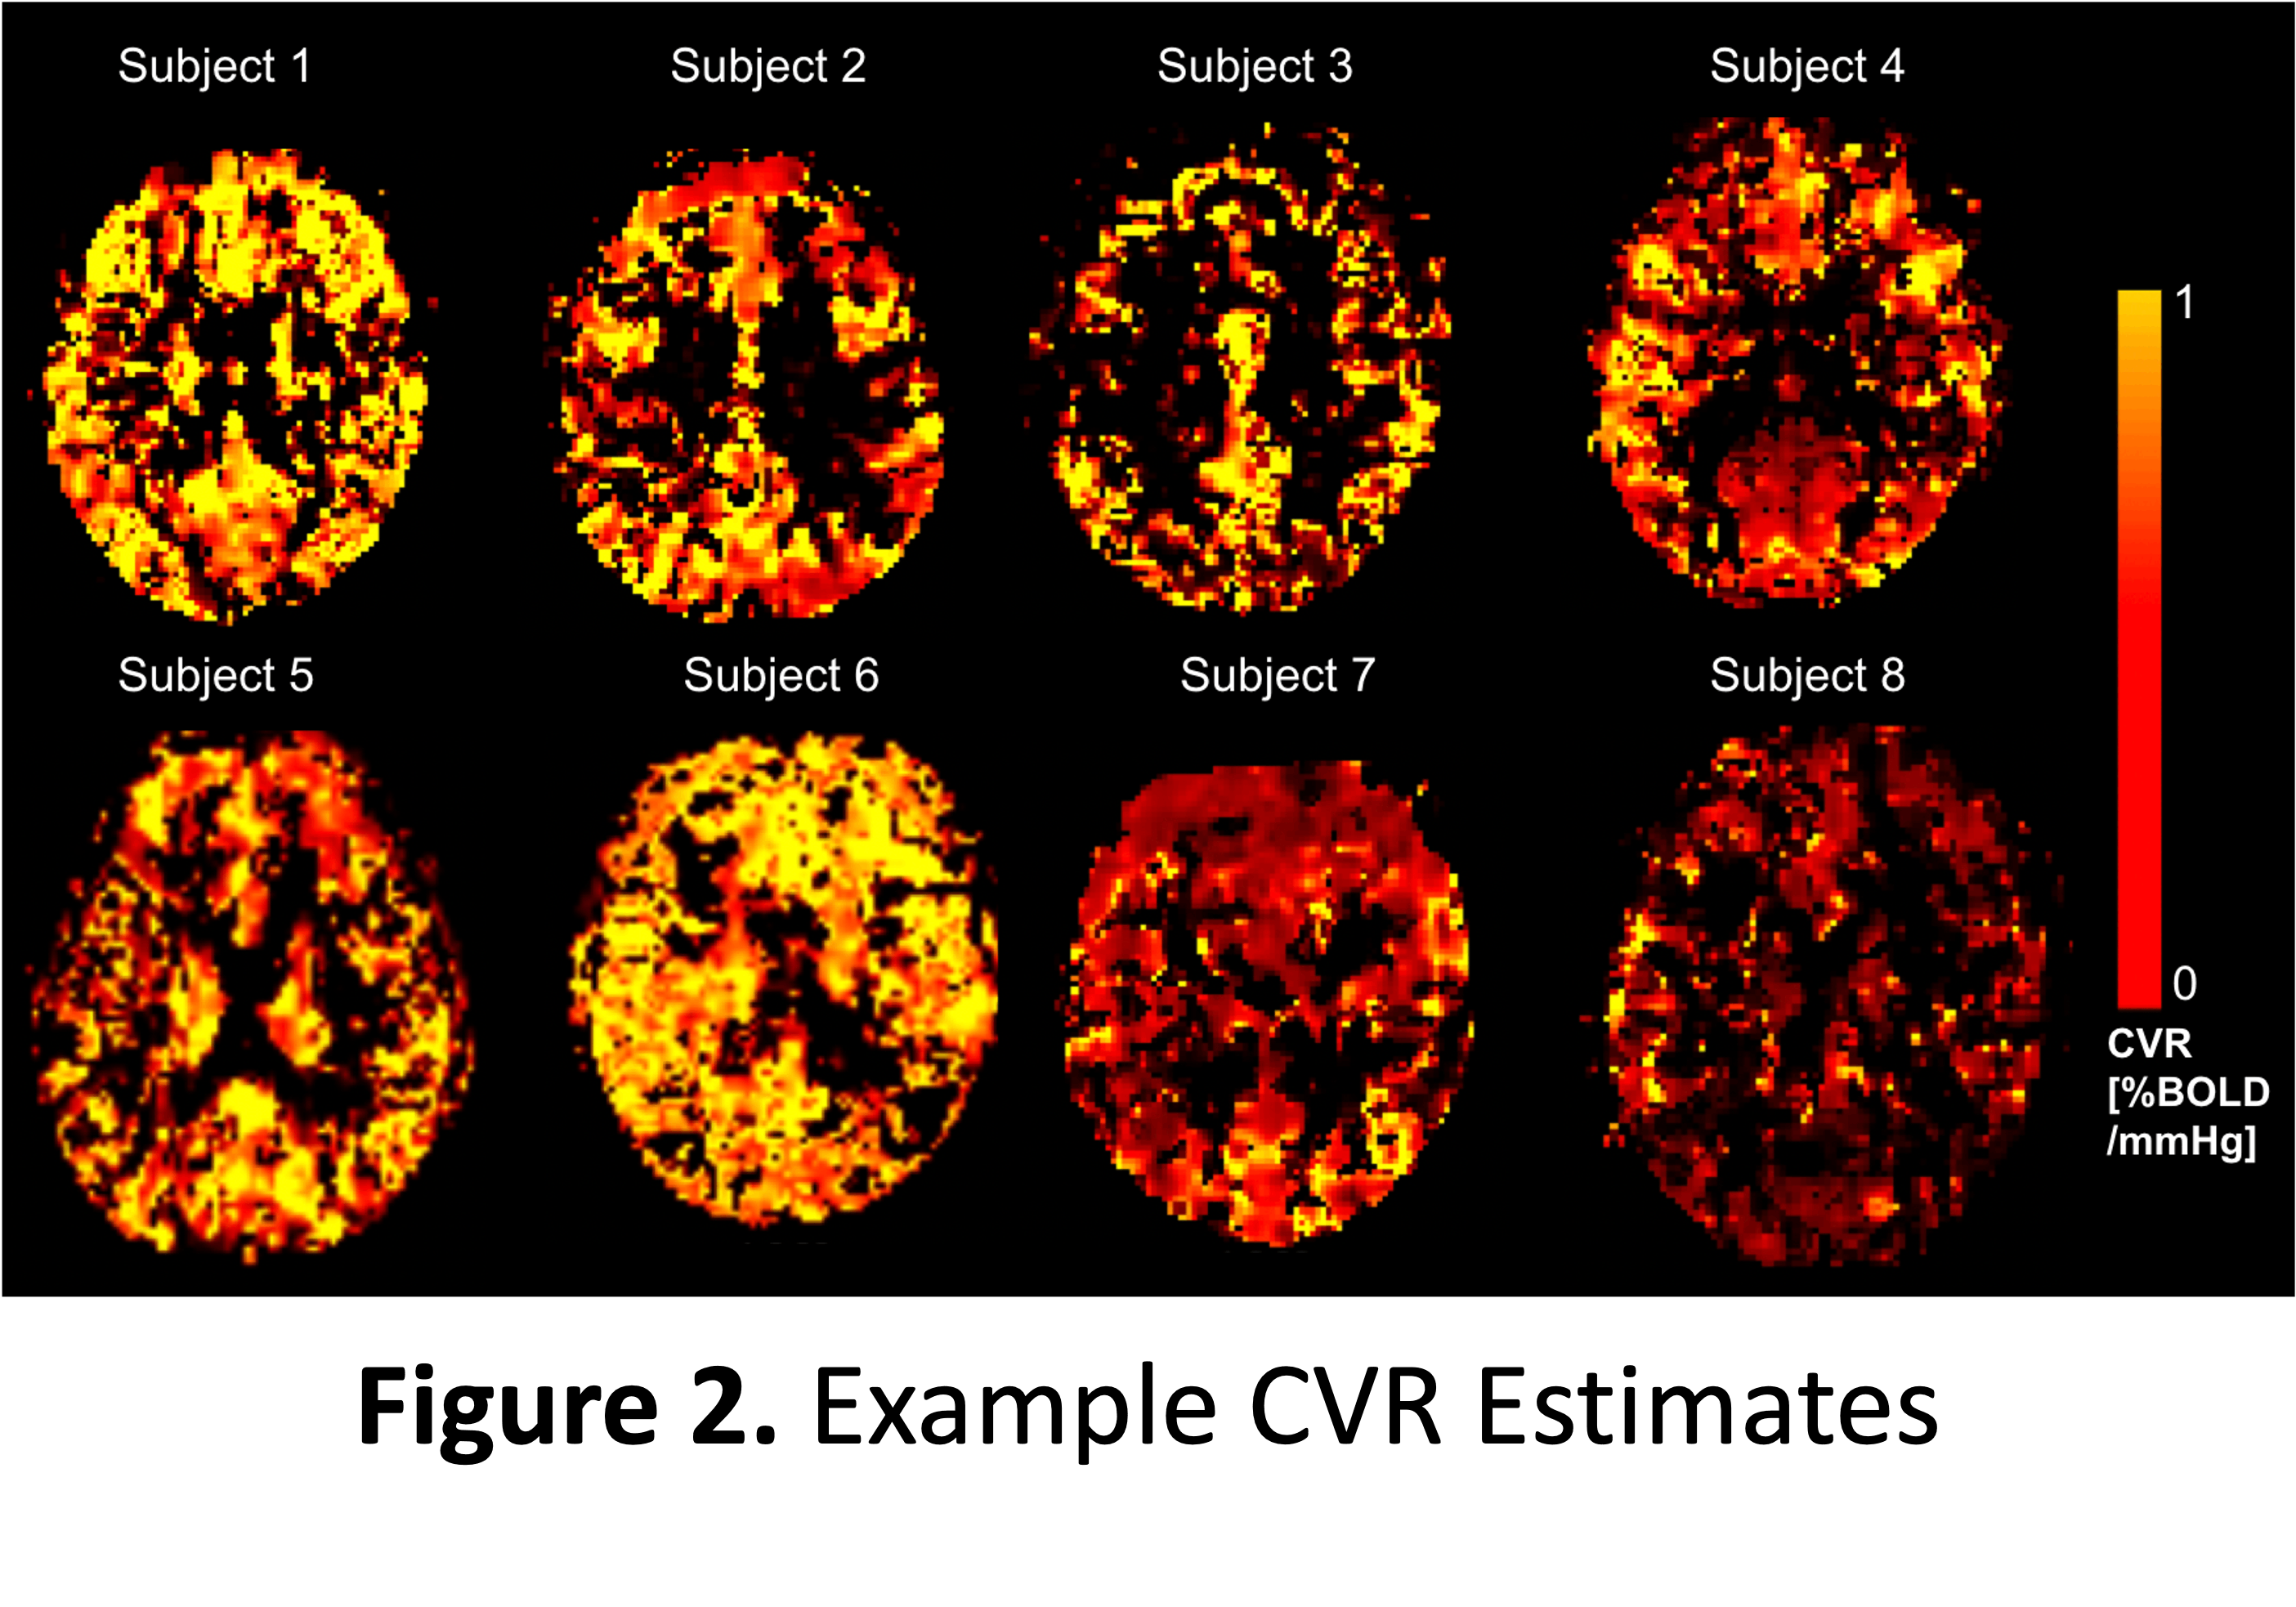
Analysis: Using in-house scripts (MATLAB, Mathworks, Natick, MA) that implemented FSL[10] and FreeSurfer (The General Hospital Corporation, Boston MA, USA), grey matter regions of interest (ROIs) were extracted. This also involved spatial transforms in MNI space, smoothing (6mm FWHM Gaussian kernel) and segmentation of T1-weighted structural into grey and white matter. Additionally, CCA was used to deconvolute the HRF values from the BOLD data The CCA algorithm used a gamma basis in the temporal dimension to prioritise temporal features in the data (info on the algorithm[5,11]). CCA finds the best linear combinations of two sets of multidimensional variables to maximise the correlation between the resulting basis vectors, allowing it to better deconvolute HRF values from noisy data than conventional methods[12]. The BOLD timecourse values were each aligned with the participants individual PETCO2 timecourse for maximal correlation. The CO2 response function (in units of [%BOLD/mmHg/sec]) was estimated for each voxel of each subject. From these estimates, we derived the CVR amplitude (as the area of the CO2 response function) and the rise time (as the time taken for the response function to reach ½ of its peak). Both parameters were mapped and transformed into MNI152 space using FSL flirt.
All subject data were processed using the AAL atlas[13]. Students t-tests were used to compare CVR amplitude and rise time between young and old groups.
RESULTS
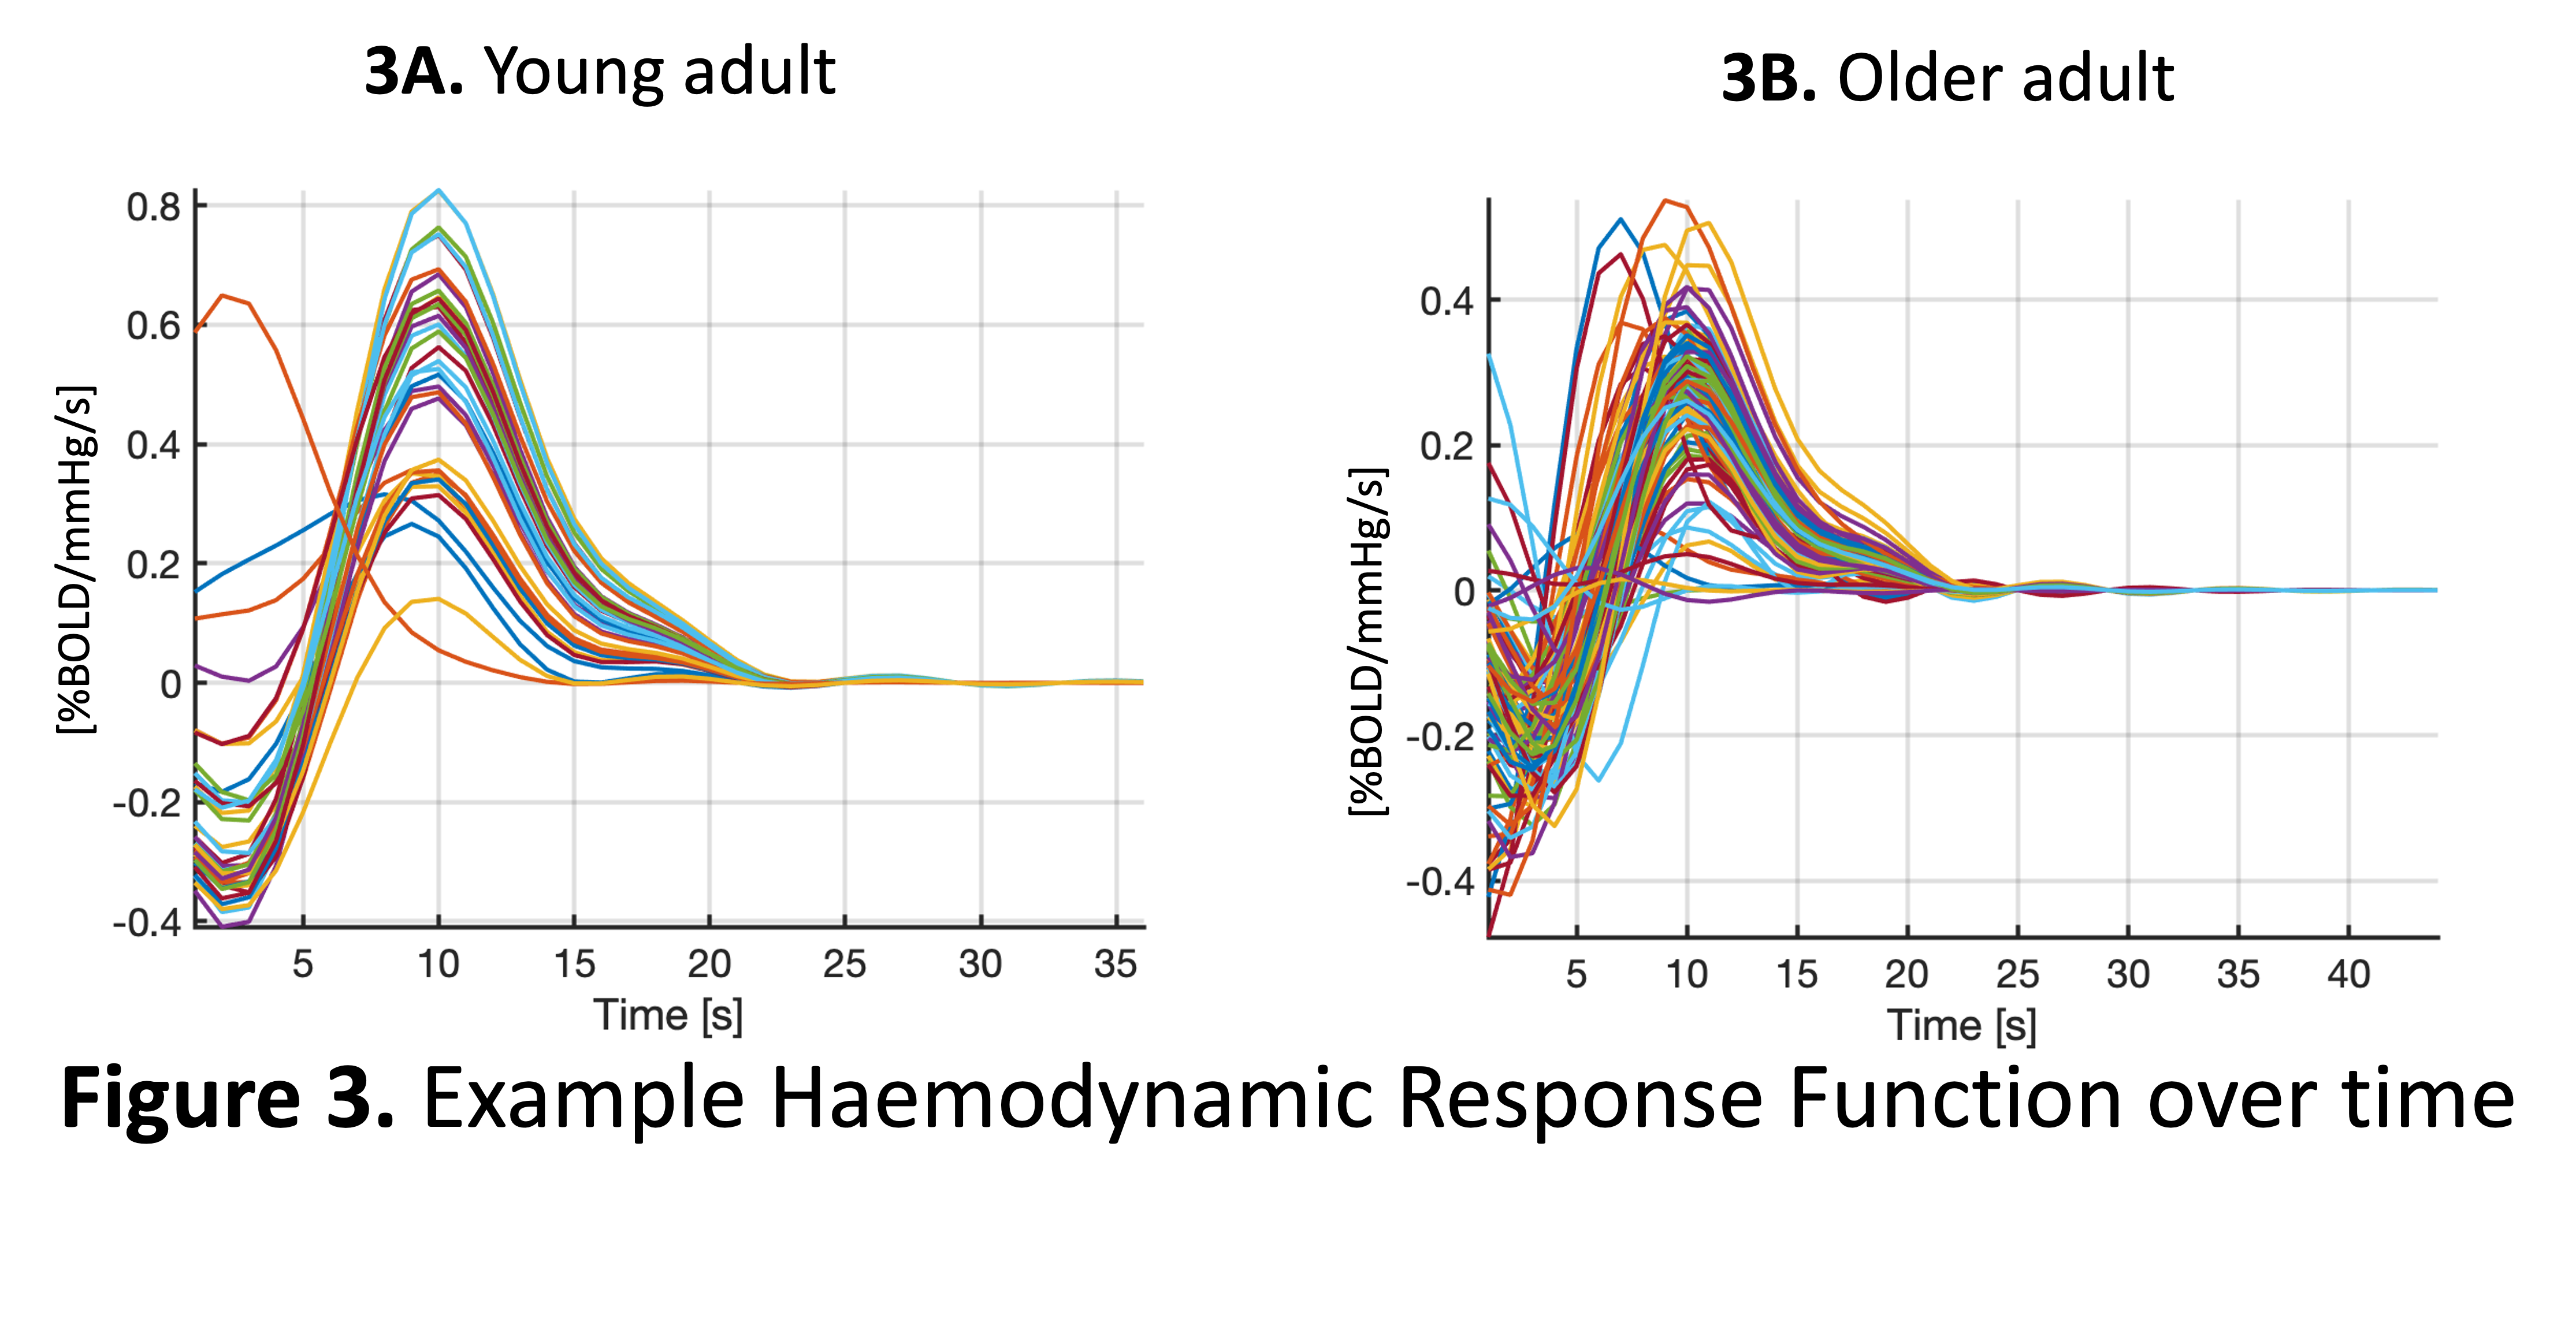
Figure 1A shows the experimental set up that involves a sinusoidal modulation of PETCO2 and an example bold signal output from the algorithm (1B).Figure 3 shows the haemodynamic response function plots for the 26 brain regions of interest for a young adult (3A) were less varied than for the older adult (3B).
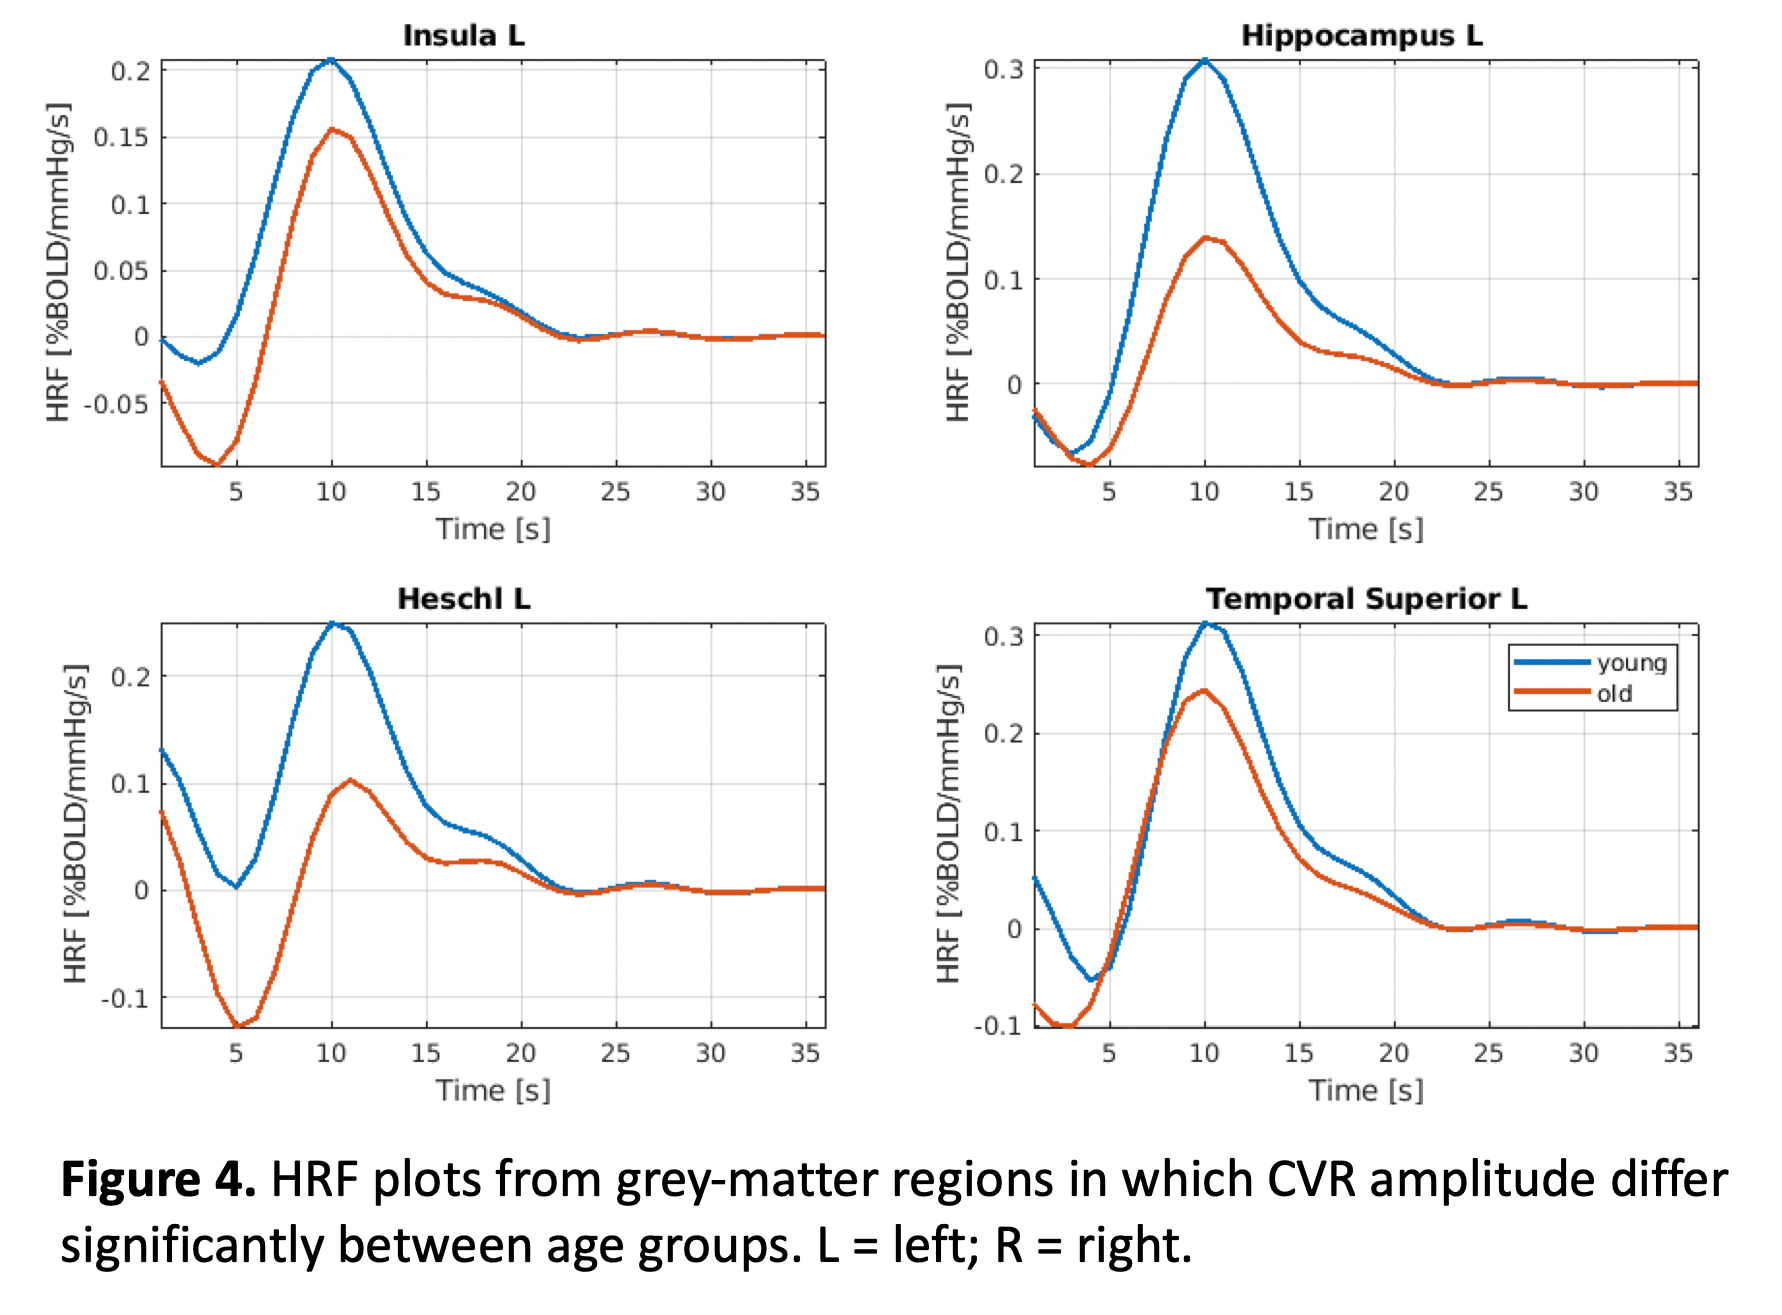
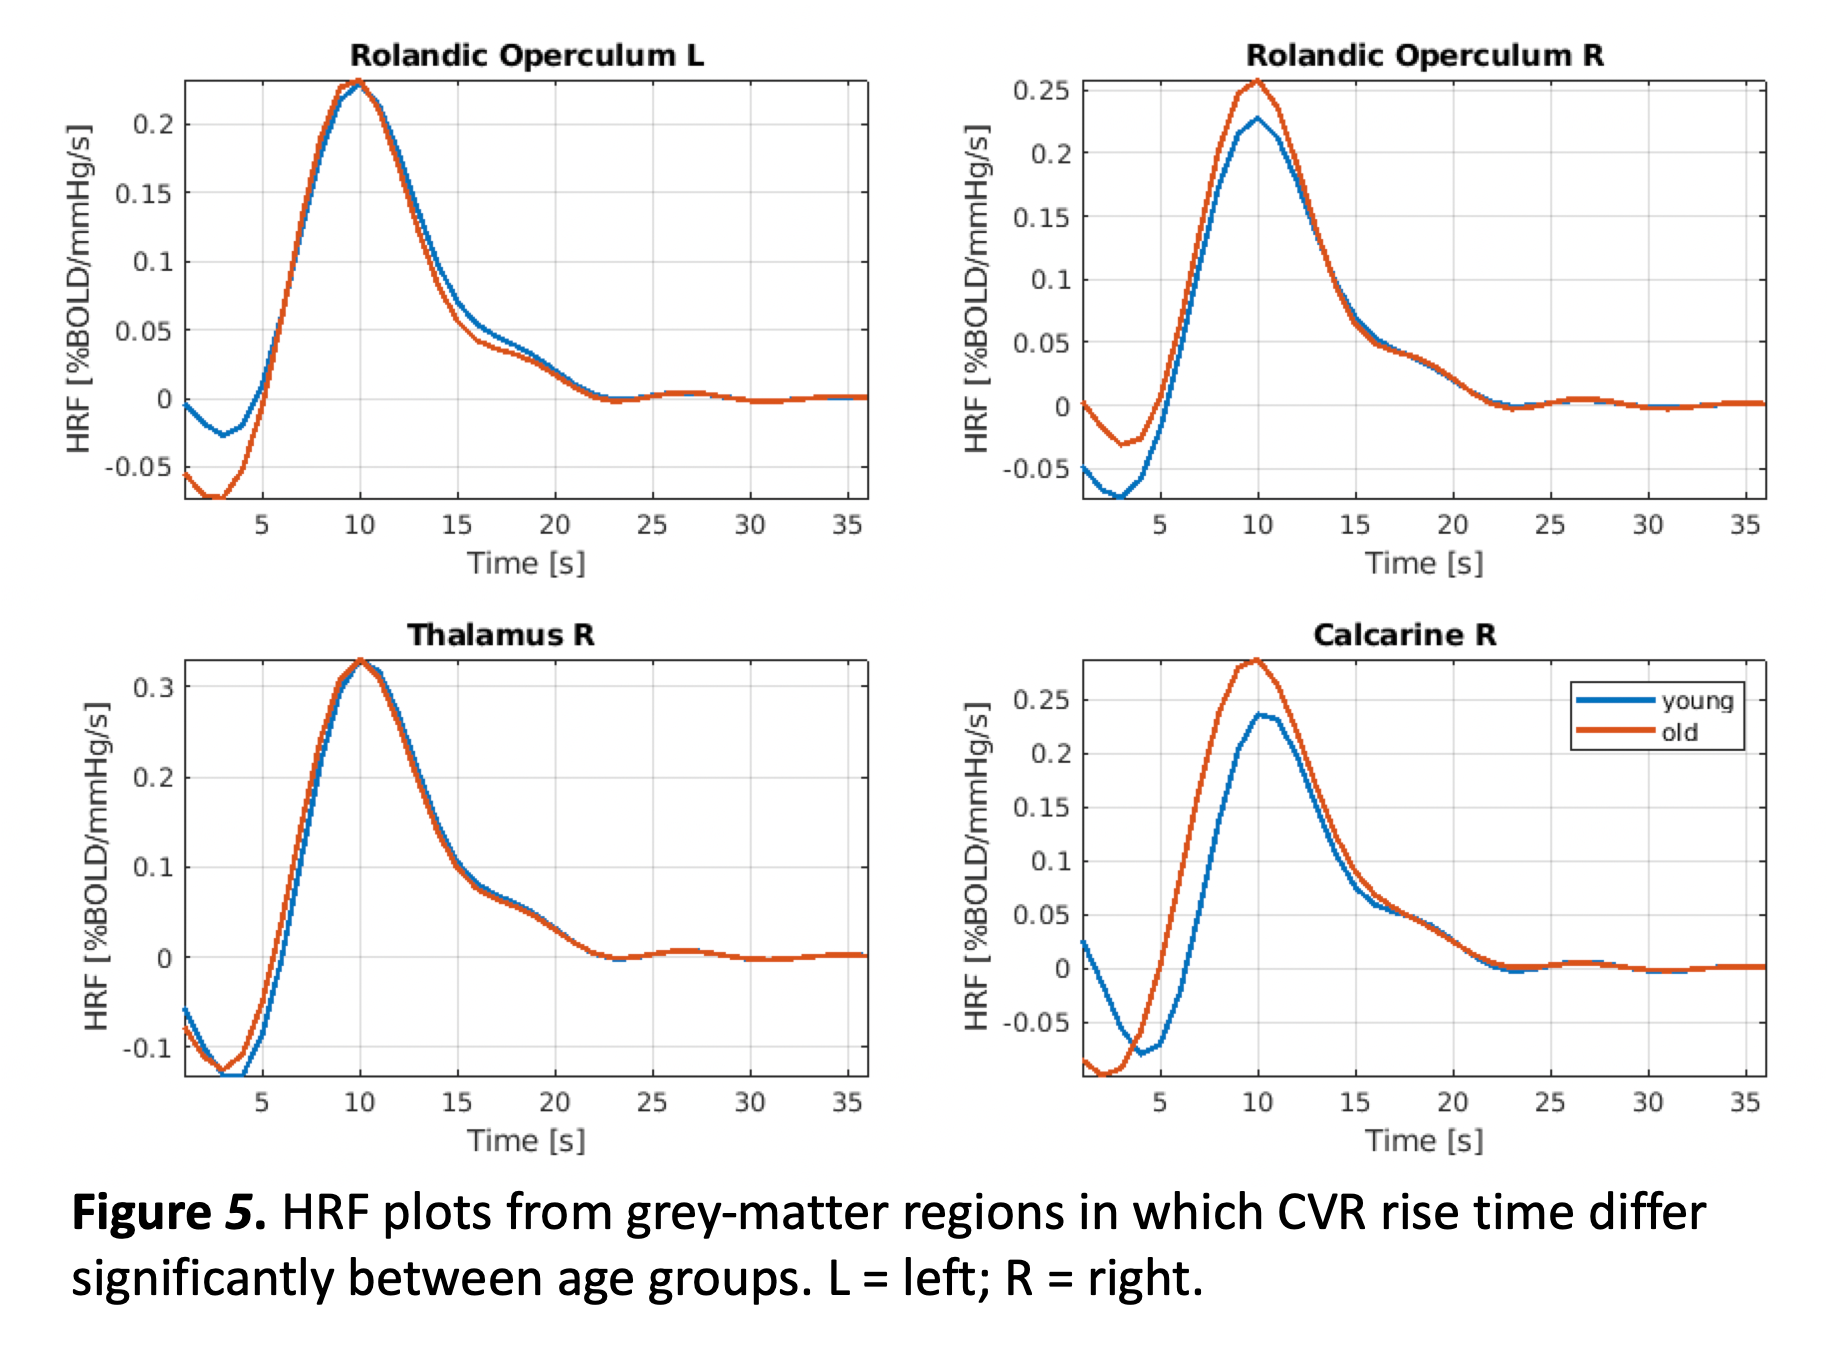
Figure 4 shows plots of the grey matter regions for the insula and hippocampus, which shows that the CVR amplitude was significantly higher for the young adults compared to the older adults. Whereas, figure 5 shows that in the rolandic operculum and the thalamus the CVR rise time, i.e. the time to induce a full CVR response, was much longer for older than young adults.
DISCUSSION
We demonstrate age-related differences in dynamic CVR using DE-pCASL-based BOLD signal responses to a sinusoidal CO2 challenge in both young and old adults. While it has been explored previously[14], dCVR estimation by HRF modeling has conventionally been challenging due to the noise sensitivity of the deconvolution process. Using a novel CCA-based dCVR modeling approach, we were able to extract voxelwise and regional HRFs that demonstrate age-related differences. In healthy adults, CVR amplitude, estimated as the area under the HRF, is higher in grey matter than white matter, as expected. Moreover, CVR amplitude is regionally lower in older adults, and CVR rise time longer. These findings are consistent with our understanding of vascular aging[2], but have not been widely demonstrated previously due to challenges in deriving CO2-related HRF in both young and older populations. Future work will explore the feasibility of dCVR estimation using the CBF portion of the DE-pCASL data, as well as the feasibility of translating the CCA deconvolution method to resting-state CVR estimation[15].Acknowledgements
The authors would like to acknowledge funding from the Canadian Institutes of Health Research (CIHR) and the Mitacs Globalink Program.References
1. Pillai JJ and Mikulis DJ. Cerebrovascular Reactivity Mapping: An Evolving Standard for Clinical Functional Imaging. American Journal of Neuroradiology.2015; 36 (1): 7-13.
2. Holmes KR, Tang-Wai D, Sam, K, et al.Slowed Temporal and Parietal Cerebrovascular Response in Patients with Alzheimer’s Disease. Can. J. Neurol. Sci. 2020; 47, 366–373.
3. Burley CA, Francis TS, Thomas KN et al Contrasting Measures of Cerebrovascular Reactivity Between MRI and Doppler: A Cross-Sectional Study of Younger and Older Healthy Individuals. Front. Phys. 2021; 12:656746
4. Poublanc J, Crawley AP, Sobczyk O, et al. Measuring Cerebrovascular Reactivity: The Dynamic Response to a Step Hypercapnic Stimulus. Journal of Cerebral Blood Flow & Metabolism. 2015;35(11):1746-1756.
5 Prokopis C. Prokopiou, Kyle T.S. Pattinson, Richard G. Wise, Georgios D. Mitsis,Modeling of dynamic cerebrovascular reactivity to spontaneous and externally induced CO2 fluctuations in the human brain using BOLD-fMRI. NeuroImage. 2019;186:533-548.
6. Shams S, Prokopiou P, Esmaelbeigi A, et al. Modeling the carbon-dioxide response function in fMRI under task and resting-state conditions. BioRxvi (2022 - PREPRINT)
7. Blockley, NP, Driver, ID, Francis, ST, et al. An improved method for acquiring cerebrovascular reactivity maps. Magn. Reson. Med. 2011; 65:1278–1286.
8. Mark CI, Slessarev M, Ito S, Han J, Fisher JA, Pike GB. Precise control of endtidal carbon dioxide and oxygen improves BOLD and ASL cerebrovascular reactivity measures. Magn. Reson. Med. 2010; 64:749–756.
9. Halani S, Kwinta J, Golestani A, Khatamian Y and Chen J. Comparing cerebrovascular reactivity measured using BOLD and cerebral blood flow MRI: The effect of basal vascular tension on vasodilatory and vasoconstrictive reactivity. NeuroImage. 2015; 110:110-123.
10. Jenkinson M, Beckmann CF, Behrens TEJ et al. FSL. Neuroimage. 2012; 62:782–790.
11. Ashburner J and Friston KJ. Unified Segmentation. Neuroimage. 2005; 26:839-851
12. Patterson N. A robust, non-parametric method to identify outliers and improve final yield and quality. CS MANTECH, Boston. 2012.
13. Makris N, Goldstein JM, Kennedy D, Hodge SM, Caviness VS, Faraone SV, Tsuang MT, Seidman LJ. Decreased volume of left and total anterior insular lobule in schizophrenia. Schizophr Res. 2006;83(2-3):155-71
14. Atwi S, Shao H, Crane DE et al. BOLD-based cerebrovascular reactivity vascular transfer function isolates amplitude and timing responses to better characterize cerebral small vessel disease. NMR Biomed. 2019;e4064.
15. Golestani AM, Wei LL, Chen JJ. Quantitative mapping of cerebrovascular reactivity using resting-state BOLD fMRI: Validation in healthy adults. Neuroimage 2016; 138, 147–163.
Figures
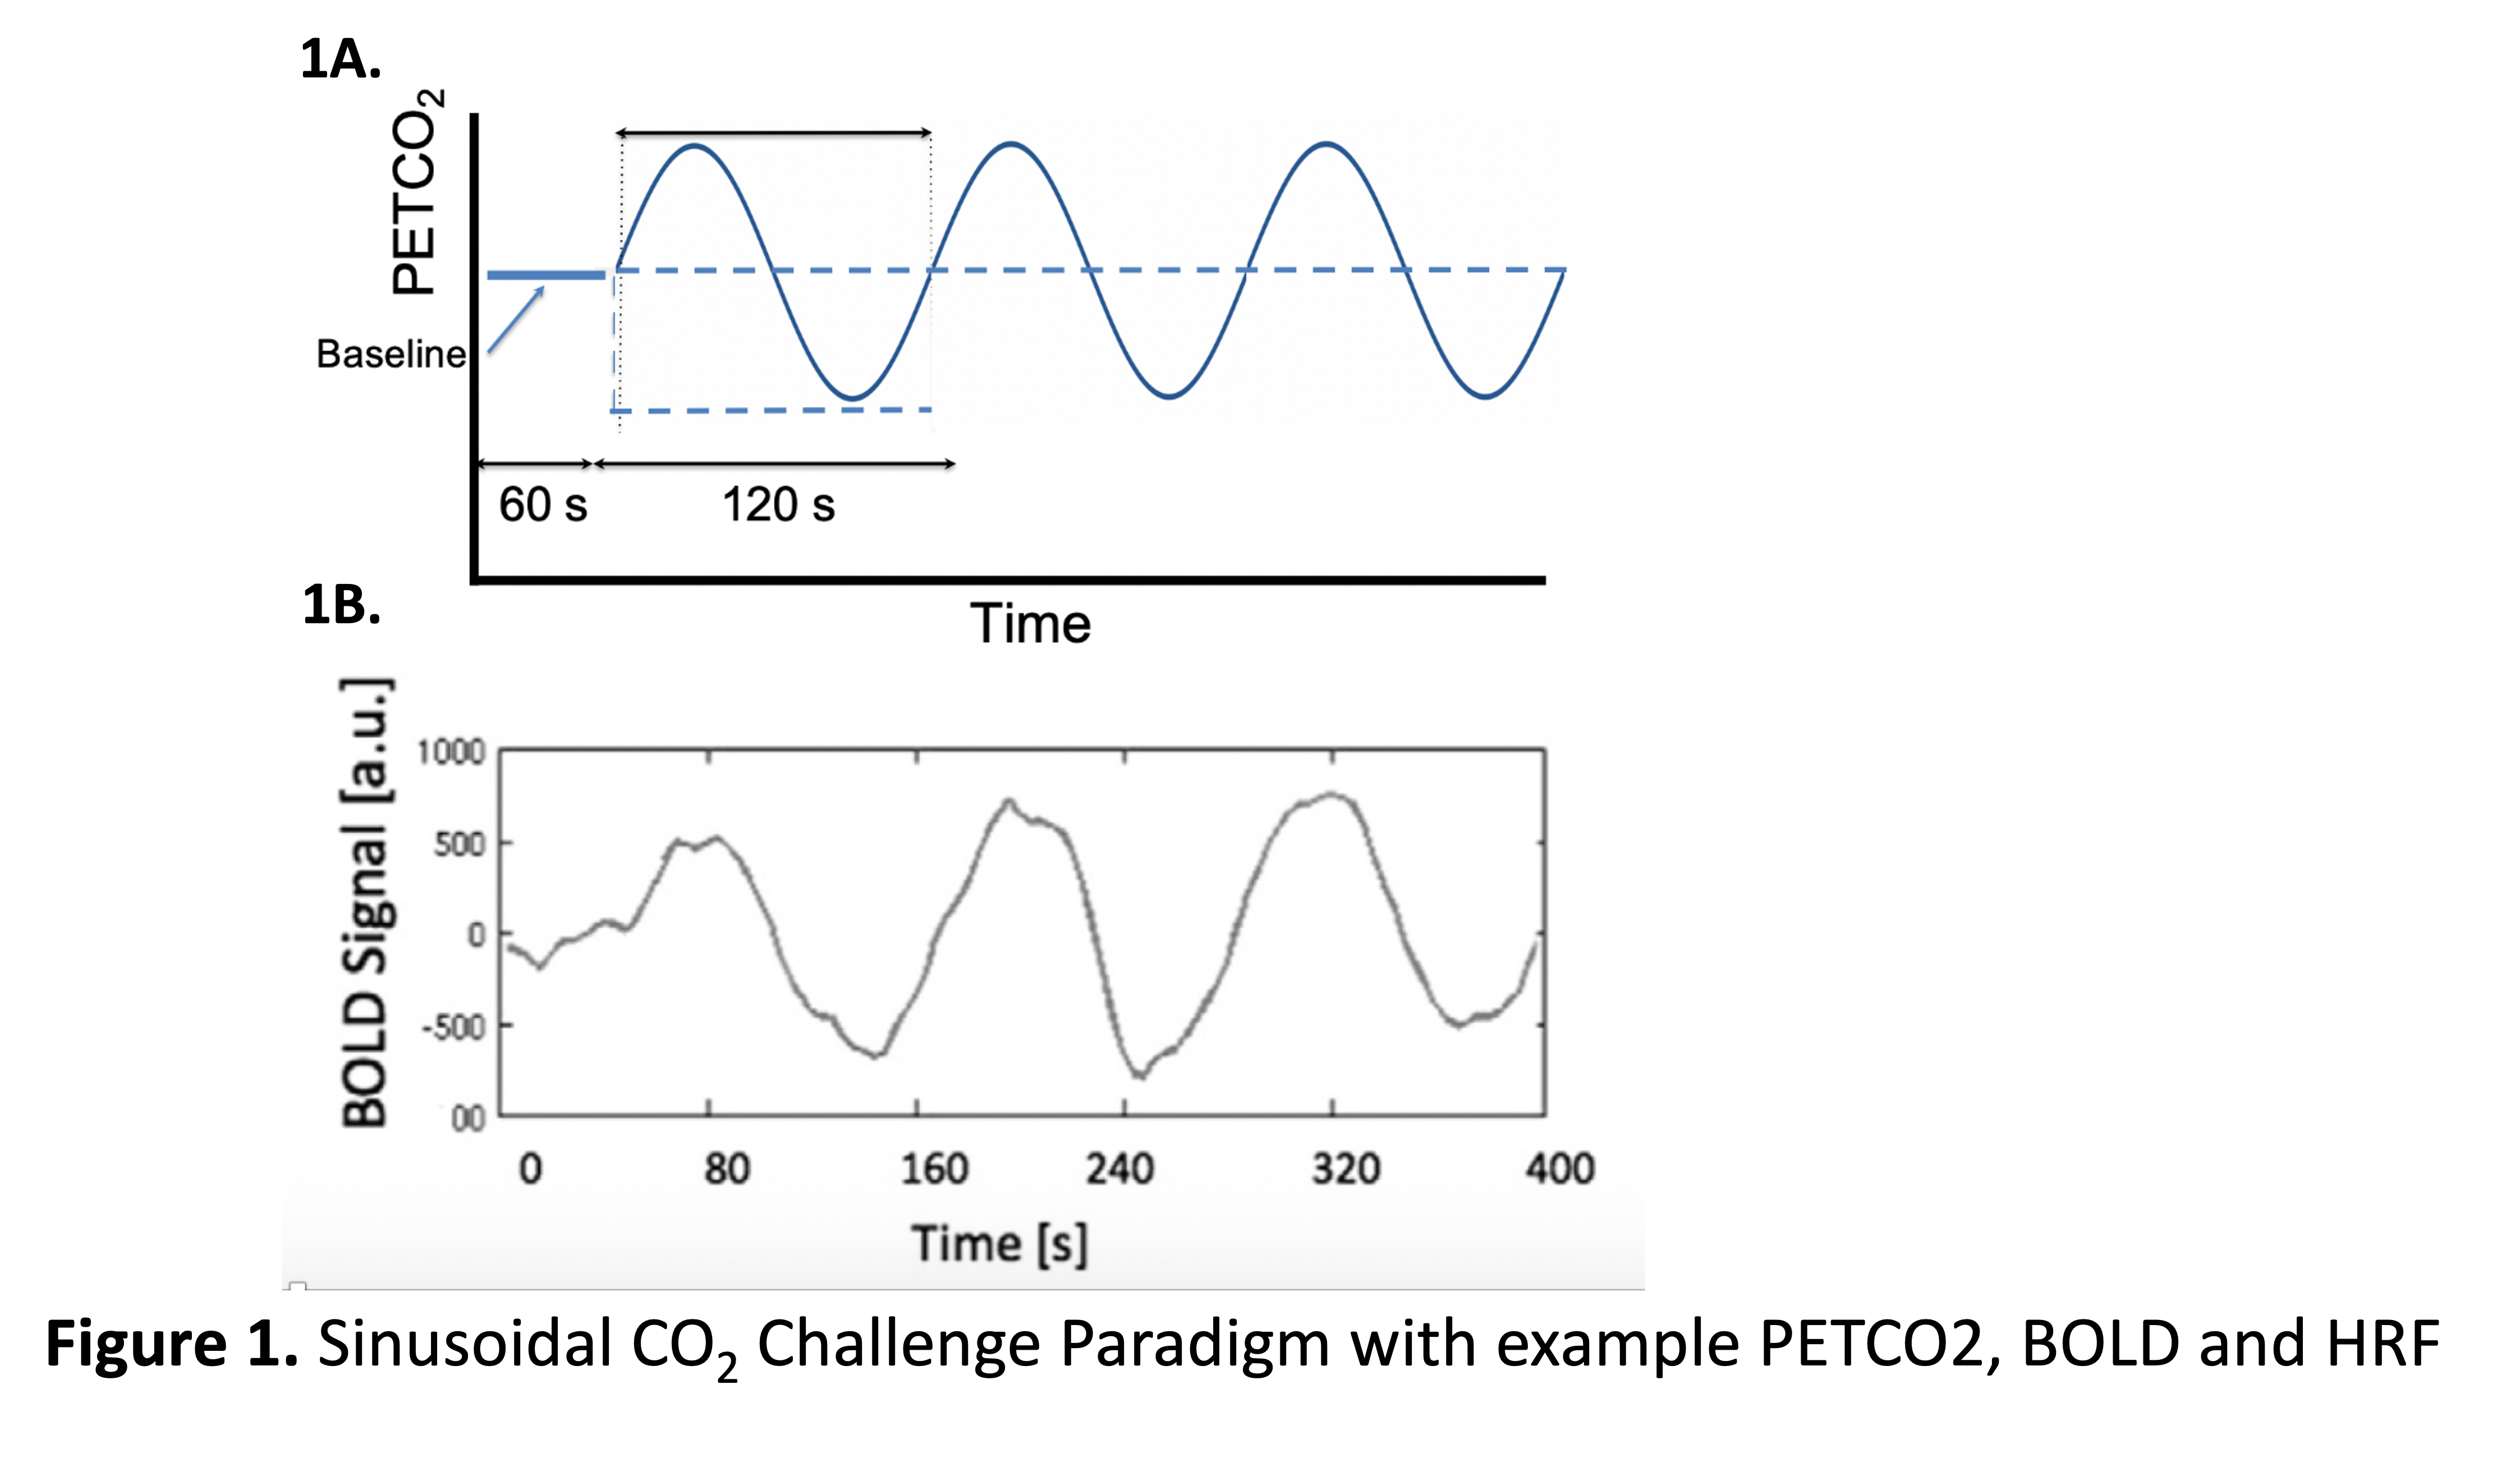
1A End tidal partial pressure of carbon dioxide (PETCO2) was sinusoidally modulated at ±4mmHg the participants baseline to induce a CVR response across low CO2, normal CO2 & high CO2 conditions for 3 rounds of 120s. Example output from the correlation analysis (CCA) algorithm (1B) PETCO2 timecourse trace (s, seconds)
1B: Example output from the correlation analysis (CCA) algorithm