0478
Reproducibility of conventional and GABA-edited multi slice MRSI in the human brain at 3T
Dillip K. Senapati1,2, Helge J. Zöllner1,2, Ipek Özdemir 1,2, Georg Oeltzschner1,2, Doris D.M. Lin1,2, and Peter B. Barker1,2
1Russell H. Morgan Department of Radiology and Radiological Science, The Johns Hopkins University School of Medicine, Baltimore, MD, United States, 2F. M. Kirby Research Center for Functional Brain Imaging, Kennedy Krieger Institute, Baltimore, MD, United States
1Russell H. Morgan Department of Radiology and Radiological Science, The Johns Hopkins University School of Medicine, Baltimore, MD, United States, 2F. M. Kirby Research Center for Functional Brain Imaging, Kennedy Krieger Institute, Baltimore, MD, United States
Synopsis
Keywords: Data Analysis, Spectroscopy, GABA, MR Spectroscopy, MRSI, Reproducibility, Brain
Reproducibility of both conventional and GABA-edited multi-slice MRSI of the human brain recorded at 3T was investigated in 11 healthy adult volunteers. GABA-edited data were post-processed using a retrospective motion compensation (MoCo) scheme. Test-retest coefficients of variation(CV) were calculated. Overall reproducibility was good for conventional MRSI for selected brain regions, but edited-MRSI data showed significant variations. Edited-MRSI scans may benefit from both improved post-doc correction schemes to minimize subtraction artifacts, as well as better B0 field homogeneity over the brain, and possibly also prospective MoCo schemes.Introduction
Multi-slice MR spectroscopic imaging (MRSI) of the human brain at 3T has been used extensively over the past two decades for clinical and research investigations1,2. However, there are only few previous studies of its reproducibility. More recently, techniques have been introduced for single- or multi-slice MRSI of GABA3, based on the use of spectral editing methodology, including retrospective motion compensation methods for reduction of subtraction artifacts in edited spectra4.The purpose of this study was to evaluate the reproducibility of both conventional and edited multi-slice 2D MRSI measurements in the normal human brain at 3T, including the use of retrospective motion compensation.
Methods
11 healthy volunteers: 9 adults, 3M/6F, age 28 ± 6.7 years, min 22, max 43, and 2 children (1M/1F, age 7/11 years) were scanned twice between 7-14 days apart (mean ± st.dev. = 10±3 days).An MR protocol including anatomical MRI, B0 field maps for 2nd-order shim correction, conventional spin-echo and GABA-edited multi-slice MRSI, and a water reference MRSI was implemented. All experiments were performed on Philips 3T ‘Ingenia Elition’, 32-channel head coil with a total scan time of 45 minutes. Hypergeometric dual-band (HGDB) and outer-volume suppression (OVS) pulses water and lipid suppression5 were used for the conventional and edited-MRSI sequences. All MRSI scans were performed with three 15mm oblique-axial slices (2.5 mm gap, lateral ventricles to the vertex), 14x17 matrix (circular k-space sampling), nominal voxel size 12x12x15 mm (≈2.2 cm3). For GABA-editing, sequence parameters were TR/TE 1.8s/68ms, 4 excitations, scan time 22m 21s, 20 ms sinc-Gauss editing pulses (‘sg150’, 97 Hz bandwidth), edit ON/OFF frequencies 1.9/0.7 ppm. Parameters for conventional MRSI were TR/TE 1.7s/20ms, 1 excitation, scan time 5m 26s, and for water MRSI TR/TE 0.85s/20ms, 1 excitation, scan time 2m 39s.
The MRSI data were analyzed in Osprey6. For GABA-edited MRSI, retrospective MoCo was applied on raw k-space data prior to spatial Fast Fourier Transformation (FFT) as described previously5. After spatial transformation, coil combination and phase-correction were applied based on the water reference scan. Metabolite estimates were derived with linear-combination modelling using sequence-specific basis sets and quantified relative to total creatine (tCr). GABA-edited MRSI was analyzed with an optimized LCM approach for GABA-edited spectra7. Quantitative estimates from 14 selected brain regions over 3 slices (Figure 1) were analyzed including N-acetylaspartate (NAA), total-choline (tCho), glutamate plus glutamine (Glx), and myo-inositol (mI) estimates from the conventional MRSI and GABA+ from the GABA-edited MRSI Finally test-retest coefficients of variation (CV) were used to evaluate the reproducibility.
Results
Figure 1 shows the brain regions used for analysis. Figure 2 shows (A) conventional and (B) GABA-edited MRSI spectra for the 2 visits from a single subject, showing good spectral quality in terms of SNR, line-widths, and low residual water and lipid resonances. Subtraction artifacts (residual choline peak at 3.2 ppm) are seen in some of the GABA-edited MRSI spectra in either visit 1 or visit 2. Figure 3 shows the mean CVs for the 4 major metabolites (as described previously) measured in conventional MRSI, as well as mean CVs of GABA+ (GABA plus macromolecules), expressed as ratios to tCr for each brain region. As expected, CVs were lower for the compounds with larger, singlet signals (tNAA, tCho), with GABA+/tCr showing the largest CVs. Figure 4 shows mean tNAA/tCr, tCho/tCr, Glx/tCr, mI/tCr and GABA+/tCr ratios for all 14 brain regions at both study visits.Discussion and Conclusions
Multi-slice conventional MRSI at 3T was found to be reproducible within 10 to 20% CV over the 1-to-2-week interval for the major metabolites in most brain regions. In contrast, GABA-edited MRSI data currently shows poor reproducibility in this study, with typical CVs in the 30 to 40% range for many brain regions, and as high as 80% in the worst case.CVs were regionally dependent as expected, due to variations in B0 field homogeneity, as well as lipid contamination from the scalp in more peripheral locations. Of note the genu of the corpus callosum (voxel 9 in figure 1) generally gave poor results because of susceptibility effects due to its proximity to sphenoid sinus. Peripheral brain regions also tended to have less good quality/reproducibility (compared to more central regions) due to worse B0 field homogeneity and residual scalp lipid signals. Reasons for the worse reproducibility in the edited-MRSI spectra remain to be fully investigated, but presumably reflect the much smaller GABA+ signal (compared to the conventional metabolites), as well as incomplete removal of subtraction artifacts, which awaits further refinements.
Acknowledgements
Supported by NIH grants R01EB028259 and P41EB031771, and DOD W81XWH2010819.References
- Duyn JH, Gillen J, Sobering G, van Zijl PC, Moonen CT. Multisection proton MR spectroscopic imaging of the brain. Radiology 1993;188(1):277-282.
- Maudsley AA, Andronesi OC, Barker PB, Bizzi A, Bogner W, Henning A, Nelson SJ, Posse S, Shungu DC, Soher BJ. Advanced magnetic resonance spectroscopic neuroimaging: Experts' consensus recommendations. NMR Biomed 2021;34(5): e4309.
- Zhu H, Edden RA, Ouwerkerk R, Barker PB. High resolution spectroscopic imaging of GABA at 3 Tesla. Magn Reson Med 2011;65(3):603-609.
- Chan KL, Barker PB. Retrospective motion compensation for edited MR spectroscopic imaging. Neuroimage 2019; 202:116141.
- Zhu H, Ouwerkerk R, Barker PB. Dual-band water and lipid suppression for MR spectroscopic imaging at 3 Tesla. Magn Reson Med 2010;63(6):1486-1492.
- Oeltzschner G, Zollner HJ, Hui SCN, Mikkelsen M, Saleh MG, Tapper S, Edden RAE. Osprey: Open-source processing, reconstruction & estimation of magnetic resonance spectroscopy data. J Neurosci Methods 2020; 343:108827.6.
- Zollner HJ, Tapper S, Hui SCN, Barker PB, Edden RAE, Oeltzschner G. Comparison of linear combination modeling strategies for edited magnetic resonance spectroscopy at 3 T. NMR Biomed 2022;35(1): e4618.
Figures
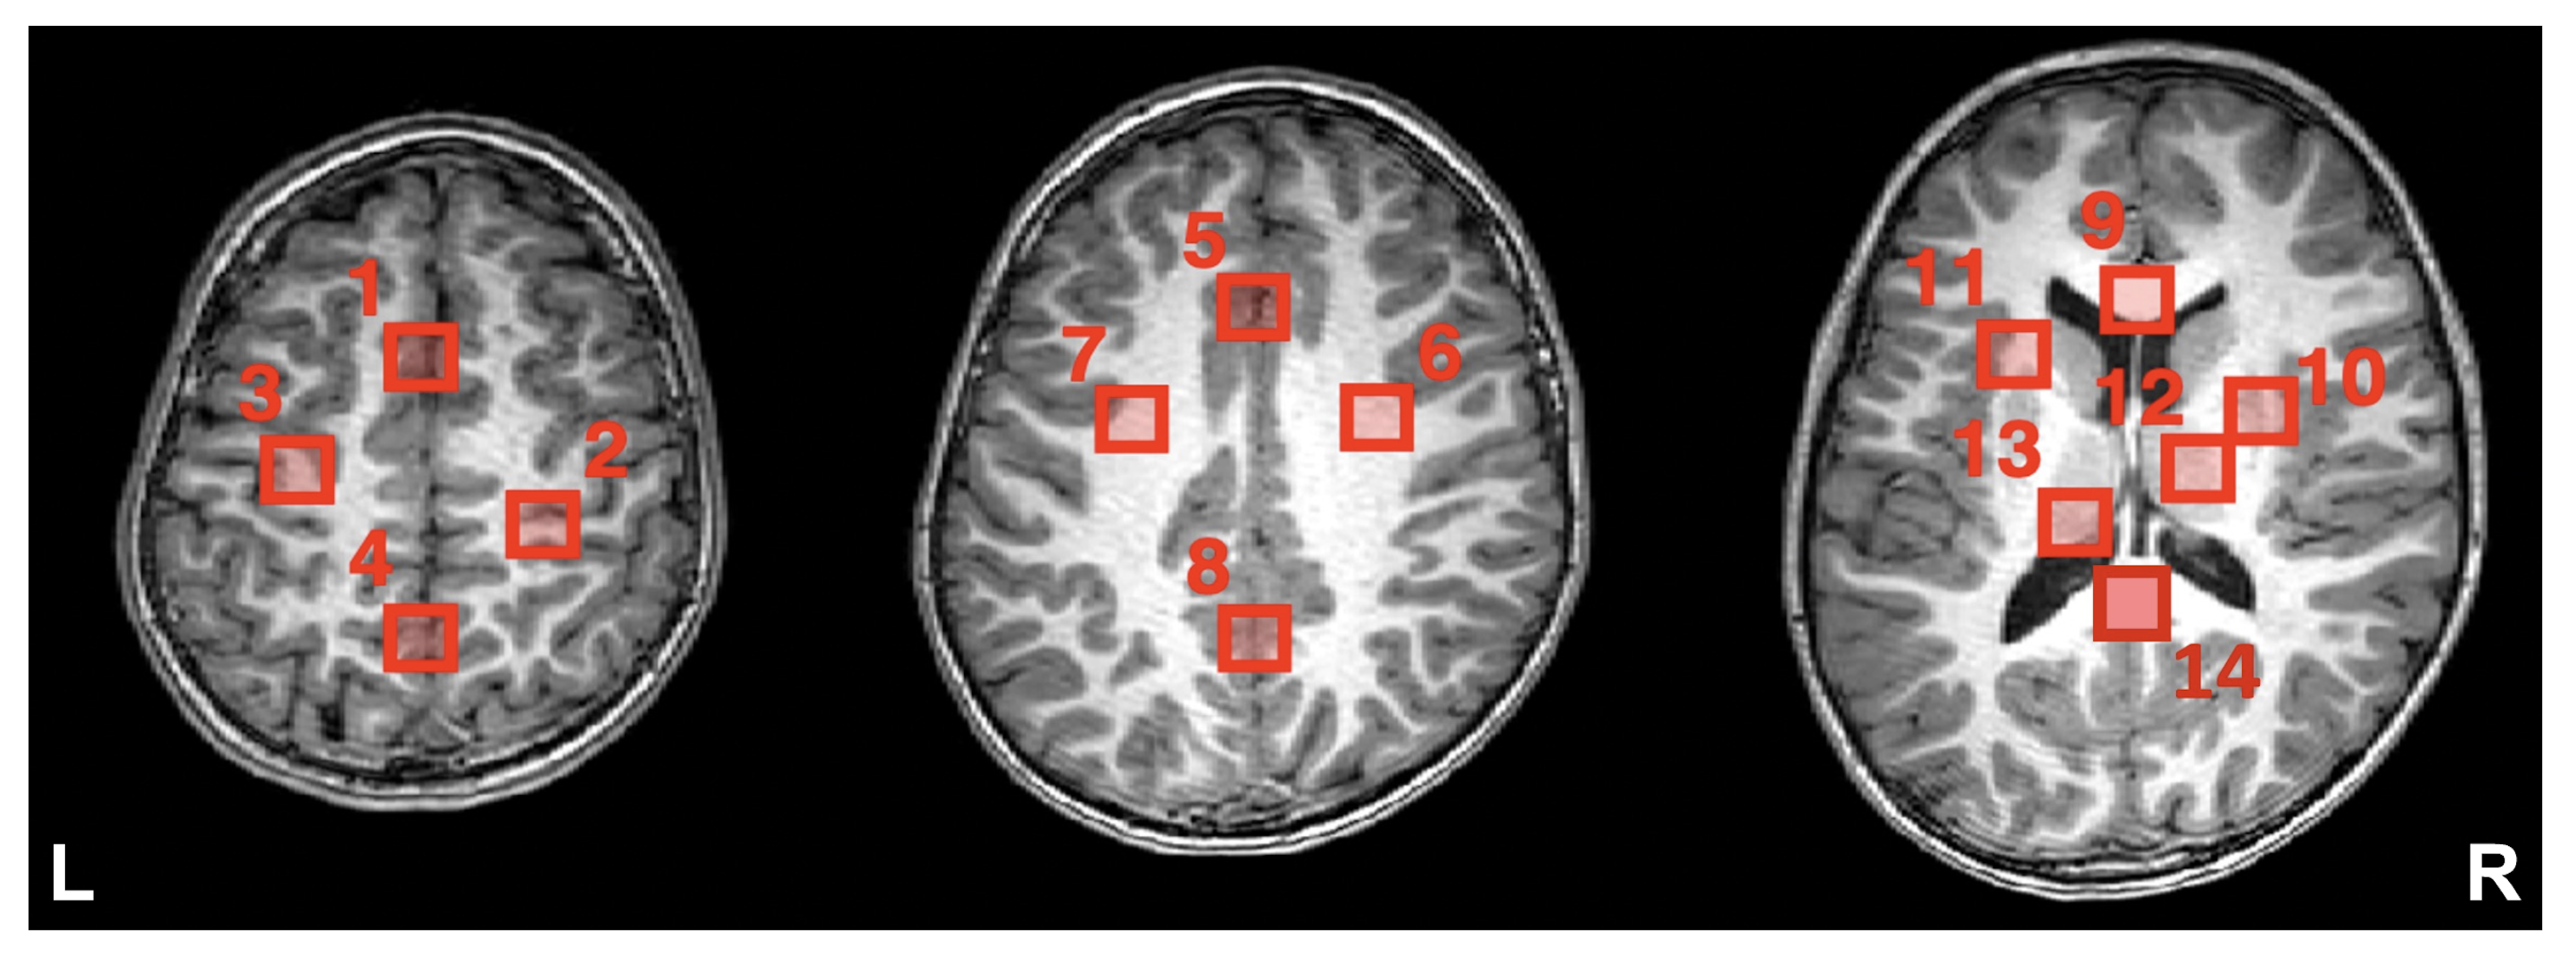
Figure 1: T1w images depicting the voxel locations chosen for analysis in one subject: 1: Frontal gray matter (GM), 2: R. motor cortex, 3: L. motor cortex, 4: posterior GM, 5: Anterior cingulate, 6: R. centrum semiovale (CSO), 7: L. CSO, 8: Posterior cingulate, 9: Genu of corpus callosum (CC), 10: R. insular, 11: L. insular, 12: R. thalamus, 13: L. thalamus, 14: Splenium of CC.
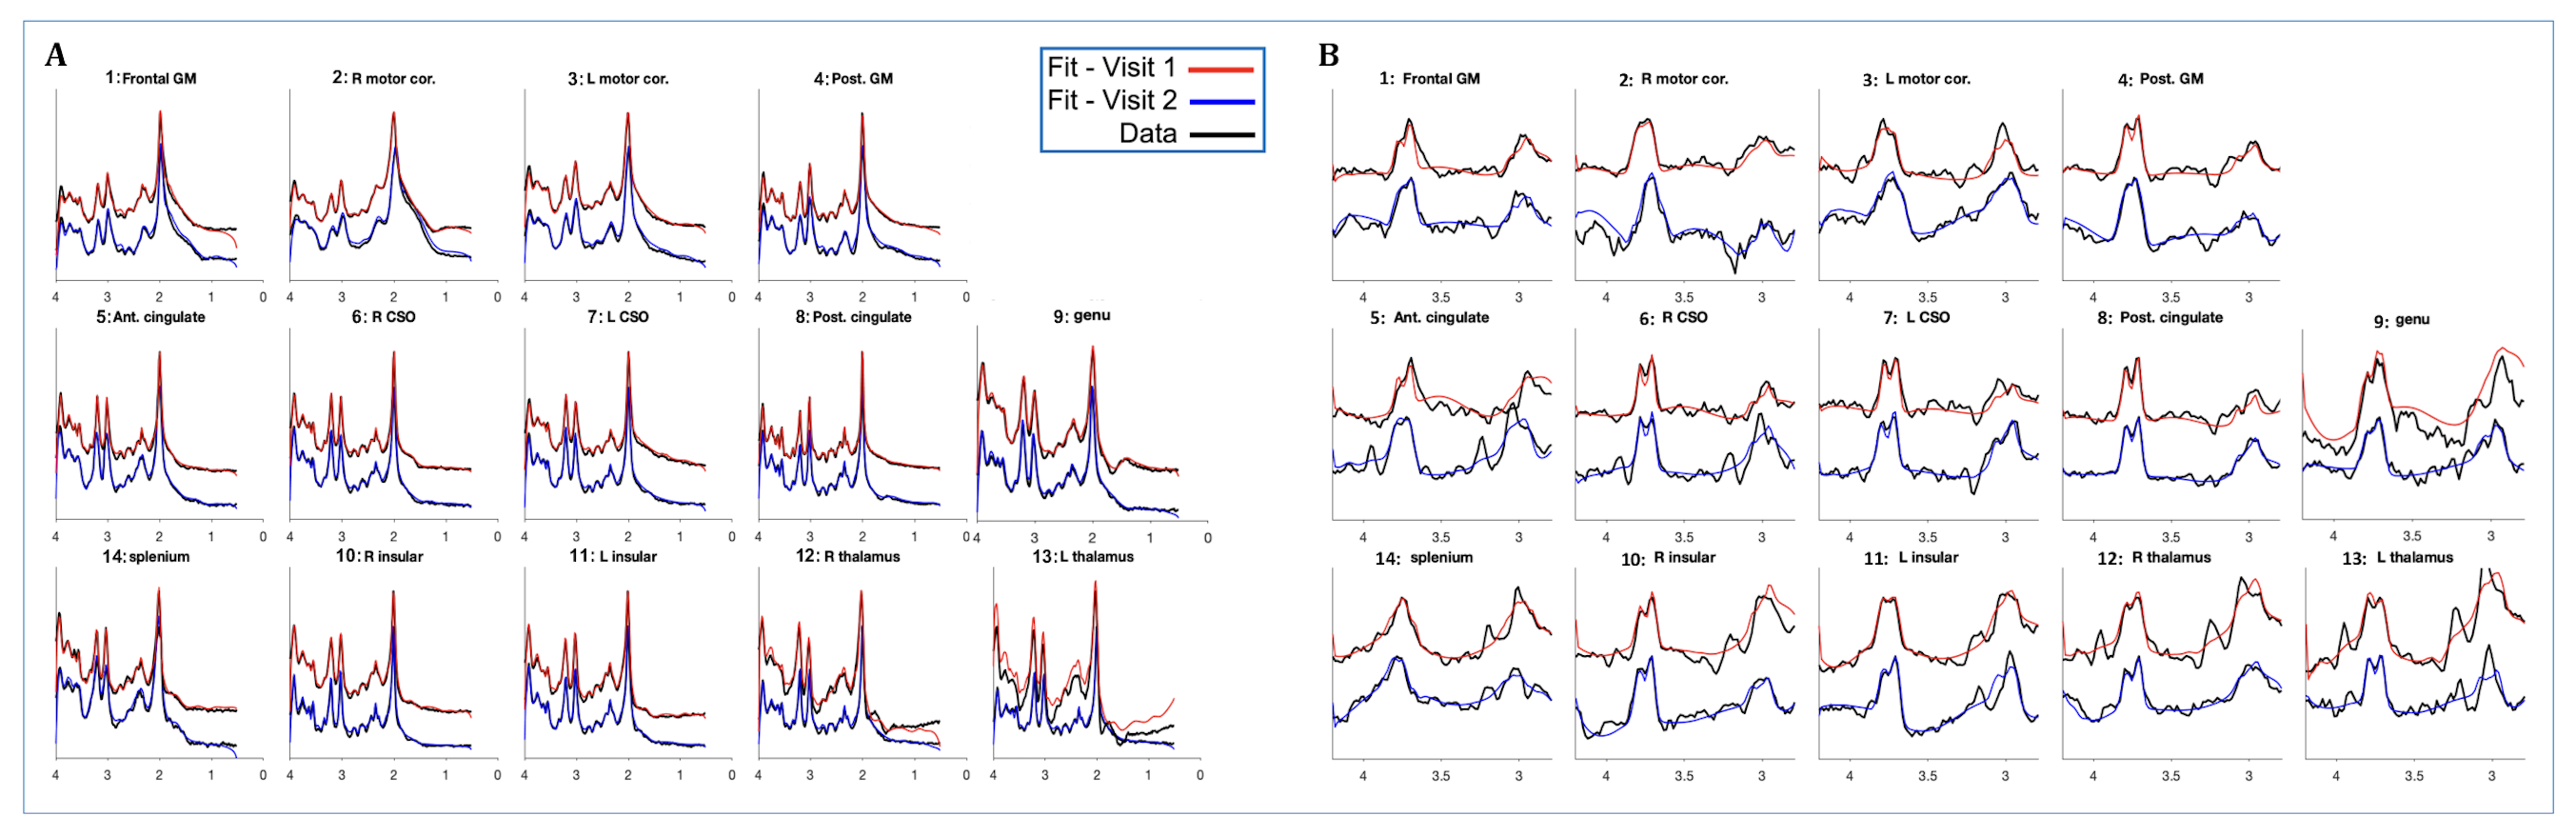
Figure 2: (A)Conventional-MRSI (B) GABA-edited-MRSI data from the brain regions indicated in Figure 1 from one subject, showing original data (black), and spectral fit results from visit 1(red) and visit 2(blue).
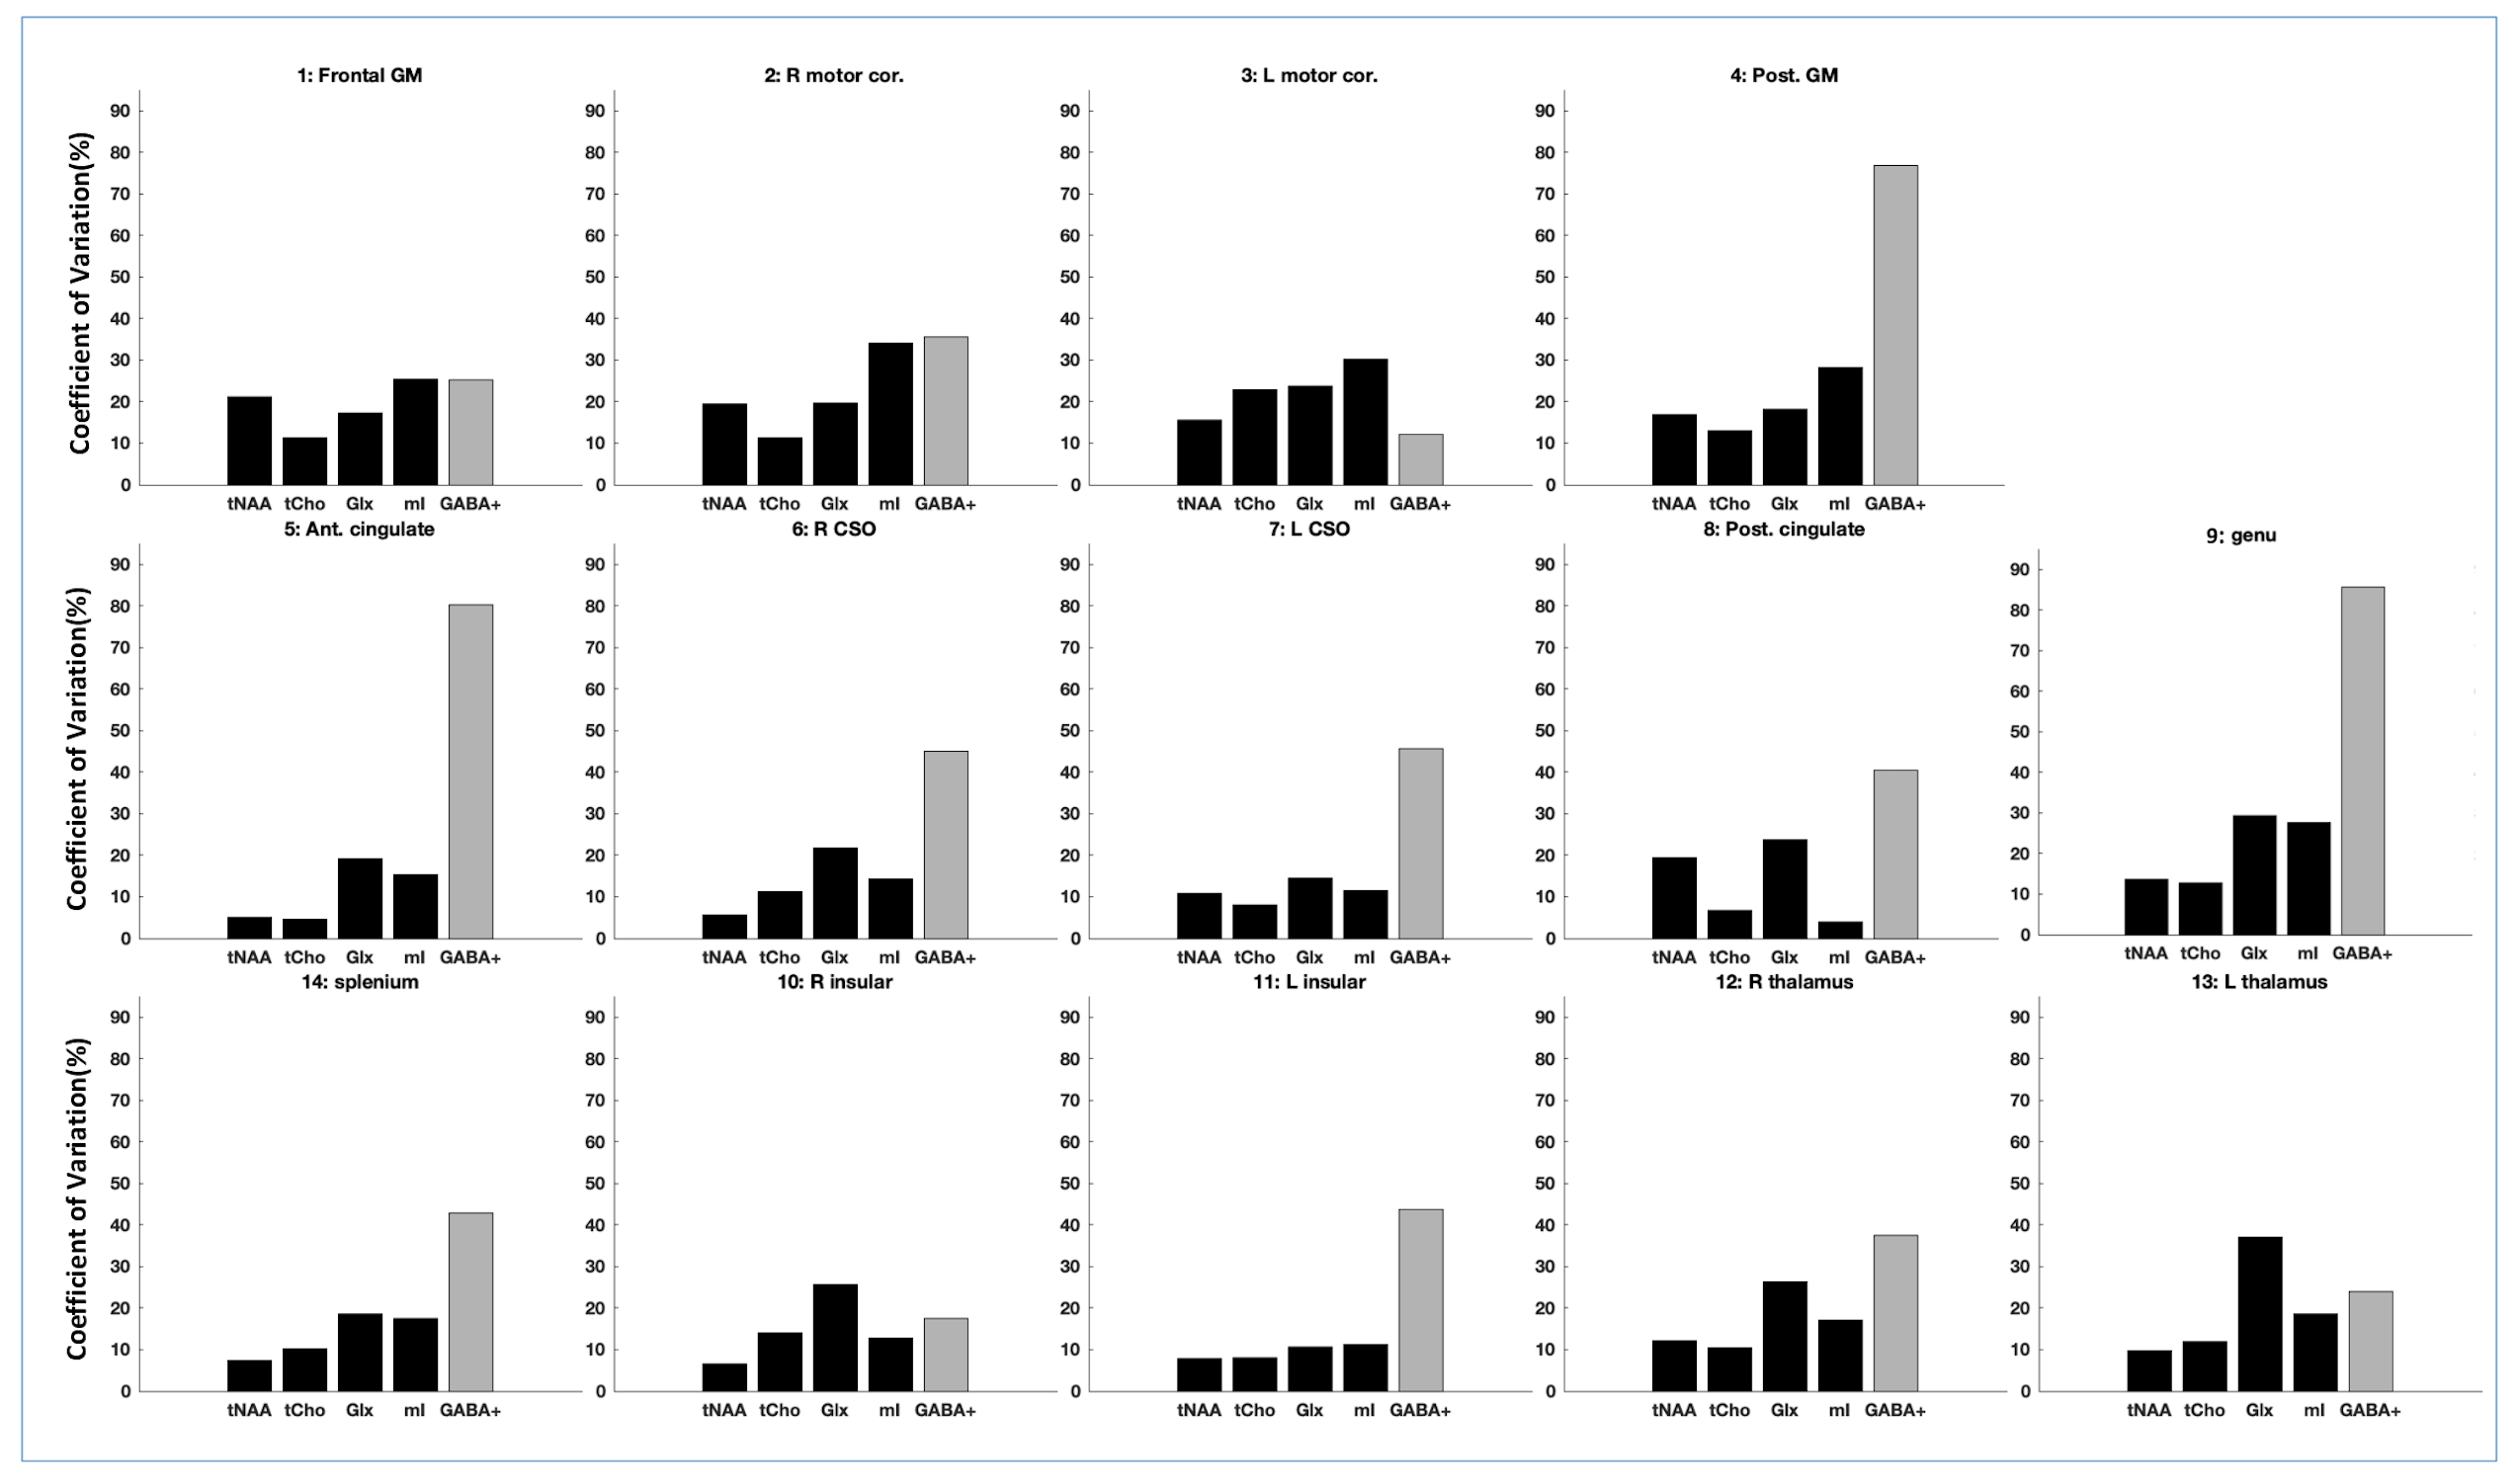
Figure 3: Mean % coefficients or variation for tNAA/tCr, tCho/tCr, Glx/tCr, mI/tCr, and GABA+/tCr from the conventional MRSI data and edited-GABA MRSI respectively for all the 14 brain regions analyzed.
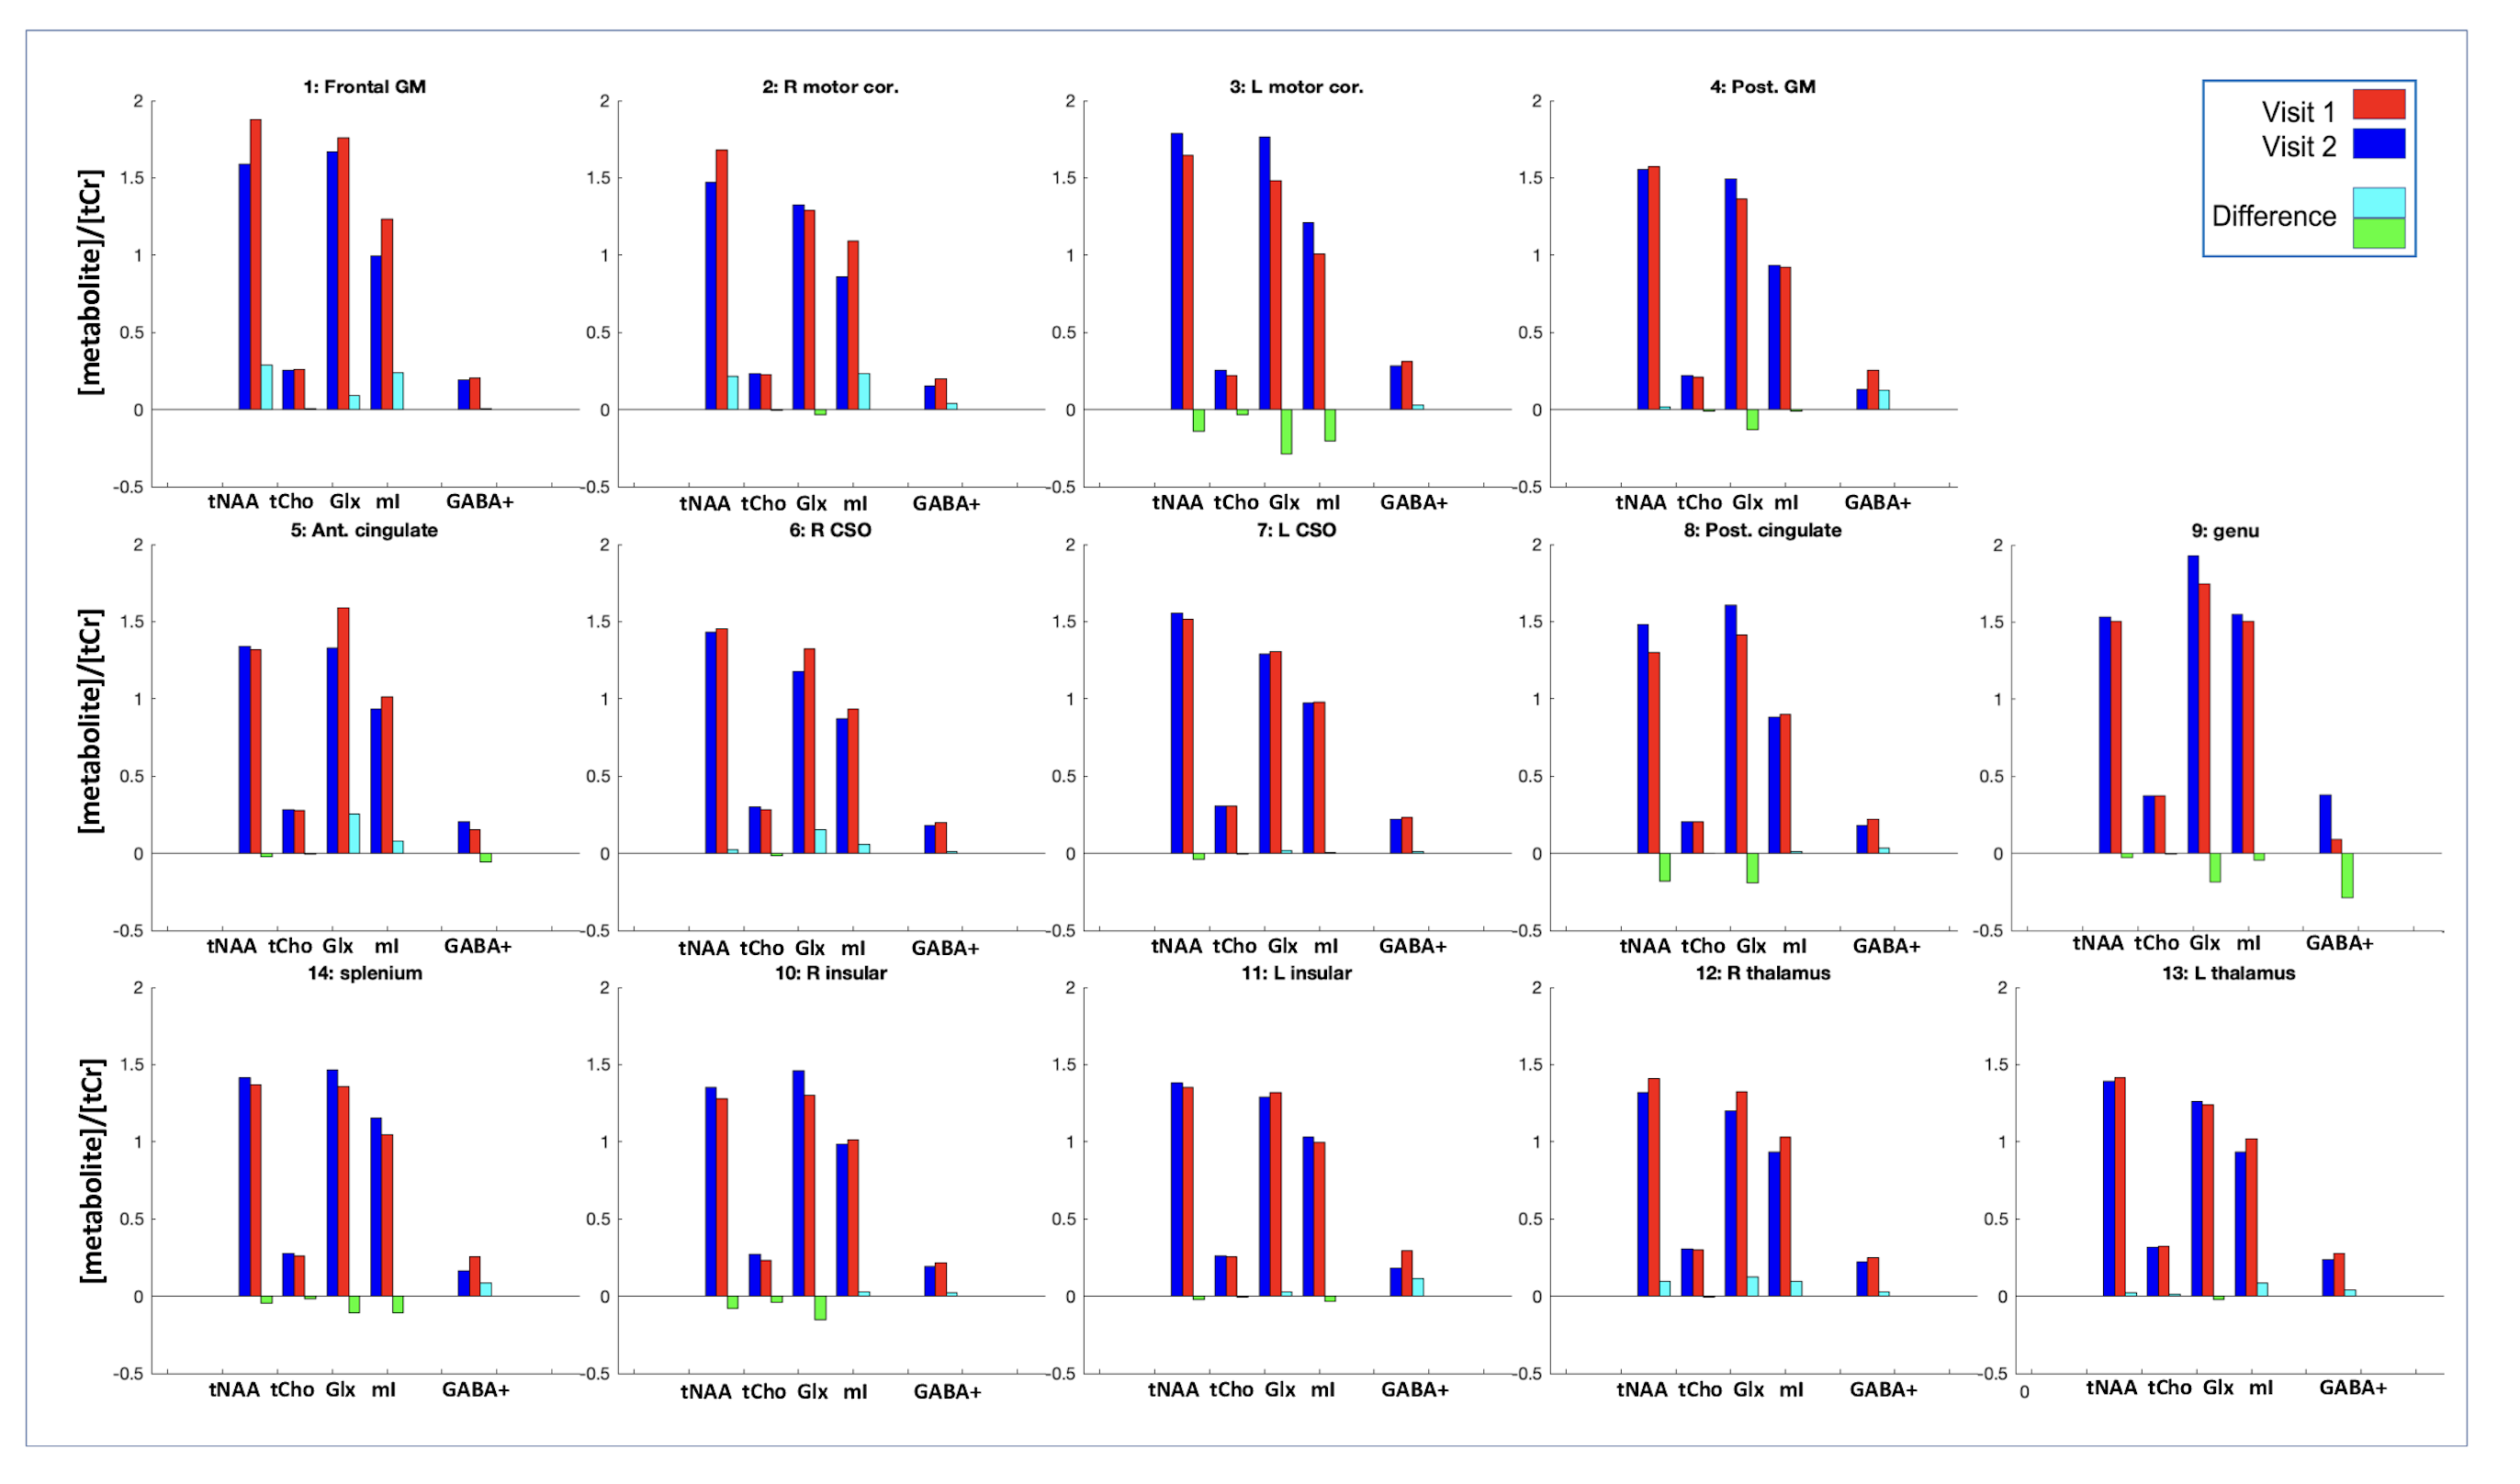
Figure 4: Mean tNAA/tCr, tCho/tCr, Glx/tCr and mI/tCr ratio from the conventional MRSI data and mean GABA+/tCr ratios from the edited-MRSI data analyzed for the 14 brain regions.
DOI: https://doi.org/10.58530/2023/0478