0474
Separation of Macromolecules and Metabolites in Ultrashort-TE MRSI Data with Learned Probabilistic Subspaces1Beckman Institute for Advanced Science and Technology, University of Illinois at Urbana-Champaign, Urbana, IL, United States, 2Department of Electrical and Computer Engineering, University of Illinois at Urbana-Champaign, Urbana, IL, United States, 3National Center for Supercomputing Applications, University of Illinois at Urbana-Champaign, Urbana, IL, United States, 4Siemens Medical Solutions USA, Inc., Urbana, IL, United States, 5School of Biomedical Engineering, Shanghai Jiao Tong University, Shanghai, China
Synopsis
Keywords: Data Analysis, Spectroscopy, Macromolecule
Separation of macromolecules and metabolites in ultrashort-TE MRSI data has been very difficult due to limited SNR and strong spectral overlap. In this work, we proposed a new solution to the problem using a subspace-based approach aided with long-TE navigator signals. Physics-based prior information was incorporated through pre-learned spectral bases and probability distributions of spatial coefficients. The proposed method has been validated using experimental data from healthy and brain tumor subjects, producing impressive results.
Introduction
Ultrashort-TE FID MRSI scans are increasingly used in practical applications due to high imaging speed and SNR efficiency.1-8 However, ultrashort-TE MRSI data are prone to contaminations from macromolecule (MM) signals, which contribute to a broad baseline overlapping all metabolites.9 Effective separation of metabolite and MM signals is thus highly desired (for accurate metabolite quantification) but very difficult due to low SNR and strong spectral overlaps.10-13 Various parametric model fitting methods have been proposed to separate metabolites and MM signals exploiting their distinct T2 values.14-16 However, these methods are sensitive to modelling errors and noise perturbations, thus with limited utility in ultrashort-TE MRSI. Machine learning methods have also been proposed,17-20 but they may suffer from neural network instabilities, especially with limited training data.21,22Here we propose a new method to separate MM and metabolite signals in ultrashort-TE MRSI data. This method leverages prior information from training data through pre-learned spectral subspaces and coefficient distributions, as well as posterior information from long-TE navigators. The proposed method has been validated with healthy and brain tumor subjects’ experimental data, producing impressive results.
Methods
We represented the ultrashort-TE MRSI data $$$\rho(\boldsymbol{x},t)$$$ using a probabilistic union-of-subspaces model23-27:$$\begin{align*}\rho(\boldsymbol{x},t)&=\sum_{m\in\mathrm{meta}}c_m(\boldsymbol{x})\phi_m(t) +\sum_{m\in\mathrm{MM}}c_m(\boldsymbol{x})\phi_m(t),\\&\mathrm{subject~to~}c_m\sim\mathrm{Pr}(c_m),\end{align*}$$
where $$$\phi_m(t)$$$ is the pre-learned basis function for the $$$m$$$th molecule, and $$$c_m(\boldsymbol{x})$$$ the corresponding spatial coefficient with a probabilistic constraint $$$\mathrm{Pr}(c_m)$$$, as illustrated in Figure 1A. This model significantly reduced the degrees-of-freedom with pre-learned bases and probabilistic constraints, enabling efficient incorporation of information from training data and navigator data, as well as effective separation of metabolites and MM from noisy data.
The MM basis functions were determined with spectral prior information and training data. Specifically, we acquired inversion-recovery MRSI data from healthy subjects for MM subspace training. The training spectra were fitted using the following Voigt parametric model28:
$$\begin{align*}s_m(t)=a_m\cdot e^{-\sigma_m^2t^2}\cdot e^{-t/T_{2,m}^*}\cdot e^{-i2\pi\Delta f_m t}\cdot h(t),\end{align*}$$
to determine spectral parameters $$$\sigma_m$$$, $$$T_{2,m}^*$$$, $$$\Delta f_m$$$, and $$$h(t)$$$. Typical fitting of inversion-recovery data was shown in Figure 2. The MM subspaces were then generated from the fitted signals through singular value decomposition. Corresponding coefficients were then estimated from the training data using the derived subspaces, and their distributions were parameterized as mixture-of-Gaussians.29
The metabolite basis functions were learned from training data with quantum simulated basis and empirical spectral parameter distributions, as described in the previous publications.25,26 Similarly, metabolite coefficient distributions were estimated from the training data, parameterized as mixture-of-Gaussians.
We further adapted the pre-learned subspaces and coefficient distributions to each acquired imaging data. More specifically, we adjusted the linewidth and frequency shift parameters $$$\delta R_2$$$ and $$$\delta f$$$ jointly for all molecules:
$$\tilde{\phi}_m(t)=\phi_m(t)\cdot e^{-\delta R_2\cdot t}\cdot e^{i2\pi\delta ft},$$
to compensate the data-dependent lineshape variations due to different experimental setups. We also acquired low-resolution long-TE MRSI navigator data along with the ultrashort-TE FID-MRSI imaging data (illustrated in Figure 1B). The macromolecule-free navigator spectra provided narrowed, subject-specific posterior metabolite coefficient distributions for better separation from MM signals:
$$\mathrm{Pr}\left(c_m|\rho^{(\mathrm{nav})}\right)\propto\mathrm{Pr}(c_m)\cdot\mathrm{Pr}\left(\rho^{(\mathrm{nav})}|c_m\right).$$
With the adjusted spectral basis functions and coefficient distributions, we obtained the spatial coefficients by solving the following maximum a posterior estimation problem:
$$\mathbf{\hat{C}}=\arg\min_{\mathbf{C}}\frac{1}{2}\left\|\boldsymbol{\rho}-\mathbf{\tilde{\Phi}}\mathbf{C}\|_2^2+\lambda\|\mathbf{W}\mathbf{C}\right\|_2^2-\sigma_{\mathrm{noise}}^2\log\mathrm{Pr}\left(\mathbf{C}|\boldsymbol{\rho}^{(\mathrm{nav})}\right),$$
where $$$\boldsymbol{\rho}$$$, $$$\mathbf{\tilde{\Phi}}$$$, and $$$\mathbf{C}$$$ represent the vector/matrix forms of original MRSI data, spectral basis functions, and spatial coefficients, respectively. Additional edge-weighting regularization30 $$$\|\mathbf{W}\mathbf{C}\|_2^2$$$ and the data-adapted probabilistic regularization $$$\log \mathrm{Pr}\left(\mathbf{C}|\boldsymbol{\rho}^{(\mathrm{nav})}\right)$$$ were imposed on spatial coefficients. The optimization problem was solved using the majorization-minimization algorithm,29 and the spatiospectral functions of metabolites and MM were then reconstructed according to the union-of-subspaces model.
Results
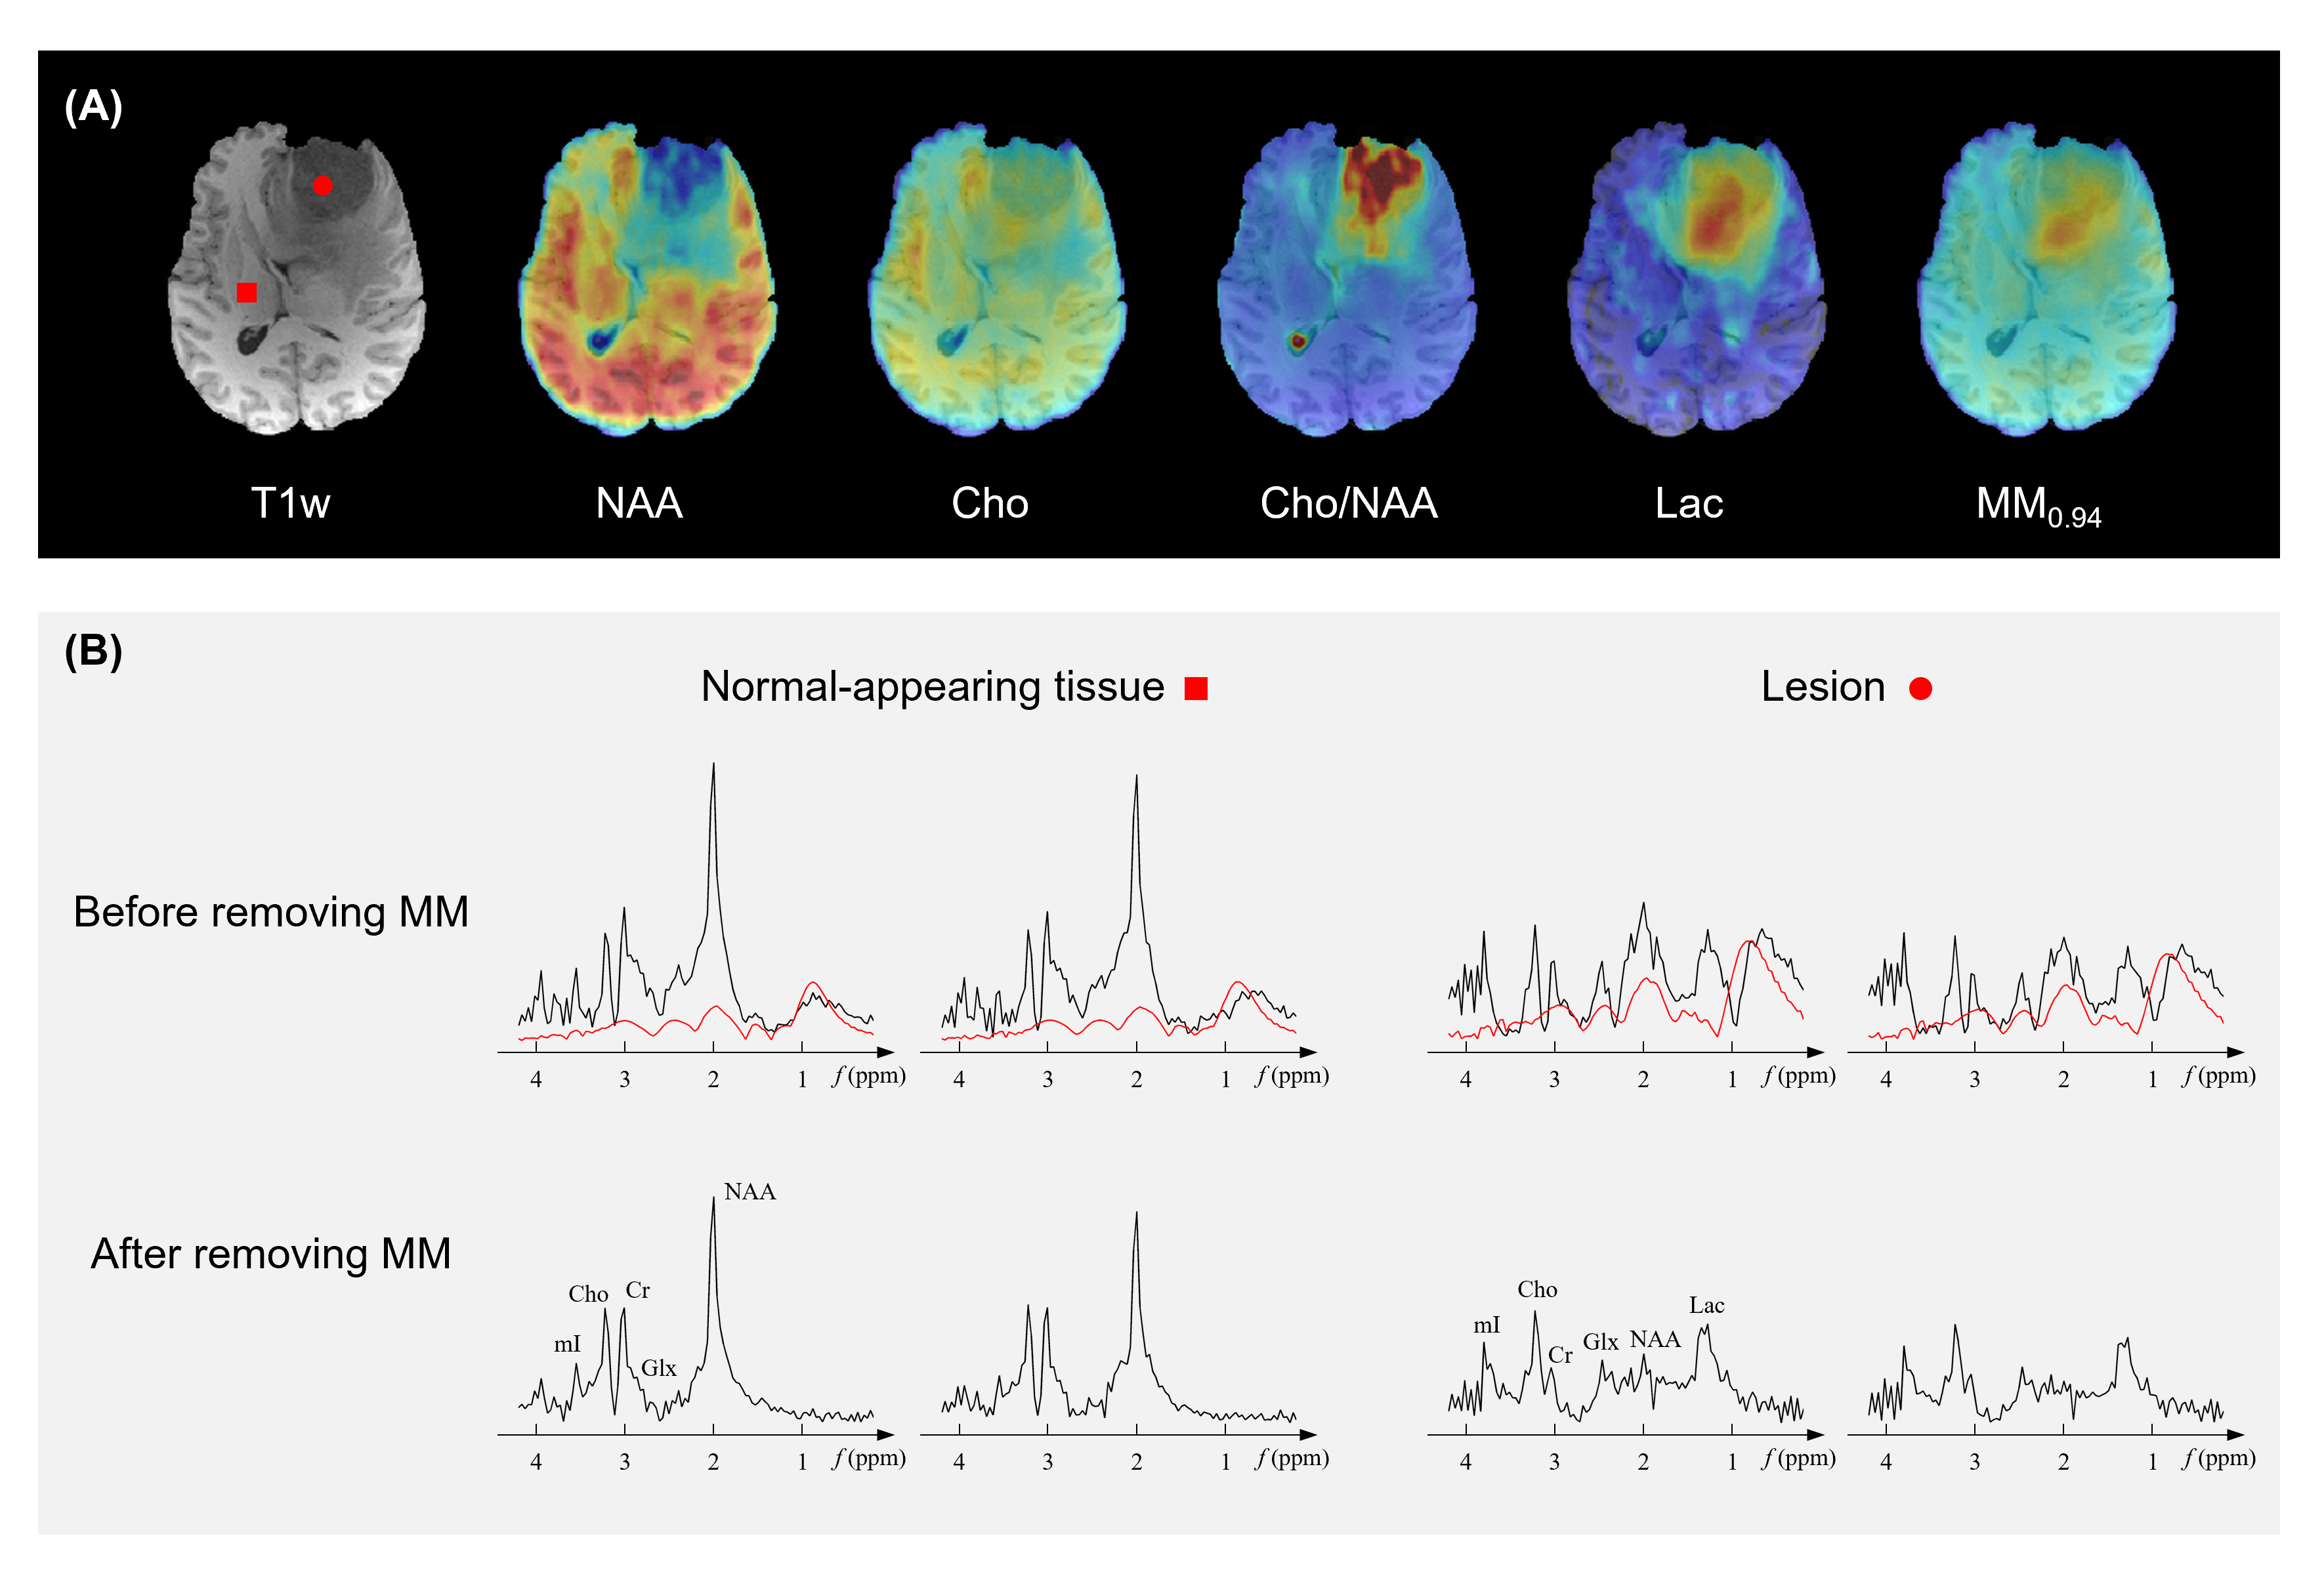
Figure 3 shows the results from simulated tumor data in a Monte Carlo study. As can be seen, the proposed method produced the best results, both qualitatively and quantitatively. Note that the proposed method yielded about ten-fold higher precision in estimating MM signals than the conventional nonlinear fitting algorithm (Subtract-QUEST15).Figures 4 and 5 show the representative results from healthy and brain tumor subjects, respectively. All experimental data were acquired on a 3T scanner (MAGNETOM Prisma, Siemens Healthcare, Erlangen, Germany) with a non-water-suppressed and non-lipid-suppressed, short-TR and ultrashort-TE 3D FID-MRSI-based sequence4 (TR/TE = 160/1.6 ms, FOV = 240 × 240 × 72 mm3, resolution = 3.0 × 2.0 × 3.0 mm3, scan time = 11.4 min).
From healthy subject test-retest data acquired at two sites (10 datasets), we obtained highly reproducible metabolite and MM maps and spectra. Gray and white matter masks of four main lobes were segmented based on T1-weighted anatomical images, and macromolecule concentrations in these masks were analyzed in the Bland-Altman plot. No significant bias was found between MM signals from two experiments (P=0.454).
Substantially altered metabolic profiles were observed in the tumor lesion. The MM-removed Cho/NAA ratio and lactate maps clearly delineated the lesion. Note that in the lesion spectra, elevated lactate and reduced NAA signals became much more prominent after removing macromolecule signals.
Conclusions
A novel method has been proposed for separating macromolecules and metabolites in ultrashort-TE MRSI data, leveraging spectral prior information in the form of pre-learned spectral bases and coefficient distributions aided with long-TE navigator signals. The proposed method has been validated using experimental data, producing high-quality and reproducible MM maps in healthy and tumor subjects.Acknowledgements
No acknowledgement found.References
1. Peng X, Lam F, Li Y, Clifford B, Liang Z-P. Simultaneous QSM and metabolic imaging of the brain using SPICE. Magn Reson Med. 2018;79: 13–21.
2. Hangel G, Strasser B, Považan M, et al. Ultra-high resolution brain metabolite mapping at 7T by short-TR Hadamard-encoded FID-MRSI. NeuroImage. 2018;168: 199–210.
3. Nassirpouur S, Chang P, Henning A. High and ultra-high resolution metabolite mapping of the human brain using 1H FID MRSI at 9.4T. NeuroImage. 2018;168: 211–221.
4. Guo R, Zhao Y, Li Y, Li Y, Liang Z-P. Simultaneous metabolic and functional imaging of the brain using SPICE. Magn Reson Med. 2019;82: 1993–2002.
5. Klauser A, Courvoisier S, Kasten J, et al. Fast high-resolution brain metabolite mapping on a clinical 3T MRI by accelerated 1H-FID-MRSI and low-rank constrained reconstruction. Magn Reson Med. 2019;81: 2841–2857.
6. Moser P, Eckstein K, Hingerl L, et al. Intra-session and inter-subject variability of 3D-FID-MRSI using single-echo volumetric EPI navigators at 3T. Magn Reson Med. 2020;83: 1920–1929.
7. Hangel G, Cadrien C, Lazen P, et al. High-resolution metabolic imaging of high-grade gliomas using 7T-CRT-FID-MRSI. NeuroImage: Clinical. 2020;28: 102433.
8. Hangel G, Spurny-Dworak B, Lazen P, et al. Inter-subject stability and regional concentration estimates of 3D-FID-MRSI in the human brain at 7T. NMR in Biomedicine. 2021;34(12): e4596.
9. Cudalbu C, Mlynárik V, Gruetter R. Contribution of macromolecules to brain 1H MR spectra: Experts' consensus recommendations. NMR in Biomedicine. 2021;34(5): e4393.
10. Cudalbu C, Behar KL, Bhattacharyya PK, et al. Handling macromolecule signals in the quantification of the neurochemical profile. J Alzheimers Dis. 2012;S3: S101–S115.
11. Schaller B, Xin L, Cudalbu C, Gruetter R. Quantification of the neurochemical profile using simulated macromolecule resonances at 3T. NMR in Biomedicine. 2013;26(5): 593–599.
12. Považan M, Hangel G, Strasser B, et al. Mapping of brain macromolecules and their use for spectral processing of 1H-MRSI data with an ultra-short acquisition delay at 7T. NeuroImage. 2015;121: 126–135.
13. Birch R, Peet AC, Dehghani H, Wilson M. Influence of macromolecule baseline on 1H MR spectroscopic imaging reproducibility. Magn Reson Med. 2017;77(1): 34–43.
14. Provencher SW. Estimation of metabolite concentrations from localized in vivo proton NMR spectra. Magn Reson Med. 1993;30: 672–679.
15. Ratiney H, Coenradie Y, Cavassila S, Ormondt D, Graveron-Demilly D. Time-domain quantitation of 1H short echo-time signals: Background accommodation. MAGMA Magn Reson Mater Phys, Biol Med. 2014;16(6): 284–296.
16. Lee HH, Kim H. Parameterization of spectral baseline directly from short echo time full spectra in 1H-MRS. Magn Reson Med. 2017;78(3): 836–847.
17. Lee HH, Kim H. Intact metabolite spectrum mining by deep learning in proton magnetic resonance spectroscopy of the brain. Magn Reson Med. 2019;82(1): 33–48.
18. Lee HH, Kim H. Deep learning‐based target metabolite isolation and big data‐driven measurement uncertainty estimation in proton magnetic resonance spectroscopy of the brain. Magn Reson Med. 2020;84(4): 1689–1706.
19. Li Y, Wang Z, Lam F. Separation of metabolite and macromolecule signals for 1H-MRSI using learned nonlinear models. IEEE ISBI. 2020; 1–4.
20. Li Y, Wang Z, Sun R, Lam F. Separation of metabolites and macromolecules for short-TE 1H-MRSI using learned component-specific representations. IEEE TMI. 2021;40(4): 1157–1167.
21. Antun V, Renna F, Poon C, Adcock B, Hansen AC. On instabilities of deep learning in image reconstruction and the potential costs of AI. Proc Natl Acad Sci. 2020;117(48): 30088–30095.
22. Knoll F, Hammernik K, Kobler E, Pock T, Recht MP, Sodickson DK. Assessment of the generalization of learned image reconstruction and the potential for transfer learning. Magn Reson Med. 2019;81(1): 116–128.
23. Liang Z-P. Spatiotemporal imaging with partially separable functions. IEEE ISBI. 2007; 988–991.
24. Ma C, Lam F, Johnson CL, Liang Z-P. Removal of nuisance signals from limited and sparse 1H MRSI data using a union-of-subspaces model. Magn Reson Med. 2016;75(2): 488–497.
25. Li Y, Lam F, Clifford B, Liang Z-P. A subspace approach to spectral quantification for MR spectroscopic imaging. IEEE TBME,2017;64(10): 2486–2489.
26. Lam F, Li Y, Guo R, Clifford B, Liang Z-P. Ultrafast magnetic resonance spectroscopic imaging using SPICE with learned subspaces. Magn Reson Med. 2020;83(2), 377–390.
27. Li Y, Zhao Y, Guo R, et al. Machine learning-enabled high-resolution dynamic deuterium MR spectroscopic imaging. IEEE TMI, 2021;40(12), 3879–3890.
28. Bartha R, Drost DJ, Williamson PC. Factors affecting the quantification of short echo in‐vivo 1H MR spectra: Prior knowledge, peak elimination, and filtering. NMR in Biomedicine, 1999;12(4), 205–216.
29. Zhang R, Ye DH, Pa D, et al. A Gaussian mixture MRF for model-based iterative reconstruction with applications to low-dose X-ray CT. IEEE Trans Comput Imaging. 2016;2: 359–374.
30. Haldar JP, Hernando D, Song SK, Liang Z-P. Anatomically constrained reconstruction from noisy data. Magn Reson Med. 2008;59(4), 810–818.
Figures