0471
Cardiac CEST MRI under the influence of very short saturation pulses – an analysis approach1Translational Research Imaging Center, Clinic of Radiology, University of Münster, Münster, Germany, 2Heart Center Bonn, Department of Internal Medicine II, University Hospital Bonn, Bonn, Germany
Synopsis
Keywords: Data Analysis, CEST & MT
Cardiac CEST MRI in mice rely on the application of very short saturation pulses. These pulses cause disturbing signal modulation in the CEST spectrum preventing a consistent data analysis. To correct for this, an additional approach named DOSE was established in the data analysis pipeline. The DOSE-corrected analysis was validated in vitro on a glucose concentration series as well as in vivo on cardiac glucoCEST experiments of nine healthy mice. Hereby, oscillations in the CEST spectra could be reduced substantially ensuring a consistent quantification.
INTRODUCTION
Chemical Exchange Saturation Transfer (CEST) is an MRI contrast technique that allows the measurement of metabolites at low concentrations through selective saturation1. In cardiac CEST, the length of the saturation pulse is limited by the duration of the cardiac cycle, requiring very short saturation pulses in the range of 120 - 140 ms for applications in mice2. However, these pulses may lead to additional signal modulations in the CEST spectrum caused by complex, multiple Rabi oscillation effects3, convolution of saturation and excitation pulse profiles4 as well as by spatial signal variations due to fringe artifacts5.To overcome these signal contaminations, we established and validated a method named DOSE both in vitro and in vivo allowing for a consistent analysis of glucoCEST data of the murine heart.
METHODS
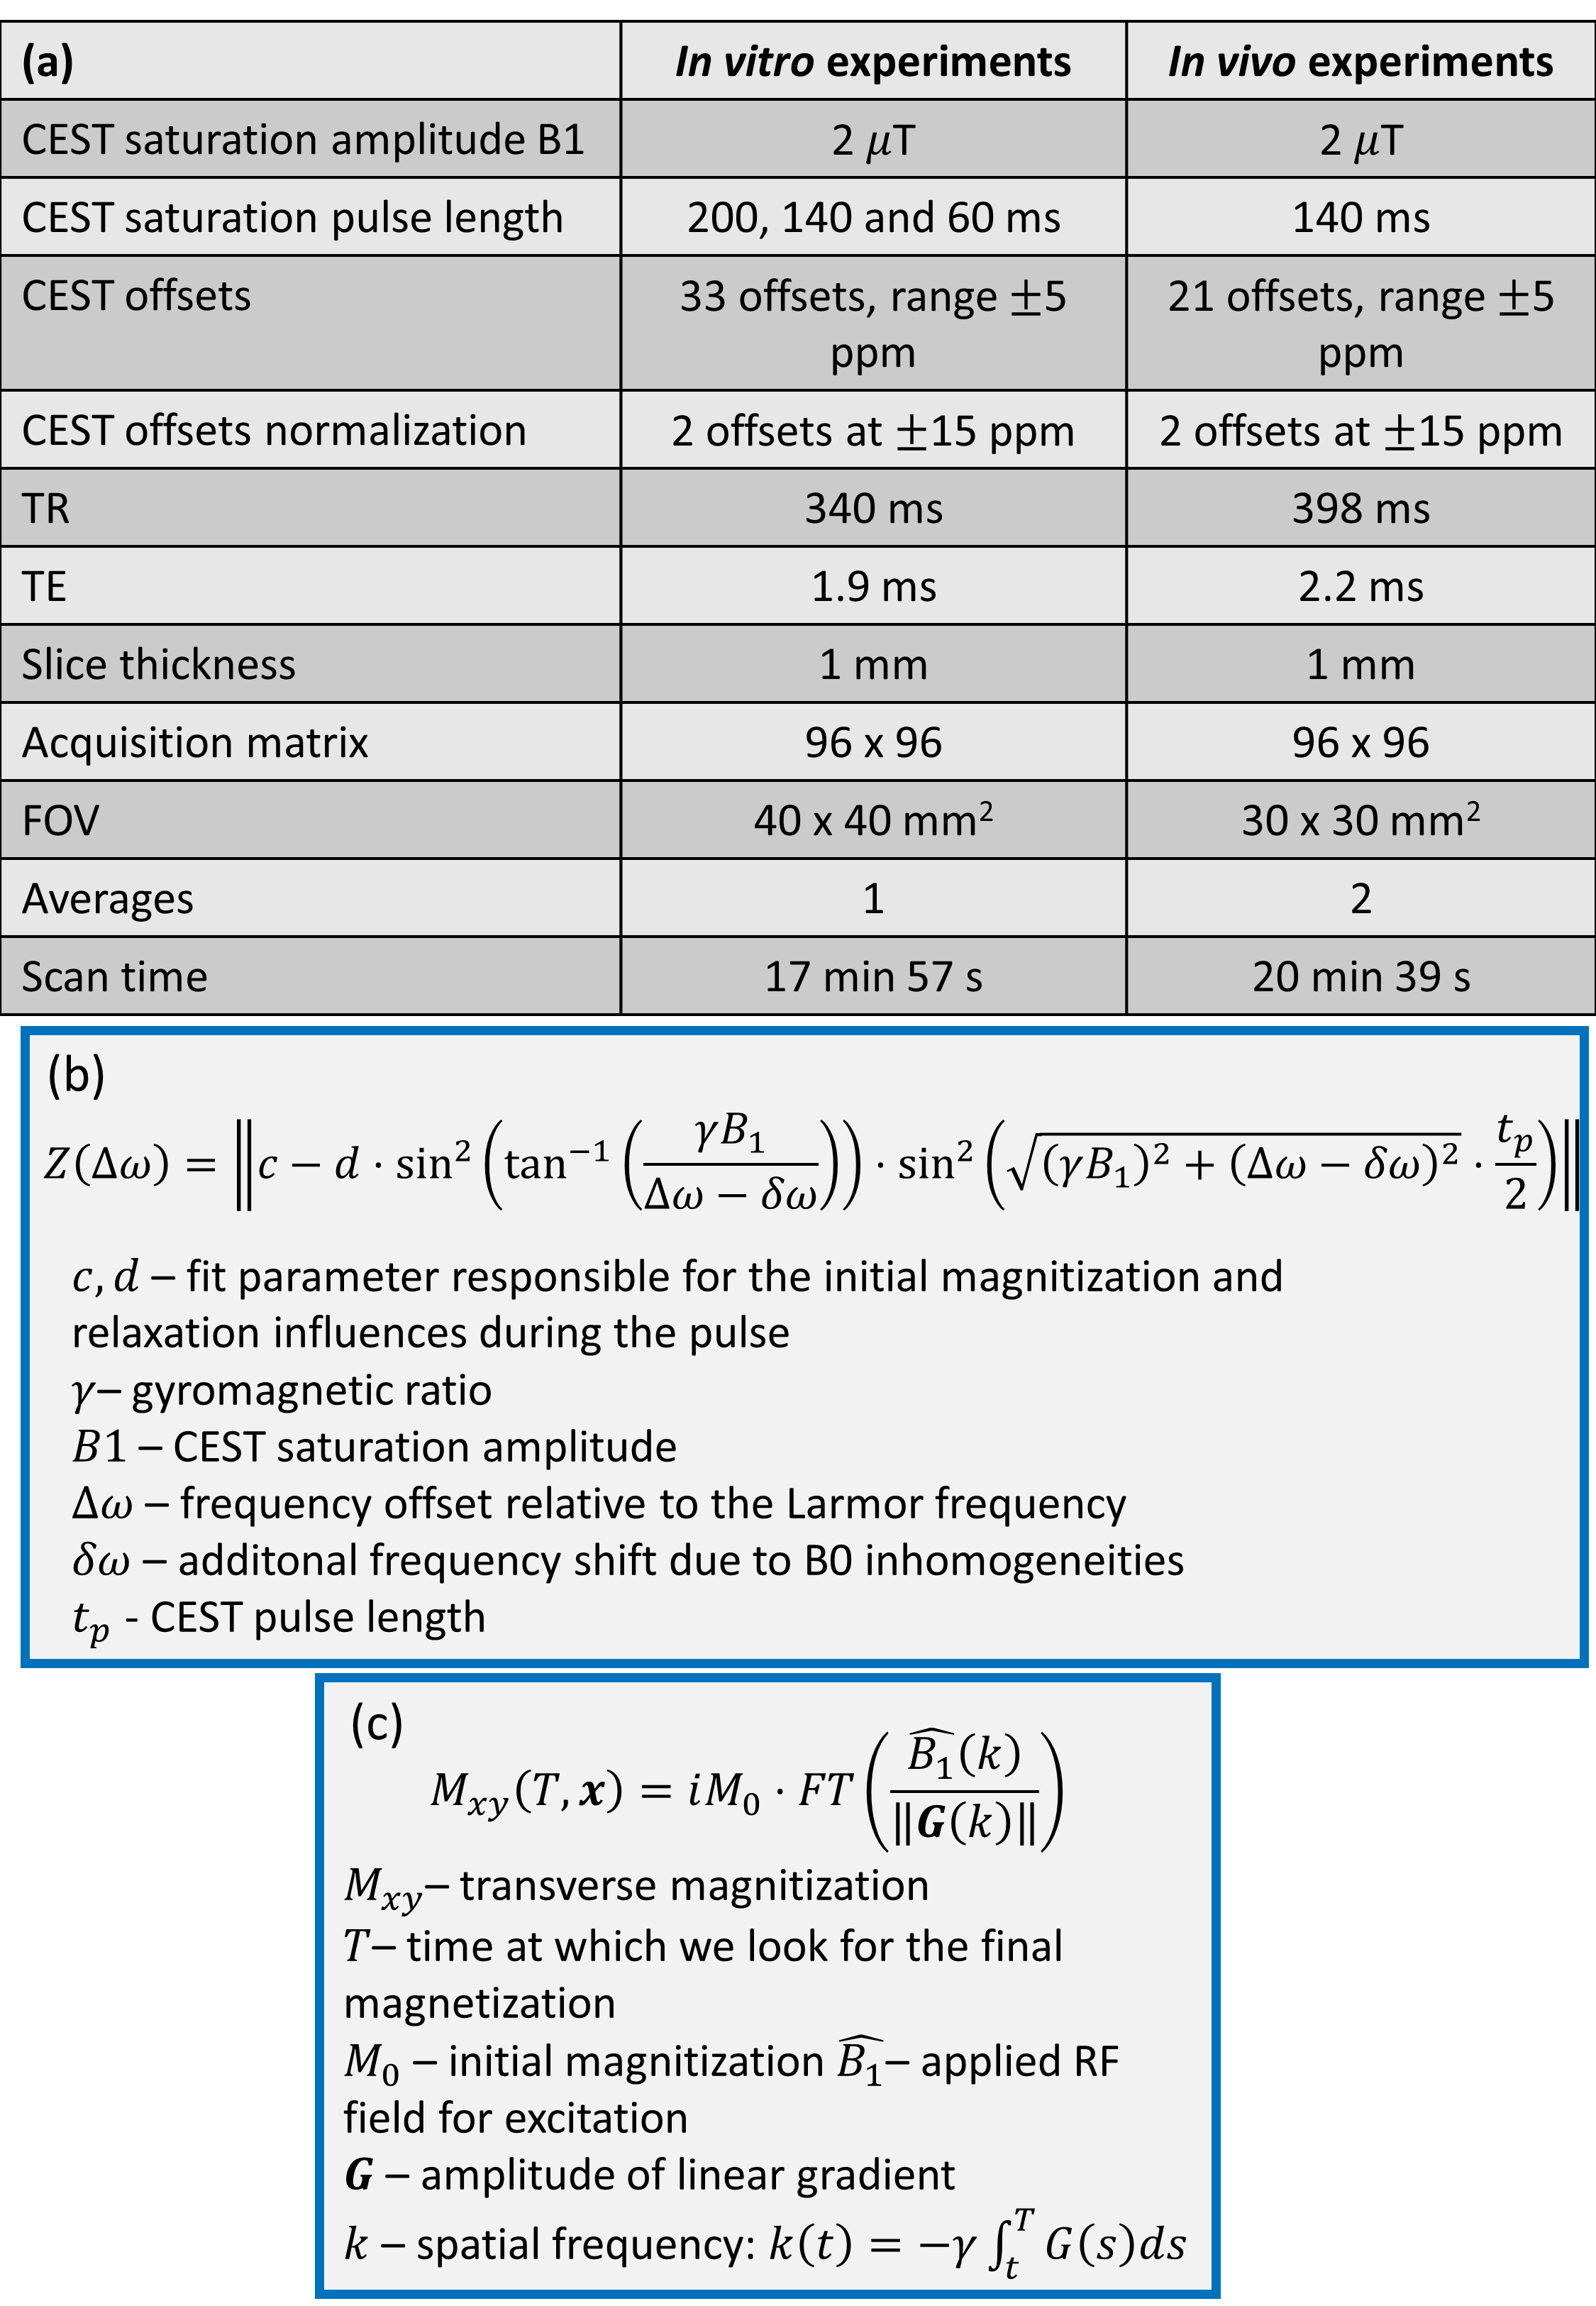
In vitro: 75, 75/2, 75/4 and 0 mM glucose solutions, dissolved in PBS and complemented with 1% agarose gel were measured at room temperature at a 9.4 T small animal MR Biospec system (Bruker) equipped with a 72 mm quadrature coil. CEST spectra were acquired with a modified FLASH sequence by using three different saturation pulse lengths (200, 140 and 60 ms).In vivo: Nine healthy mice were measured at a 9.4 T small animal MR Biospec system (Bruker) equipped with a μ-gradient system and a 35 mm quadrature coil. CEST spectra were acquired before and after i.p. glucose infusion by using a modified FLASH sequence: Each animal received two 100 μl boluses (1 M and 1.5 M glucose solution) separated by a break of 25 min; a post infusion spectrum was acquired five minutes after the second infusion. CEST and acquisition parameters are summarized in Fig. 1a.
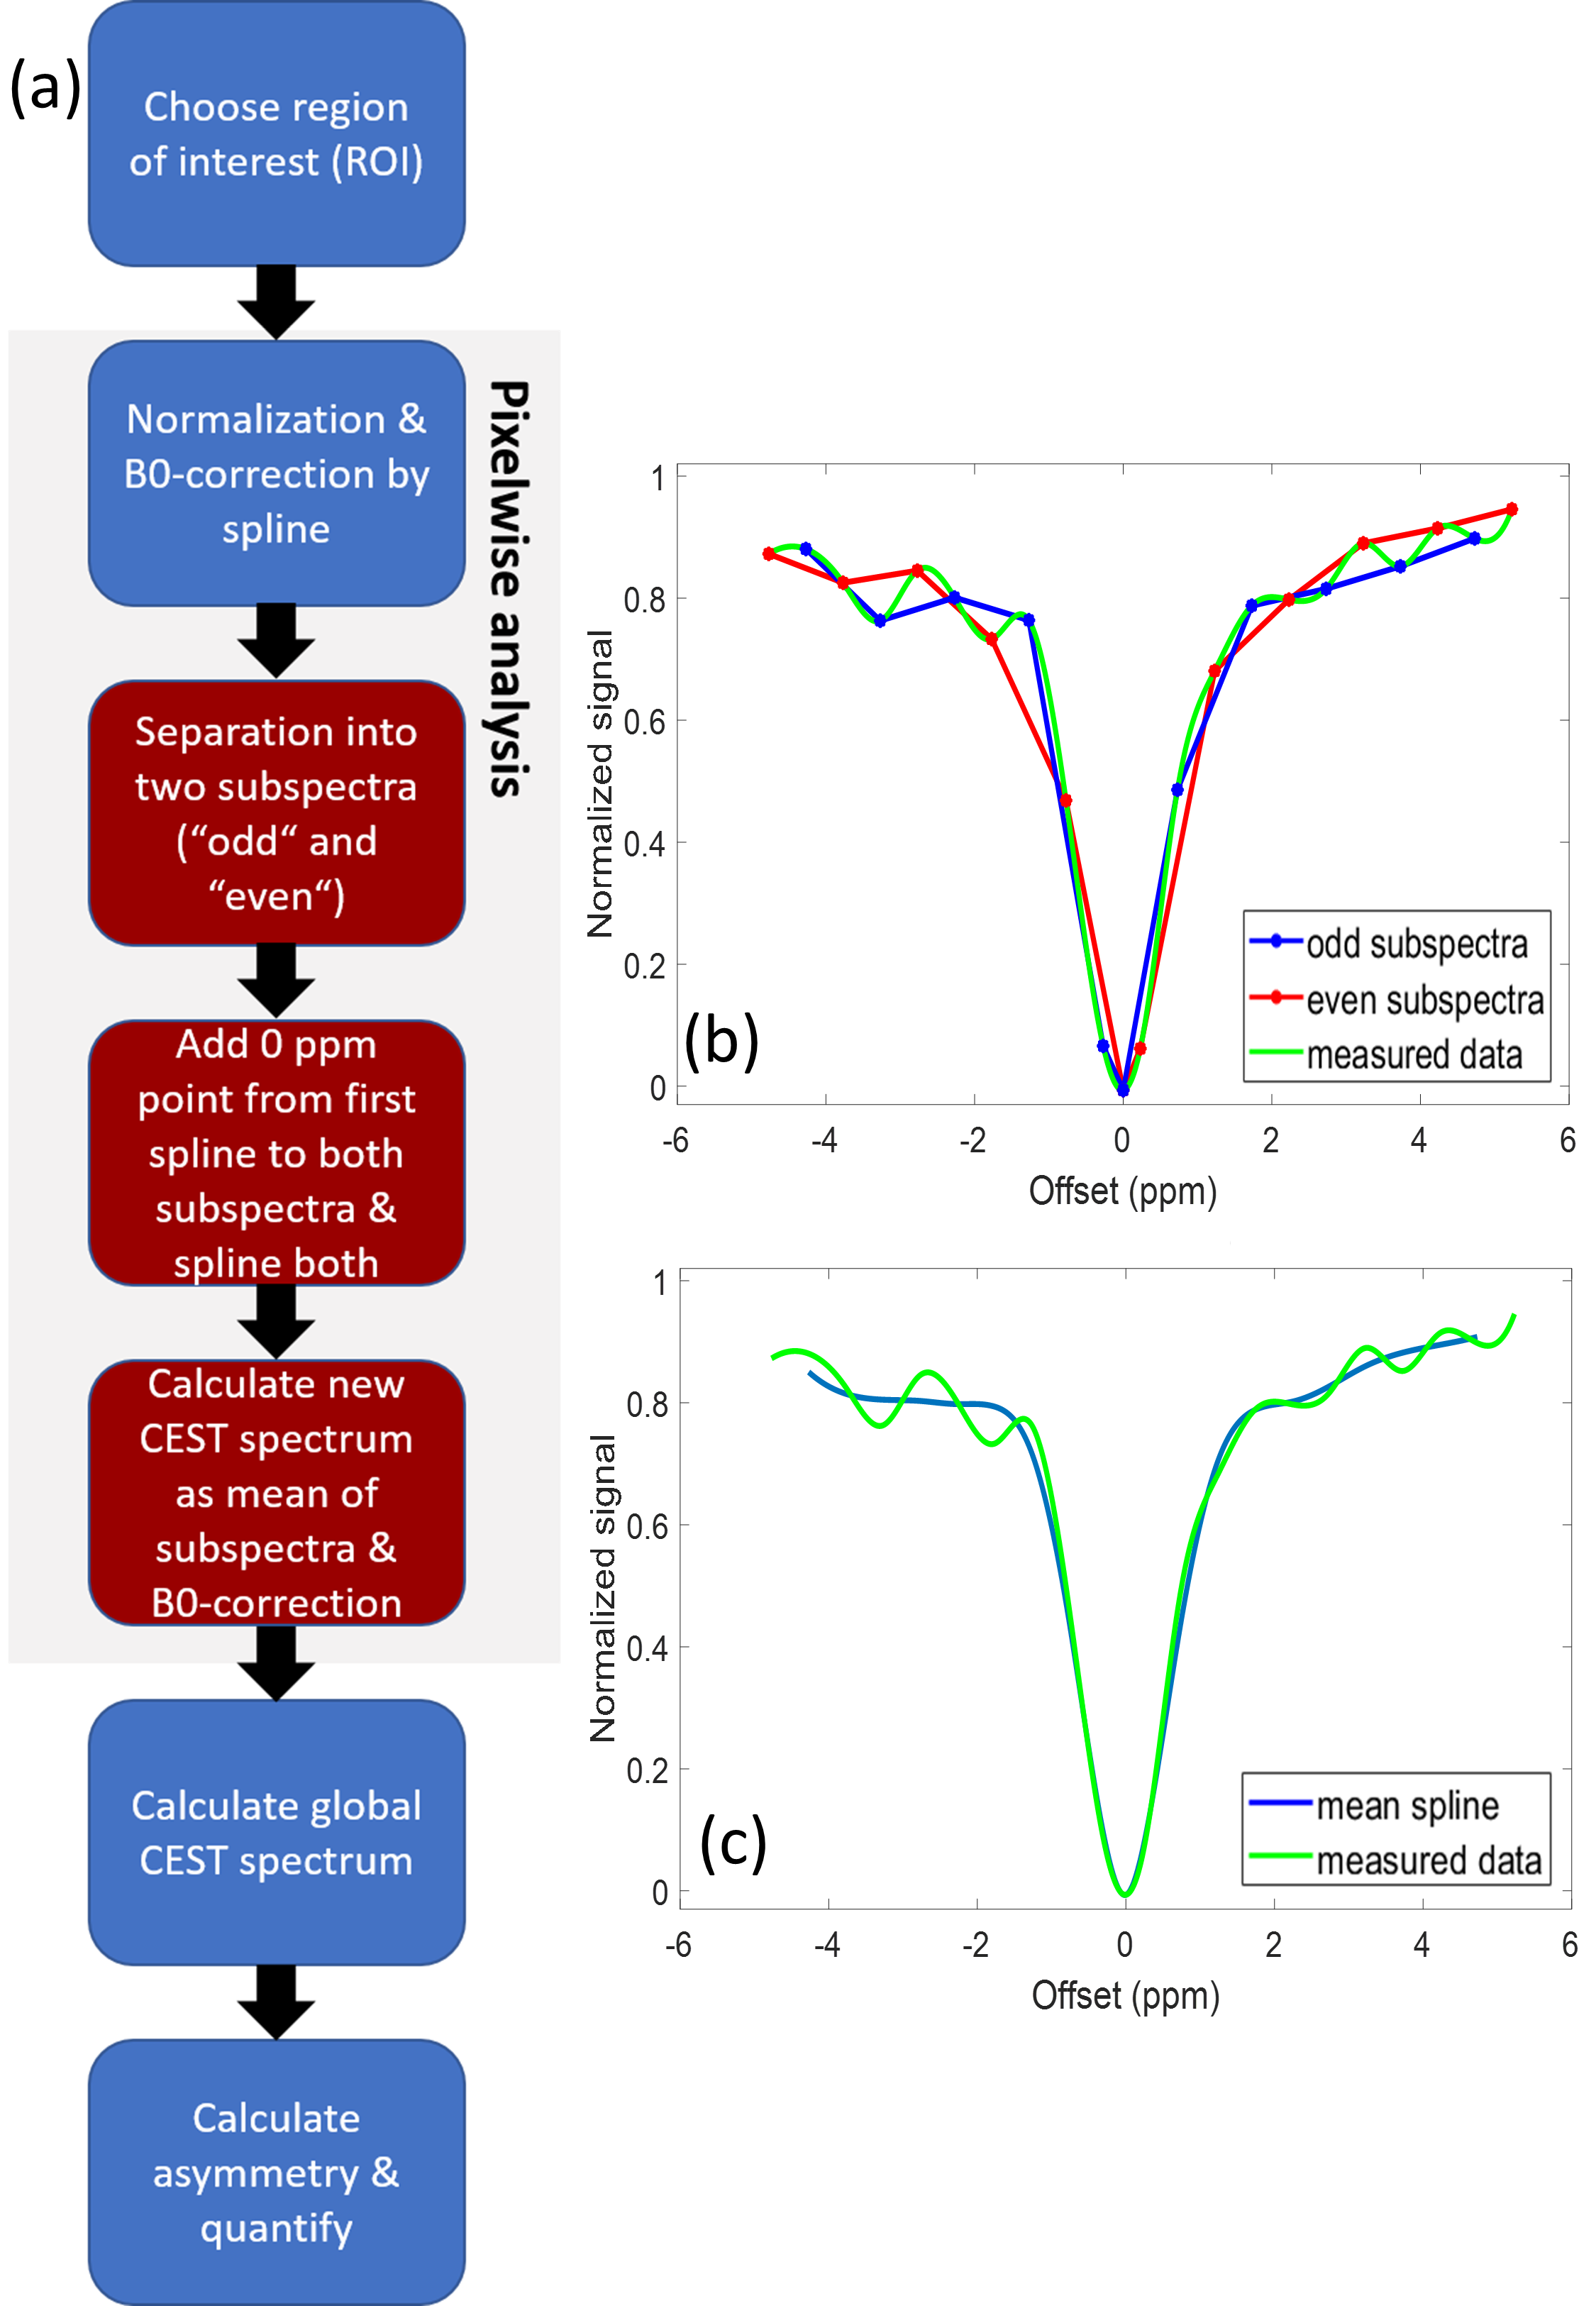
Data analysis: CEST data were analyzed by custom-written scripts in MATLAB. For each pixel, the spectrum was normalized, B0-corrected by splining and corrected for apparent signal oscillations (s. below). Based on the pixelwise spectra, a global CEST spectrum was calculated for the whole myocardium in the axial slice. For quantification, the magnetization transfer ratio (MTRasym) was calculated and glucoCEST MTRasym contrast was quantified by integration over the offset range from 1.2 to 2.2 ppm6.
DOwnsampling by SEperation of CEST spectrum into two parts (DOSE) analysis: To reduce artefacts in CEST spectra, collected data were separated into “even” and “odd” subdatasets and the B0-corrected water resonance signal value was added to both to ensure a common minimum. Then, spectra were generated for both subdataset by splining. Finally, a new CEST spectrum was calculated as the mean of both subspectra (Fig. 2).
RESULTS
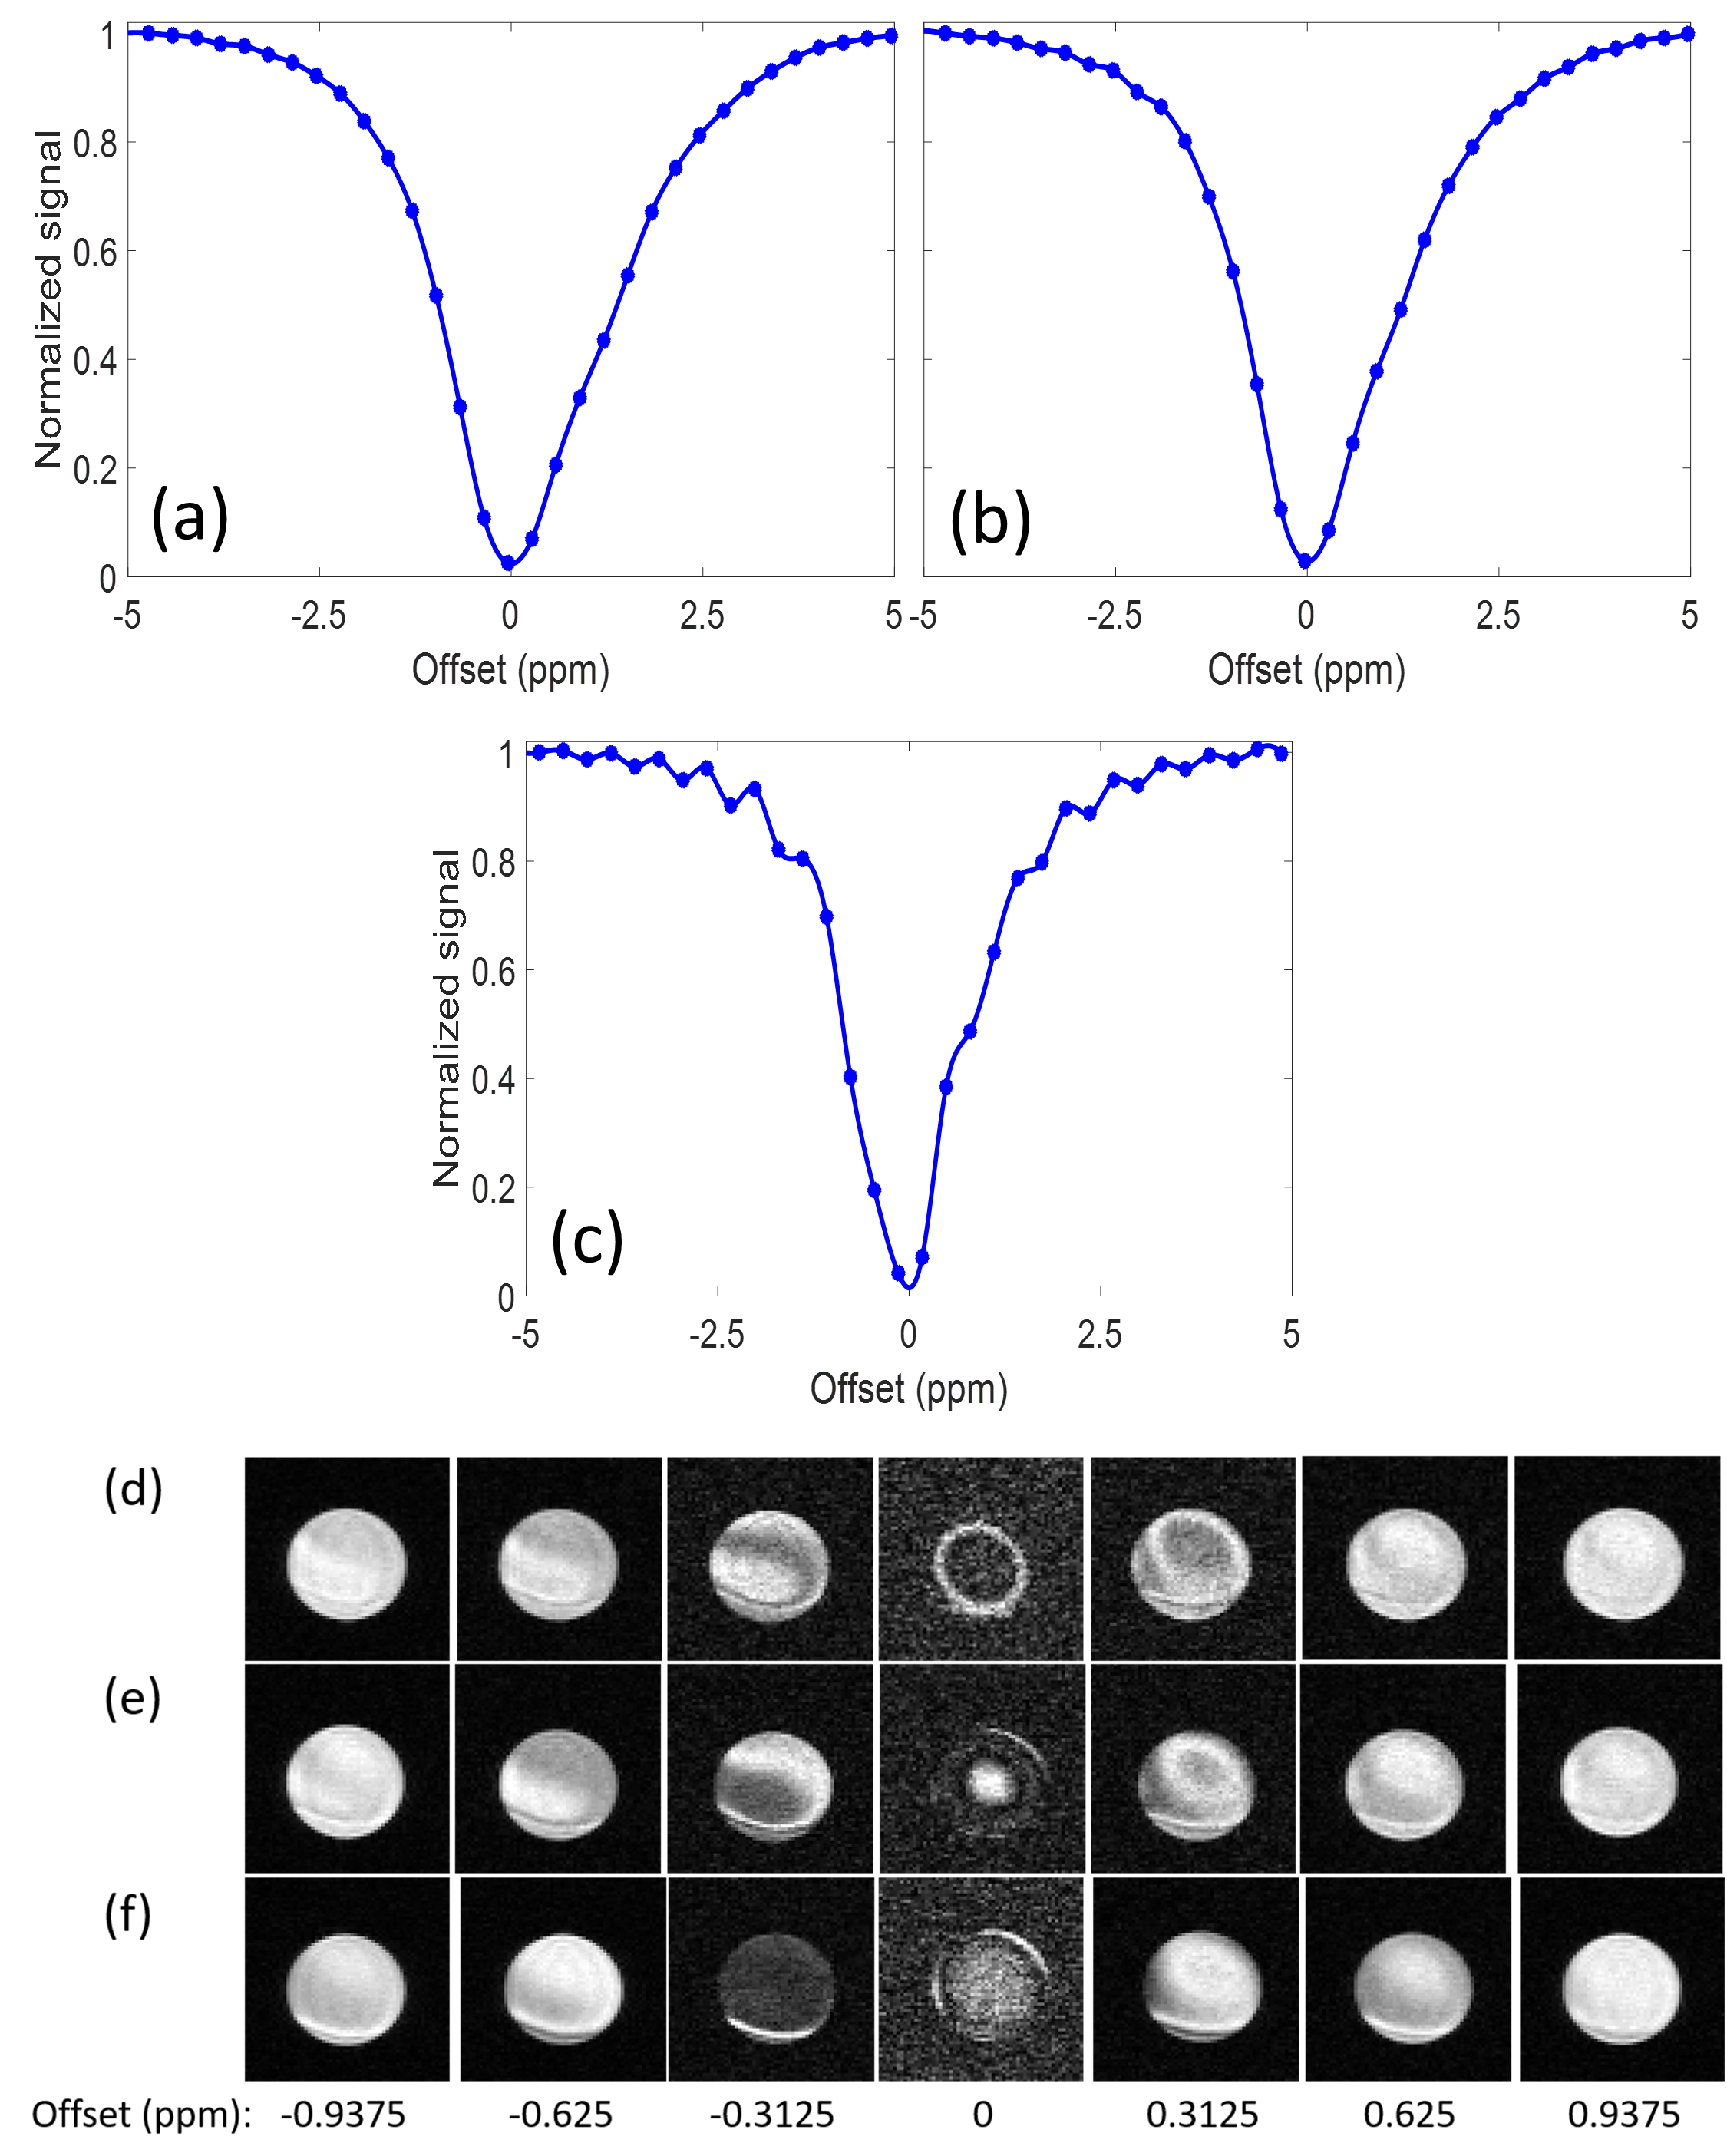
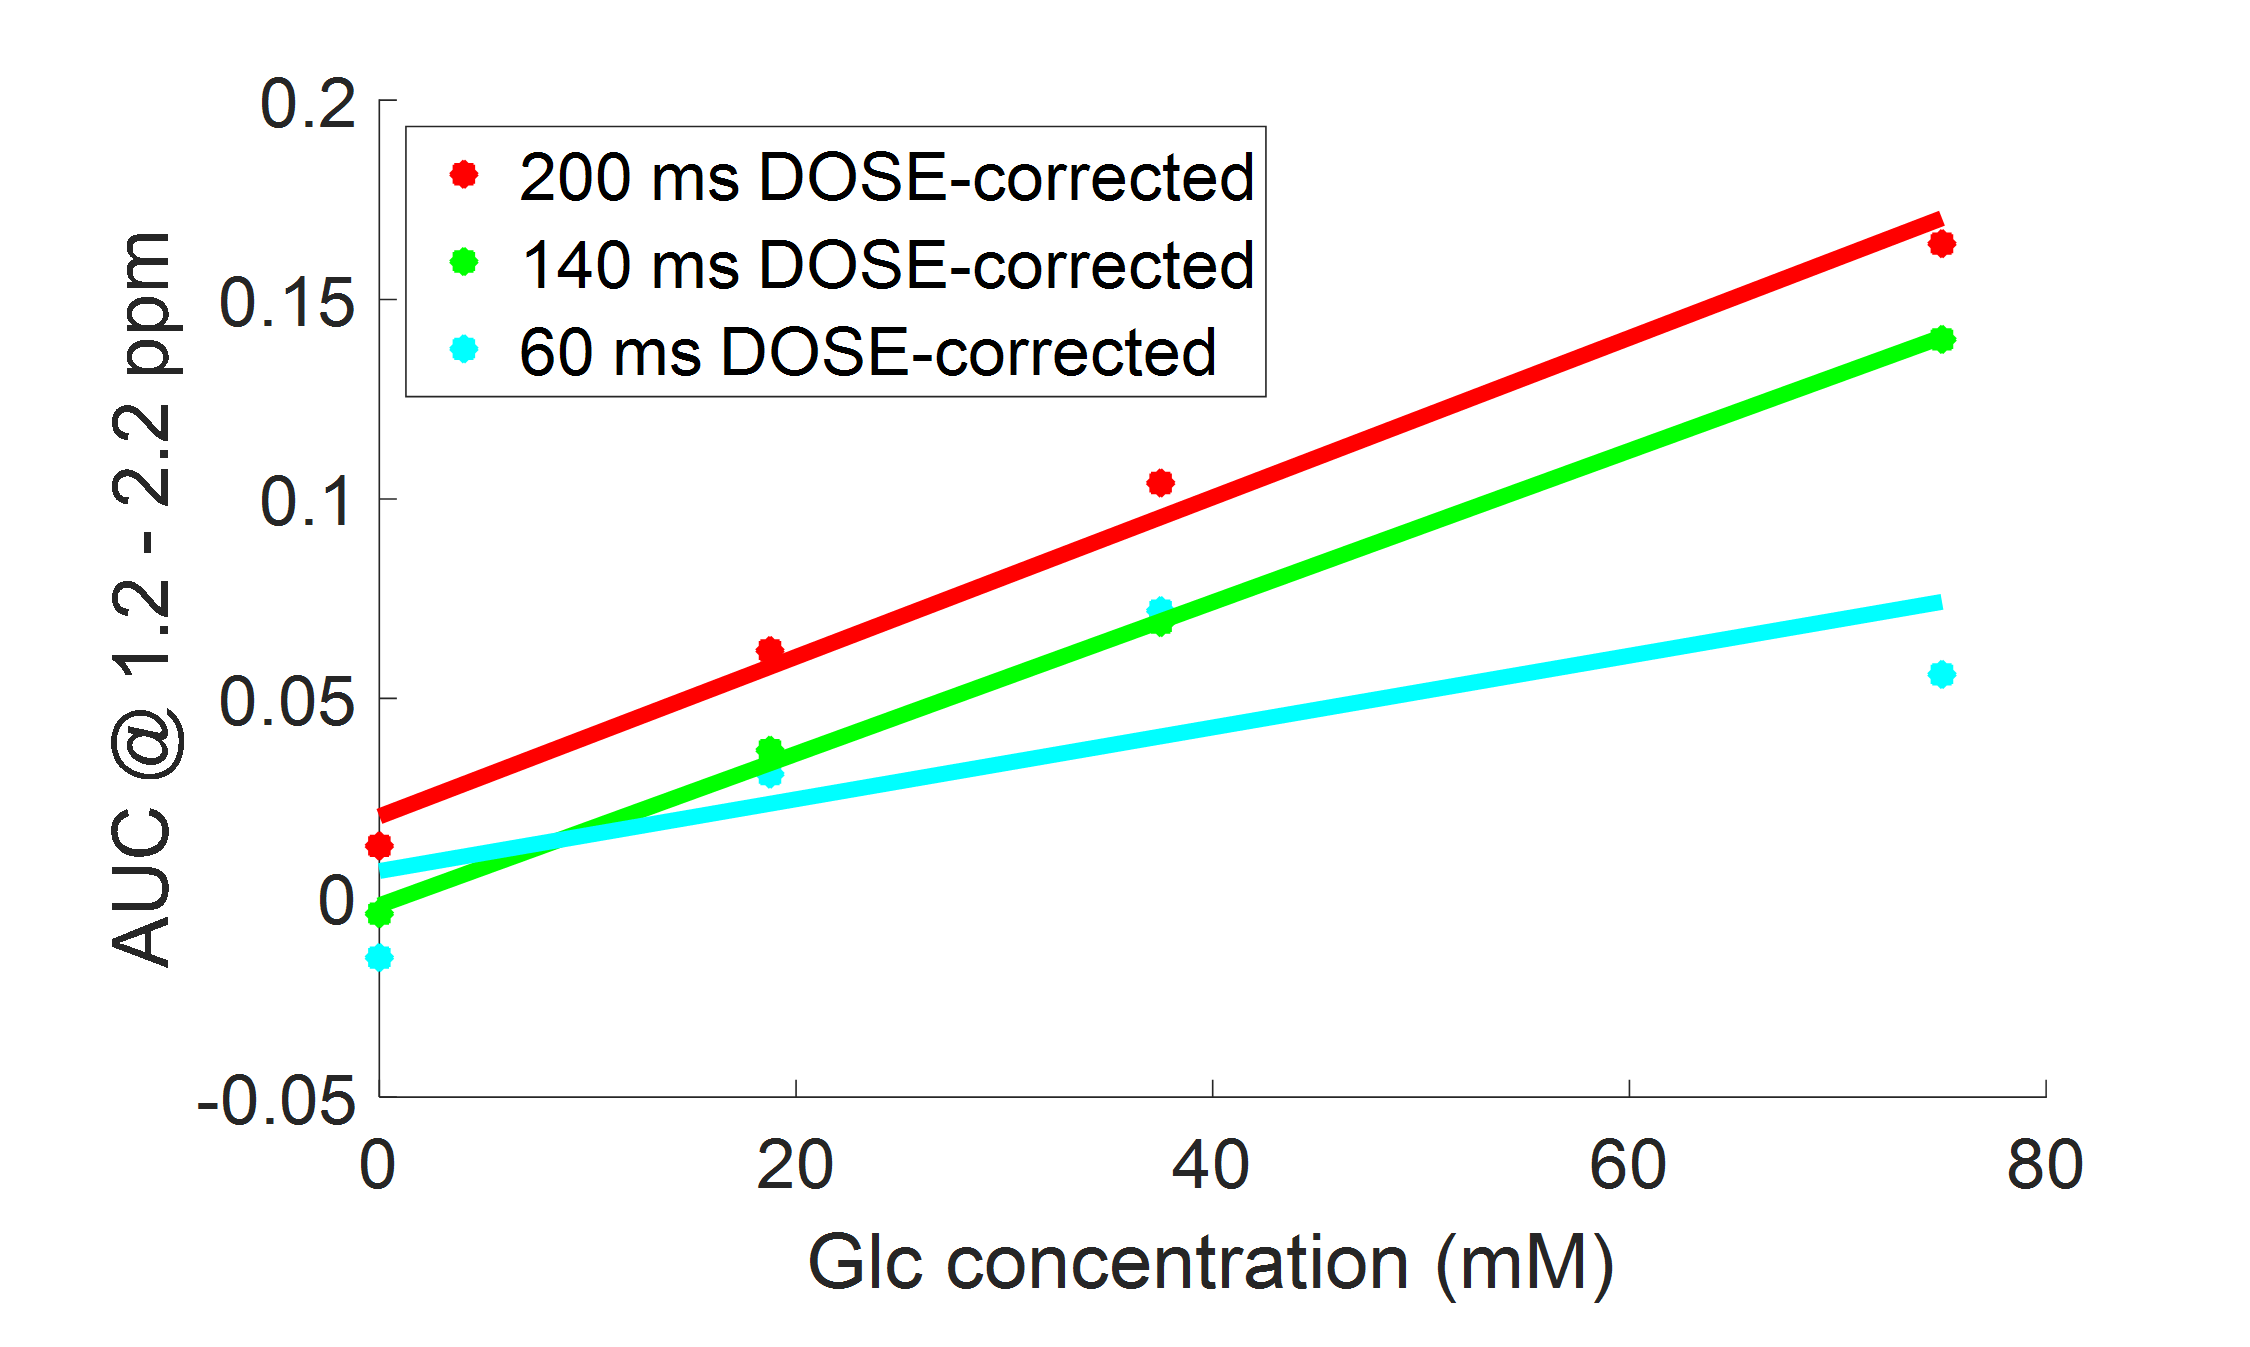
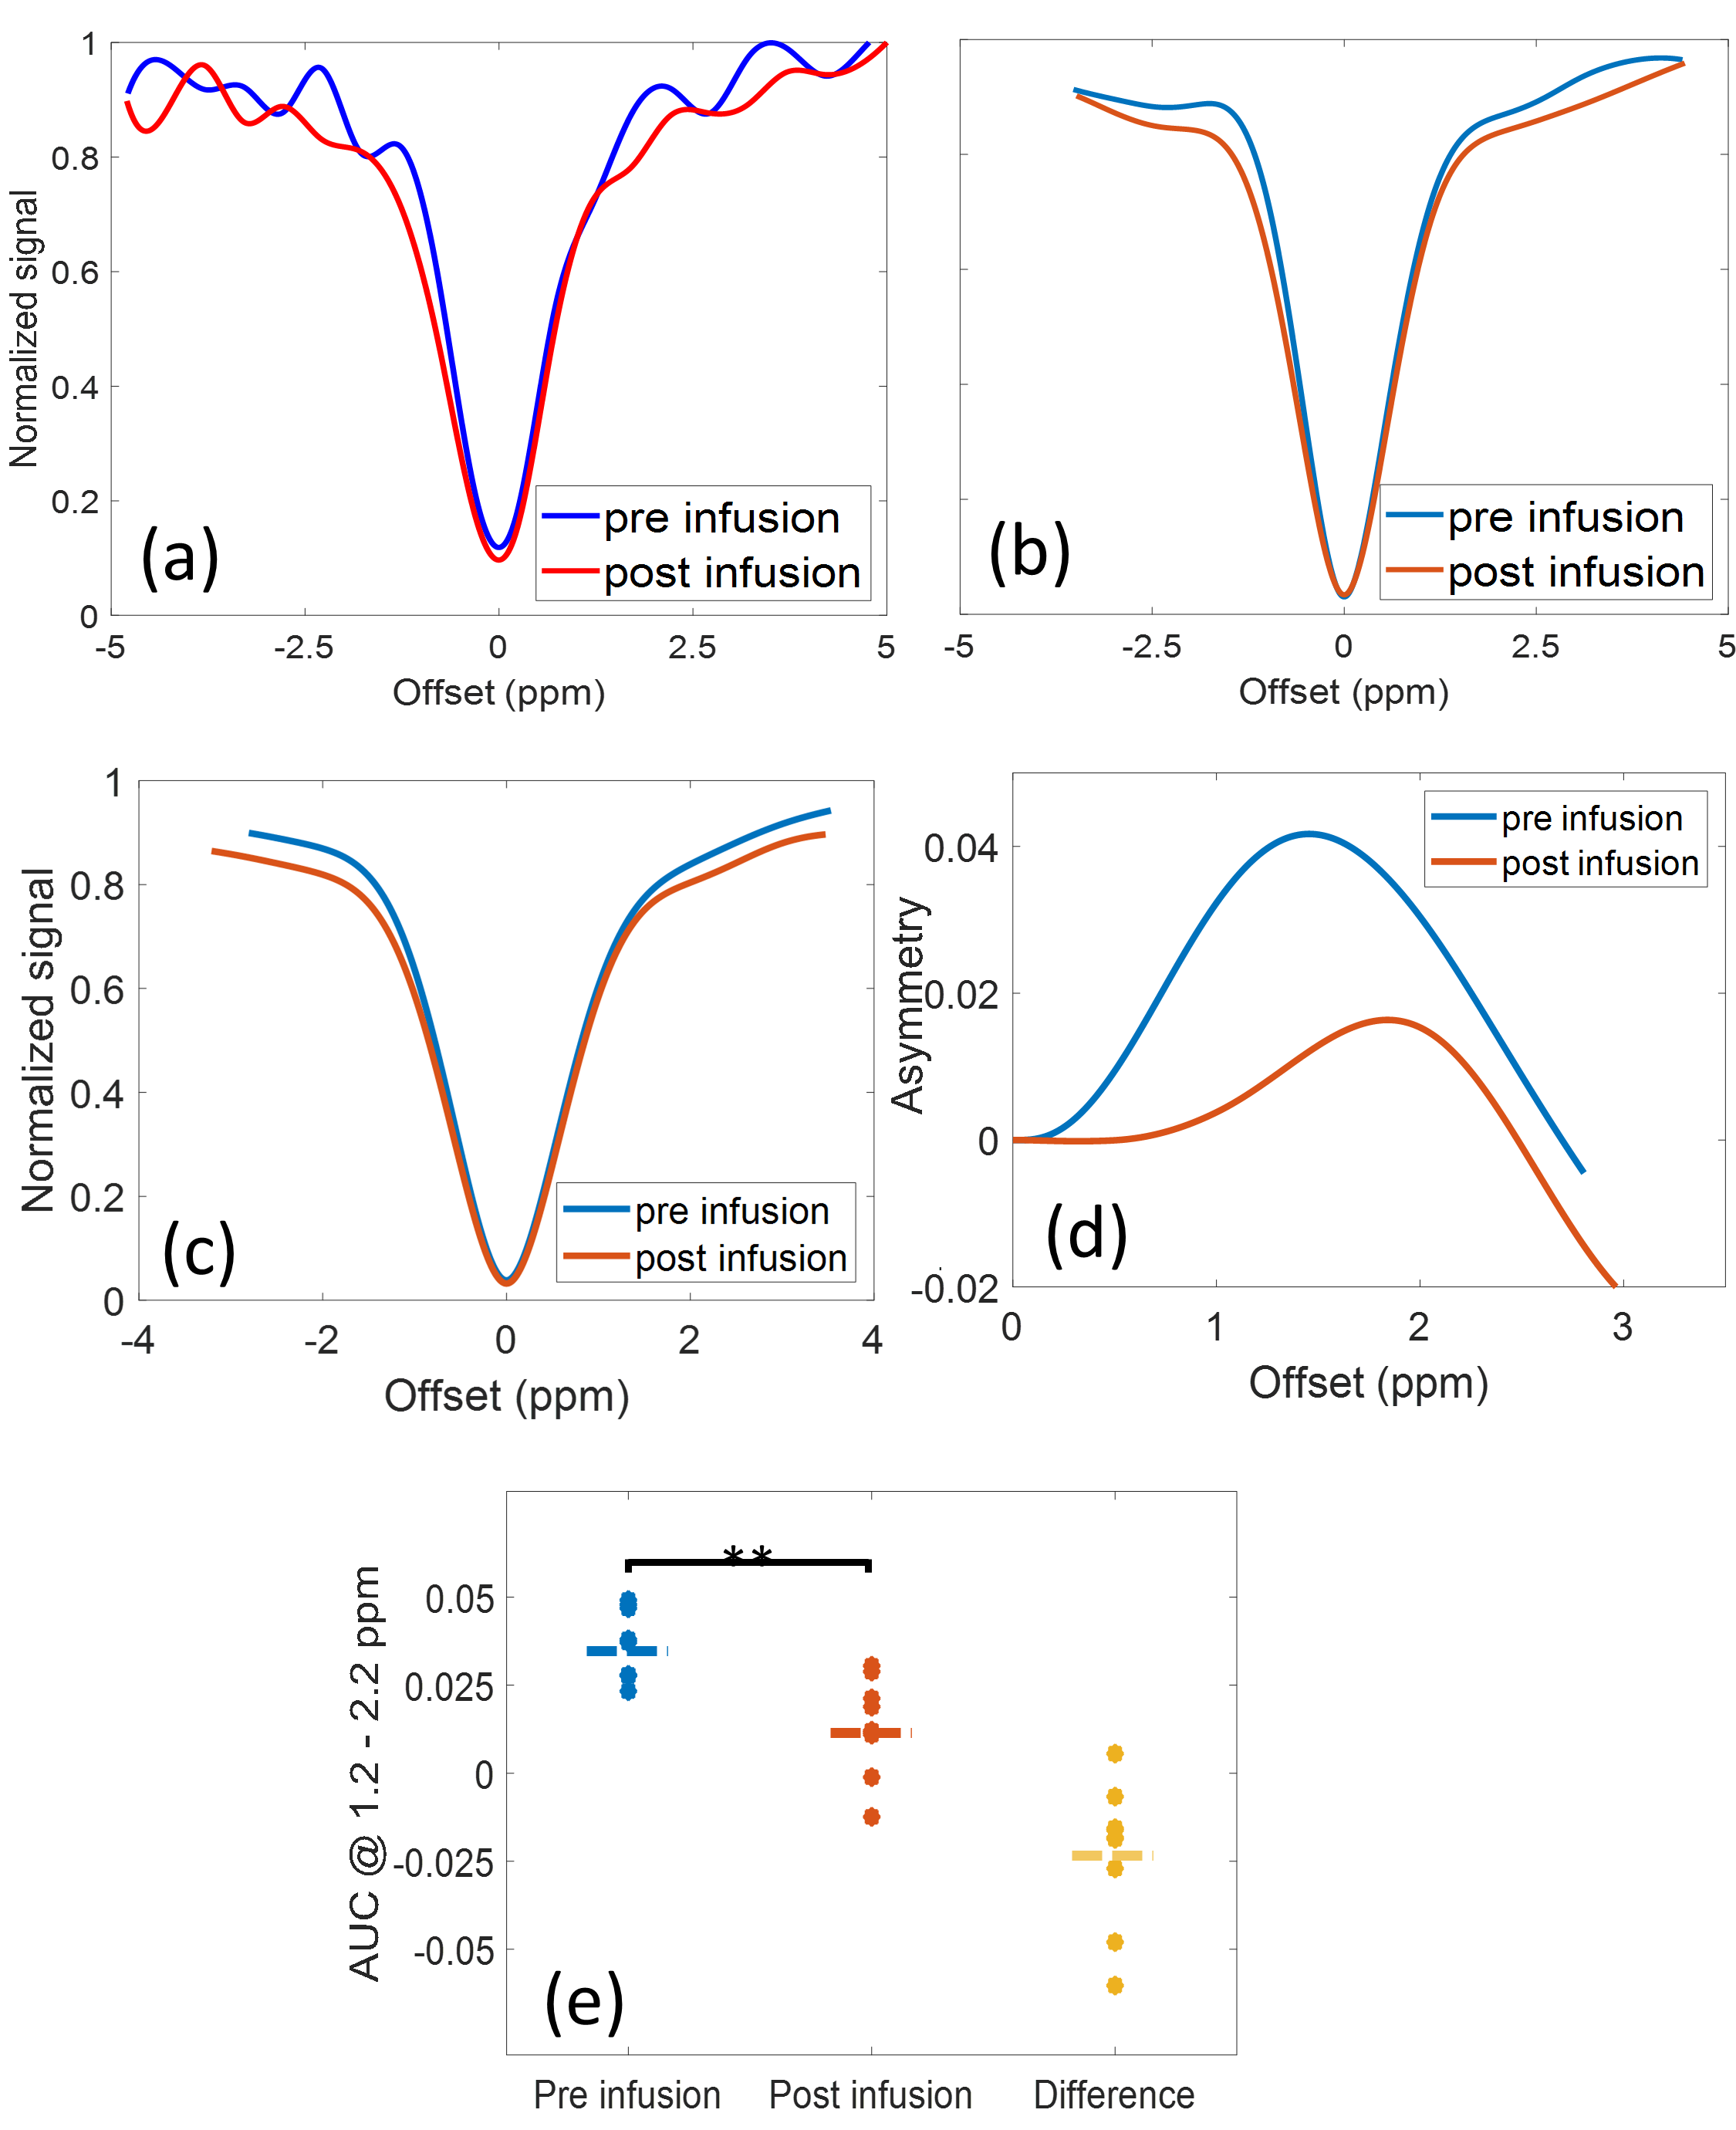
In vitro: CEST spectra of a 75 mM glucose solution showed noticeable oscillations when short saturation pulses were used (Figs. 3a-c) and corresponding MR images frequently revealed fringe artifacts (Figs. 3d-f). Applying the DOSE approach CEST spectra showed substantially reduced oscillations (Fig. 2c). A linear correlation between glucose concentration and DOSE-corrected quantification was obtained for a saturation pulse length of 200 and 140 ms (R2 > 0.98), while the oscillations at a pulse length of 60 ms were too pronounced (Fig. 4).In vivo: GlucoCEST spectra of the myocardium of healthy mice calculated by conventional MTRasym showed prominent oscillations (Fig. 5a), which were substantially reduced by the DOSE-corrected analysis (Fig. 5b). The averaged CEST spectra (Fig. 5c) of all nine animals, each corrected by the DOSE approach, revealed an increase in magnetization transfer contrast. Further, a significant decrease (p = 0.0095) in the MTRasym of glucose in the range of 1.2 - 2.2 ppm post glucose infusion was observed, indicating high glucose consumption (Figs. 5d-e).
DISCUSSION
CEST spectra acquired with short saturation pulses are superimposed by signal modulations (Figs. 3a-c, 5) which are mainly caused by convolution artifacts and Rabi oscillations induced by off-resonant irradiation. Especially in vivo, but also in vitro, multiple CEST pools are present, which resonate at slightly different Larmor frequencies. As a result, complex Rabi oscillation patterns occur, each of them inducing additional modulation of the z-magnetization (Δω-dependency). Moreover, the signal modulation depends not only on saturation and acquisition parameters but also on shimming conditions and working frequency (Fig. 1b). The oscillation amplitude strongly increases with shorter pulse length (Figs. 3a-c), which is related to a loss of coherence for longer saturation durations. Since short pulse lengths result in broad and oscillating frequency profiles, transverse magnetization may be modulated additionally by convolution with the excitation pulse (Fig. 1c). Finally, fringe artifacts cause spatial inhomogeneities which result in a heterogeneous saturation (Figs. 3d-f). The presentation of these artifacts strongly depends on shimming condition, B0-homogeneity as well as irradiation offset frequency, and is especially visible for CEST-weighted images acquired at a frequency offset close to the water resonance.The DOSE-corrected analysis, established in this study, enabled a consistent quantification of myocardial glucoCEST data, despite the interferences of different signal modulating contributors (Fig. 5). However, DOSE is limited to moderate oscillations and regular patterns (Fig. 4).
CONCLUSION
In this study we could successfully establish the DOSE-corrected analysis of CEST spectra, which were acquired with short saturation pulses. Our approach was validated both in vitro and in vivo and can be easily implemented in any standard CEST analysis pipeline allowing a conclusive quantification of cardiac CEST data.Acknowledgements
This work was supported by the Deutsche Forschungsgemeinschaft (German Research Foundation, Project-IDs 406818964 and 249895739).References
1. Ward KM, Aletras AH, Balaban RS. A new class of contrast agents for MRI based on proton chemical exchange dependent saturation transfer (CEST). J Magn Reson. 2000;143(1):79-87.
2. Constantinides C, Mean R, Janssen BJ. Effects of isoflurane anesthesia on the cardiovascular function of the C57BL/6 mouse. ILAR J. 2011;52(3):e21-e31.
3. Schuenke P, Windschuh J, Roeloffs V, Ladd ME, Bachert P, Zaiss M. Simultaneous mapping of water shift and B1 (WASABI)-Application to field-Inhomogeneity correction of CEST MRI data. Magn Reson Med. 2017;77(2):571-580.
4. Pauly J, Nishimura D, Macovski A. A k-space analysis of small-tip-angle excitation. J Magn Reson. 1989;81(1):43-56.
5. Alfudhili K, Masci PG, Delacoste J, et al. Current artefacts in cardiac and chest magnetic resonance imaging: tips and tricks. Br J Radiol. 2016;89(1062):20150987.
6. Chan KW, McMahon MT, Kato Y, et al. Natural D-glucose as a biodegradable MRI contrast agent for detecting cancer. Magn Reson Med. 2012;68(6):1764-1773.
Figures