0469
Structural covariance in subcortical regions in MS and NMOSD: An MRI-based study with automated brain volumetry1Tongji Hospital, Tongji Medical College, Huazhong University of Science and Technology, Wuhan, China
Synopsis
Keywords: Multiple Sclerosis, Multiple Sclerosis
MS and NMOSD, as two major demyelinating diseases of the CNS, both could cause brain structural volume changes. Moreover, the synergistic volume changes between brain regions can reflect the intrinsic connection network between these regions, which is helpful to further explore the underlying pathophysiological changes of the disease. Our study identified volumetric changes and structural covariance in subcortical regions in MS and NMOSD patients. Furthermore, MS and NMOSD patients had distinct patterns of anatomical connection in brain regions, which reflected the different underlying damage to brain structures in the two diseases.Introduction
Volumetric changes of brain structure may play an important role in the pathophysiology of both Multiple sclerosis (MS) and neuromyelitis optica spectrum disorders (NMOSD). Structural covariance may reflect interregional coordination during development or synchronization effects on connected regions, and this structural covariance network is associated with behavioral and cognitive abilities[1]. Previous studies have investigated network-level structural covariance in MS patients, but were mostly limited to cortical regions[2; 3]. Brain morphometric studies based on structural MRI have shown that the volumetric changes of brain structures caused by MS and NMOSD occur not only in cortical regions, but also in subcortical regions[4; 5]. And these changes in subcortical regions may be associated with demyelination and damage secondary to lesions in other brain regions. Thus, the link between structural alterations in these regions and the underlying pathophysiology of MS and NMOSD needs to be explored. In this study, we aimed to explore the volumetric changes and structural covariance of the MS and NMOSD patients in subcortical regions with an automated multi-atlas-based anatomical segmentation tool.Methods
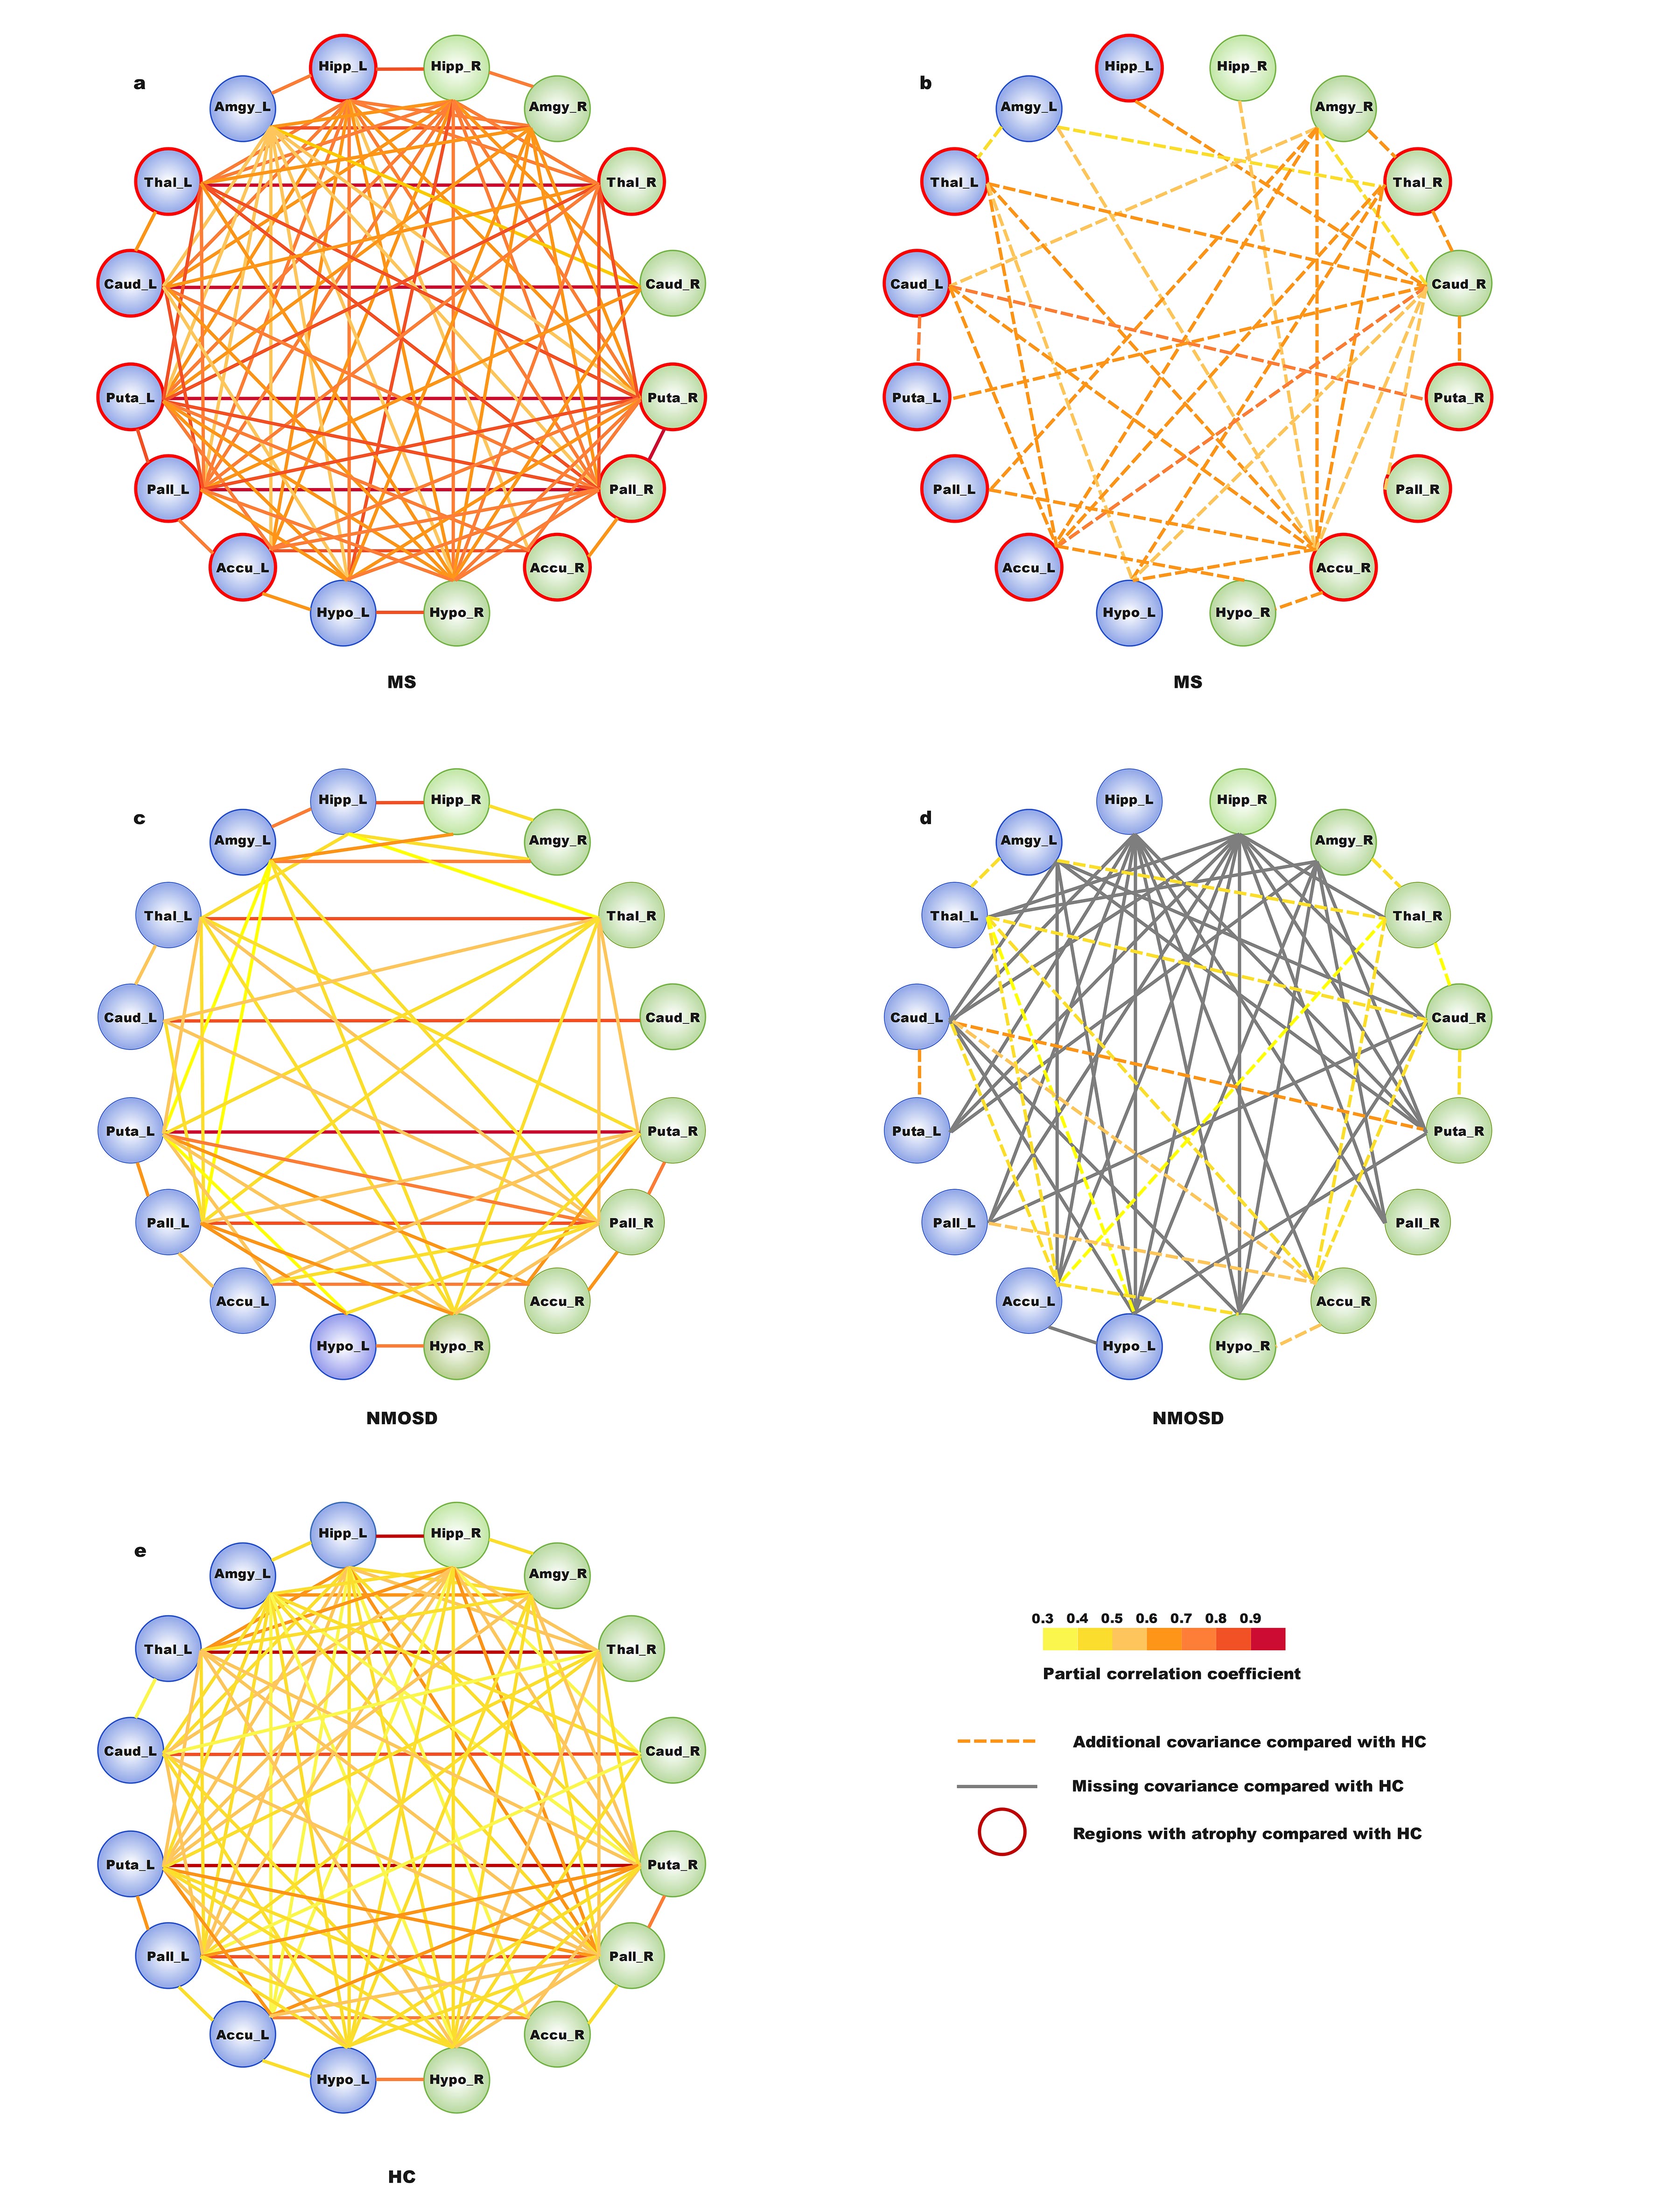
Fourty MS patients, 35 NMOSD patients and 34 healthy controls (HC) underwent 3D T1-weighted image and 3D T2 FLAIR of MRI. We recorded all volumes in typical subcortical regions and infratentorial regions obtained by AccuBrain segmentation automatically. The relative volume was defined as the brain region volume of the participant divided by the intracranial volume (ICV) of that participant as a normalization process. The volume differences in subcortical regions were compared between the MS, NMOSD, and HC groups by automated brain volumetry. Structural covariance analysis was performed with each pair of these regions to investigate the alterations of anatomical connection in MS and NMOSD compared to HC. The correlations between brain volumes in the selected regions of interest (ROIs) in each group were calculated separately. Additional structural covariance in MS patients was defined as the False Discovery Rate (FDR)-corrected ROI-ROI significant correlation in the MS group but not in the HC group. Likewise, if an ROI-ROI correlation was significant in the HC group but not in the MS group, it was defined as a missing structural covariance. For the comparison of NMOSD and HC, partial correlation analysis and volumetry-based structural covariance definitions were similar. P < 0.05 was considered statistically significant.Results
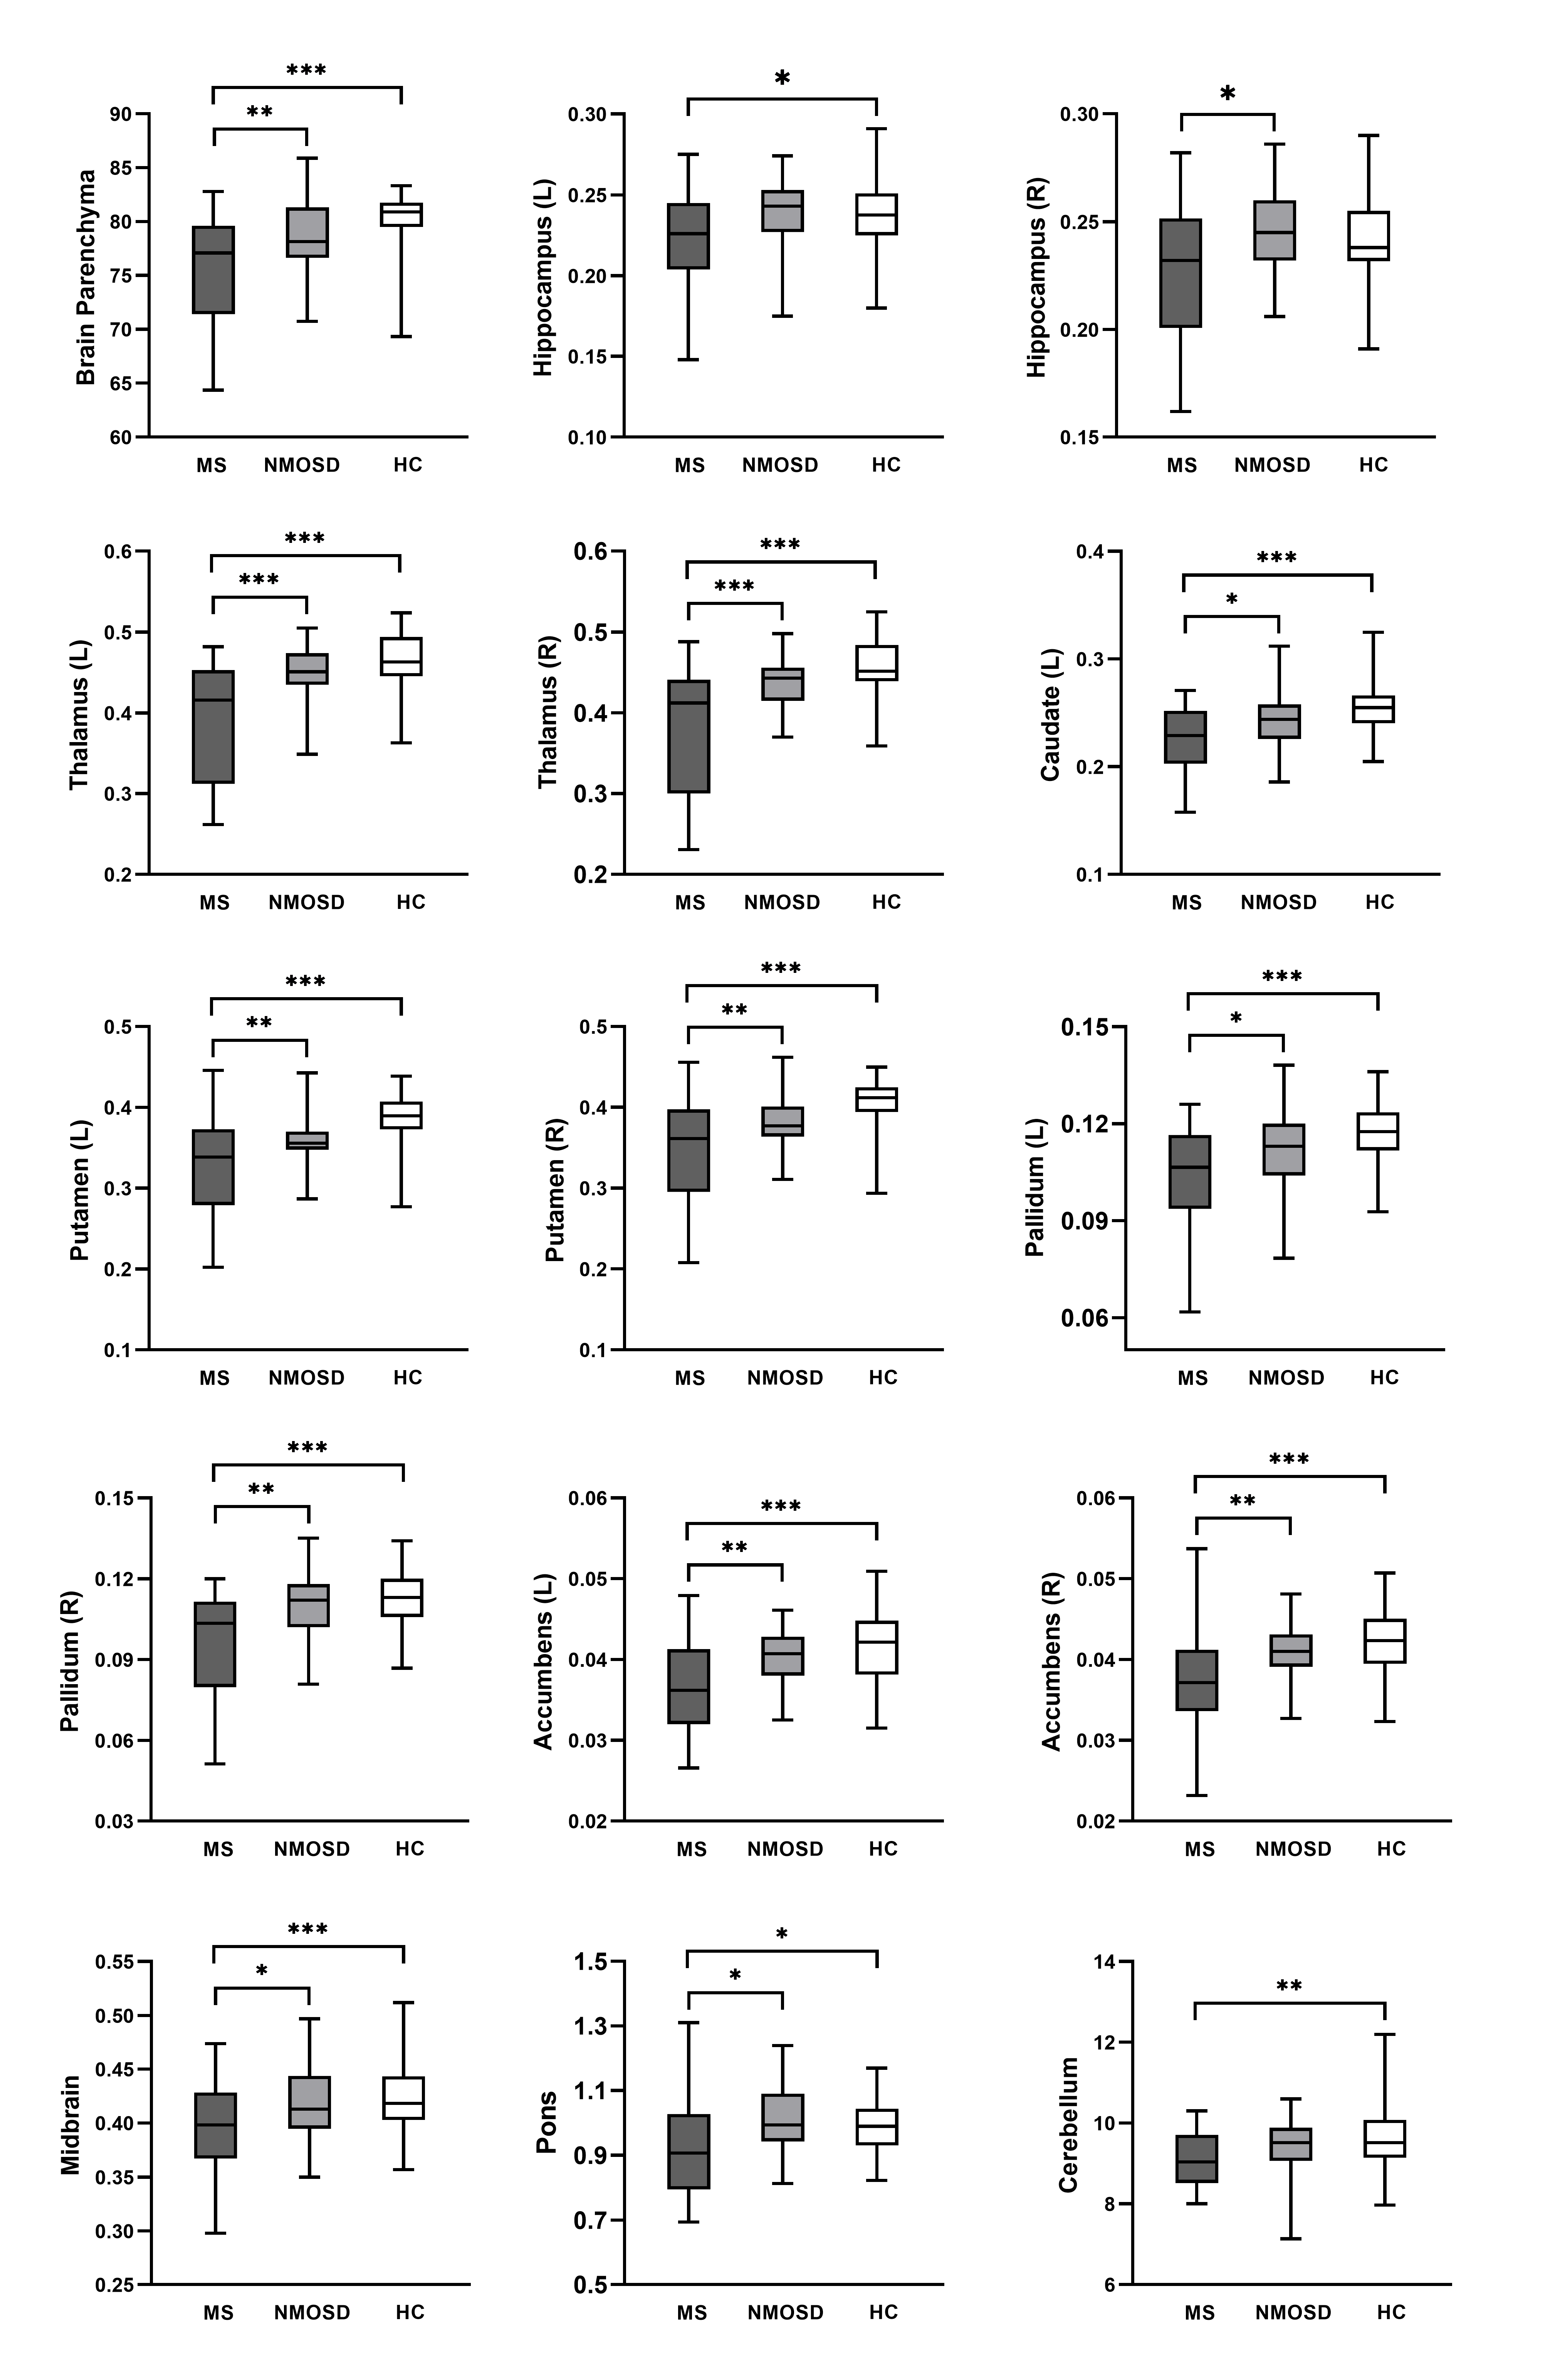
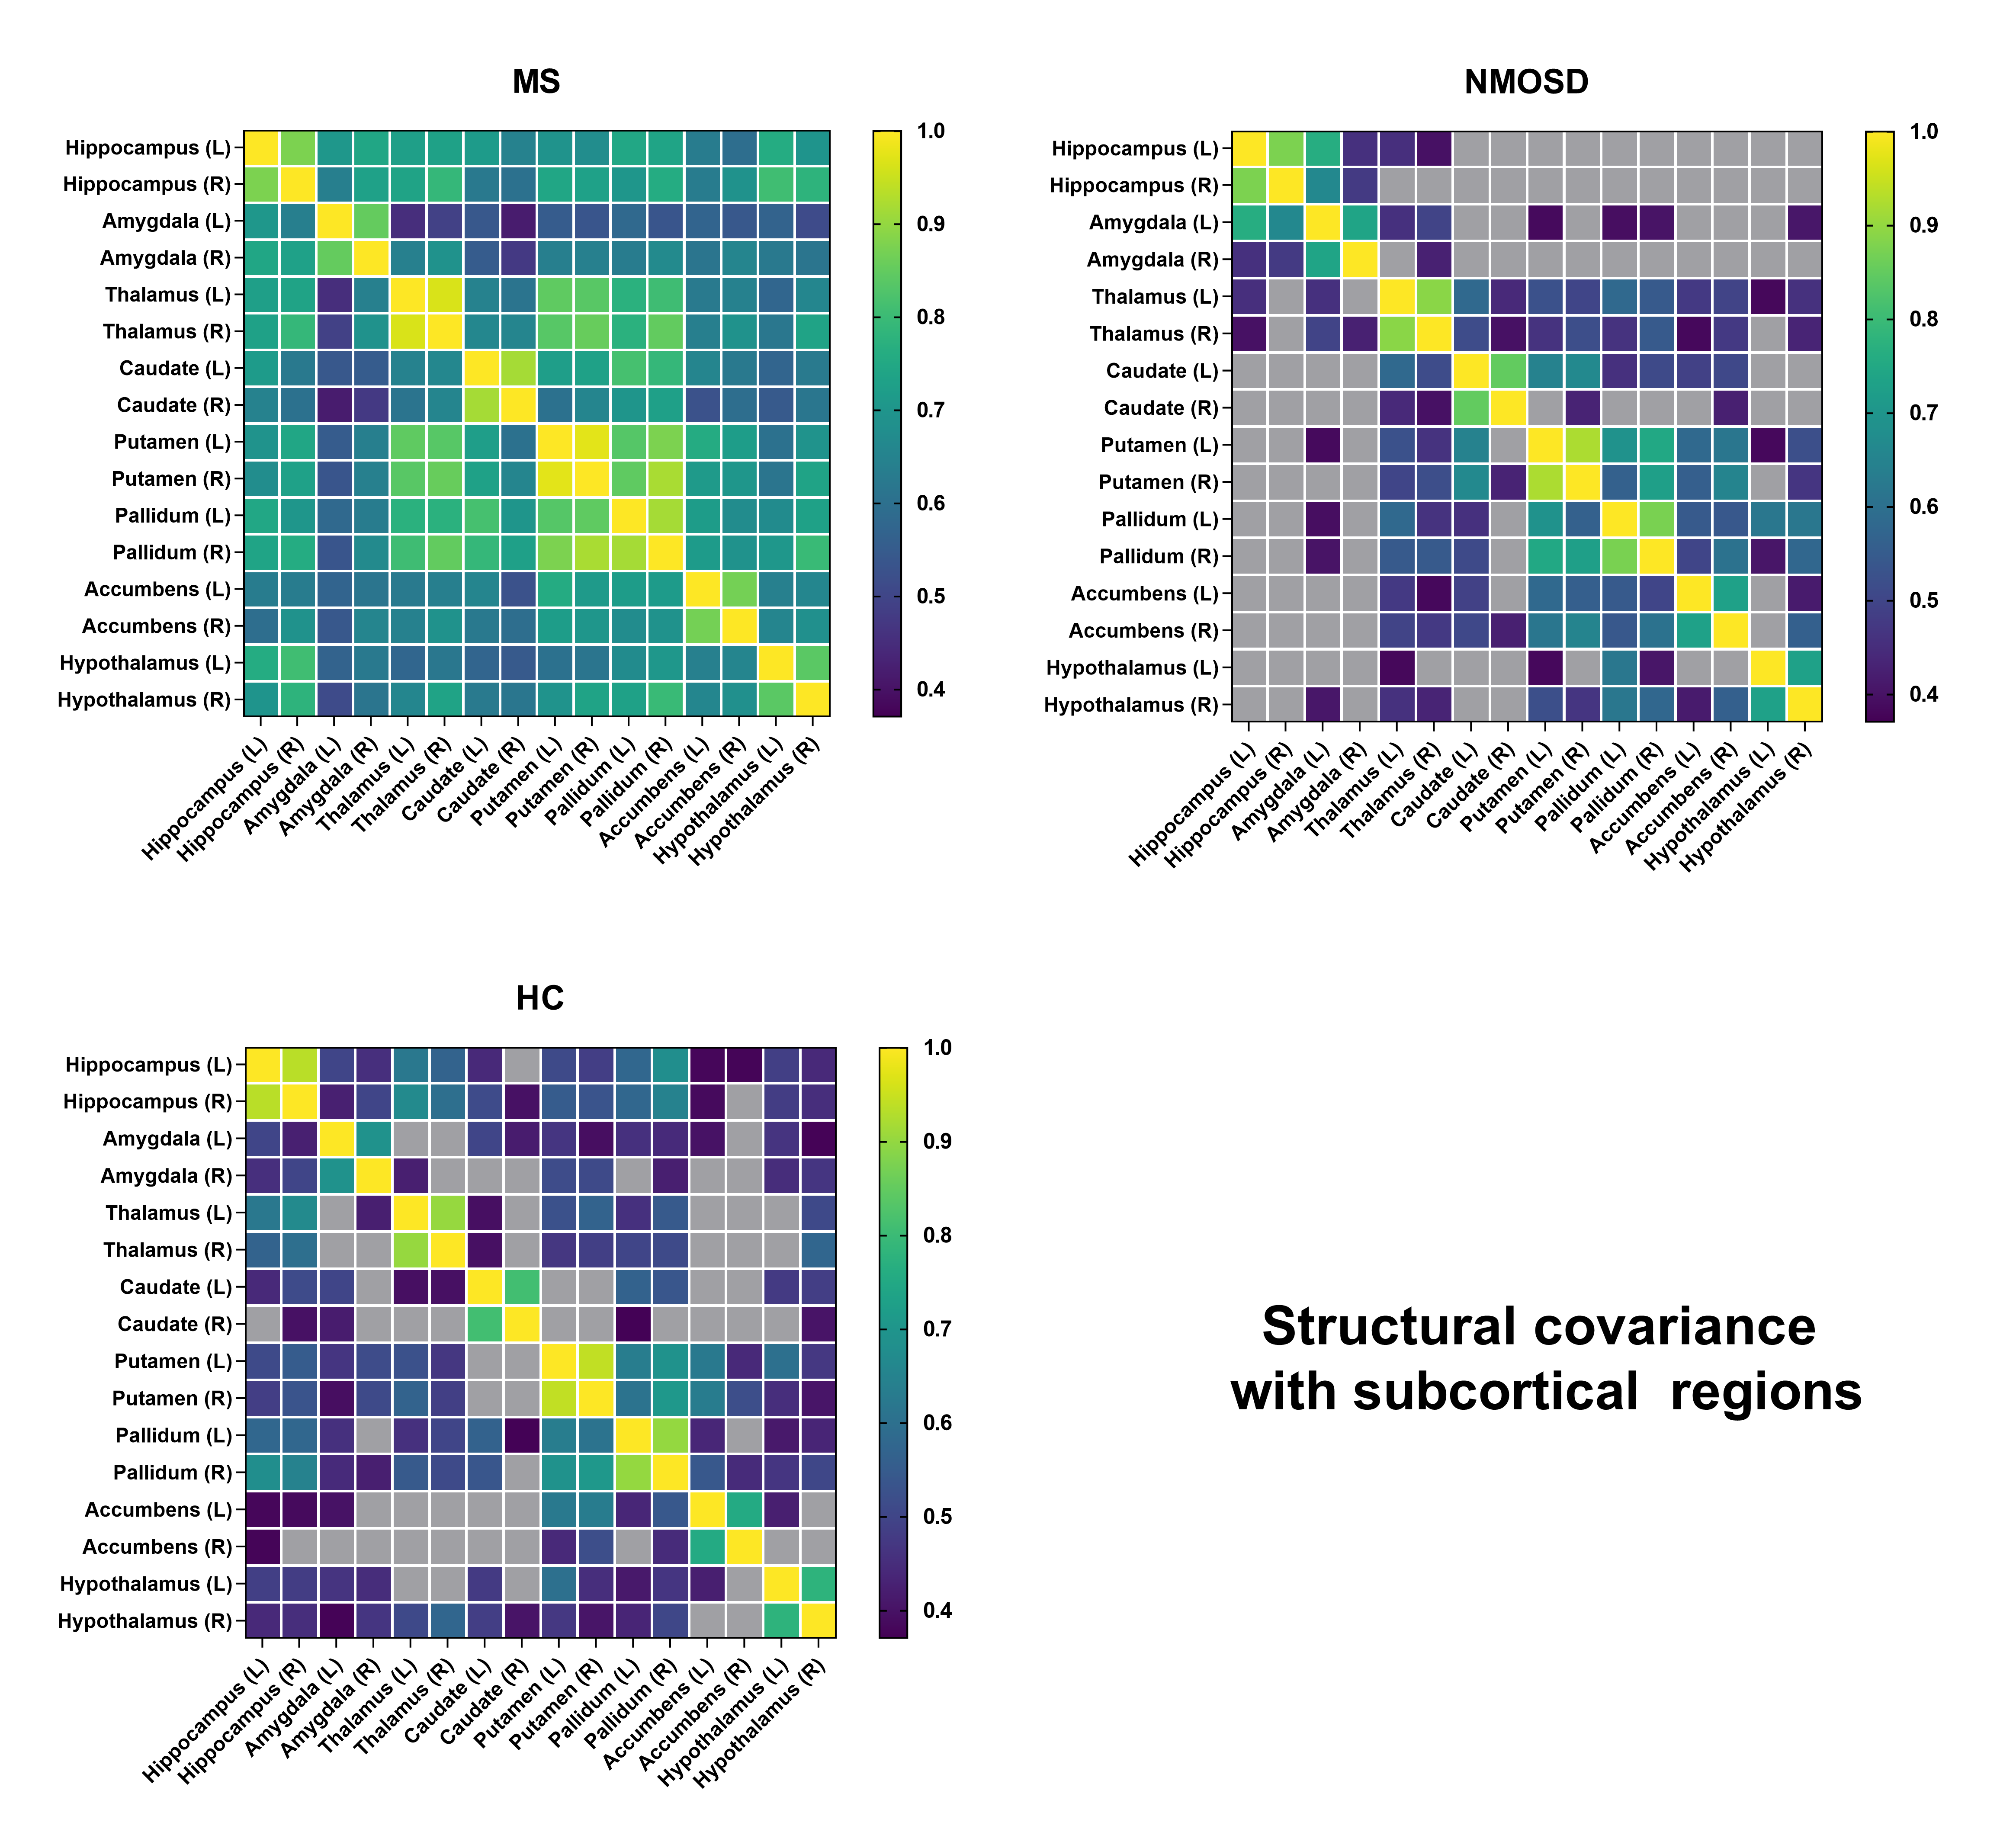
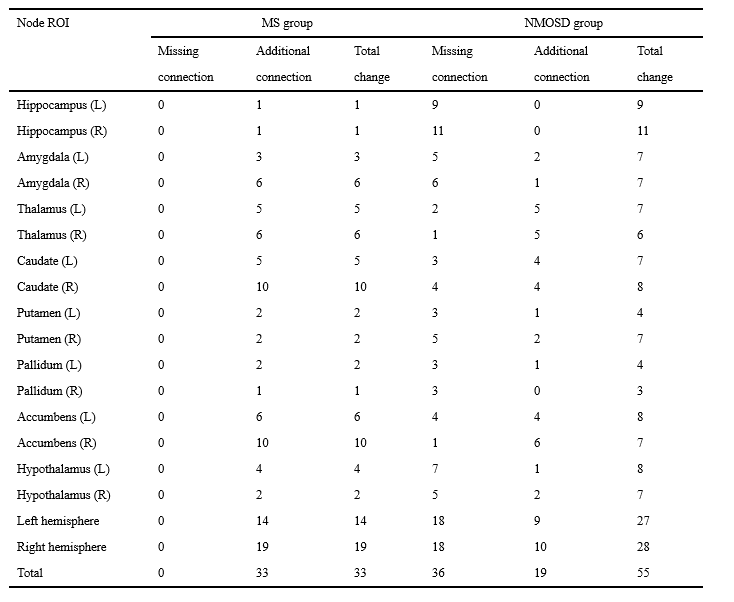
Compared with HC, MS patients presented significantly smaller volume in some subcortical and infratentorial regions (P<0.05), while NMOSD patients showed no significant difference of volumetry in any of the brain regions (P>0.05), although they had no significant difference in symptom duration (MS 3.95±3.73; NMOSD 3.11±4.61; P>0.05) (Figure 1). In addition, the structural covariance analyses revealed the synergy volume alteration in subcortical regions both in MS and NMOSD group (Figure 2, Figure 3). More extensive additional connections compared with HC were found in MS patients and more extensive missing connections compared with HC were found in NMOSD patients (Table 1). The ROIs that showed the most changes of anatomical connections were the right caudate and nucleus accumbens (total change of 10 connections for both ROIs) in the MS group and the right hippocampus (total change of 11 connections) in the NMOSD group.Discussion
We analyzed the volumetric changes across brain regions and volumetric structural covariance in subcortical regions in MS and NMOSD as measured with automated MRI-based volumetry. MS patients exhibited extensive brain atrophy relative to HC, including not only subcortical regions but also infratentorial regions. Moreover, our study revealed distinct structural covariance based on volumes of subcortical regions in MS and NMOSD patients. More extensive additional connections compared with HC were found in MS patients and more extensive missing connections compared with HC were found in NMOSD patients. We found different patterns of network-level structural covariance between MS and HC groups and between NMOSD and HC groups in subcortical regions. These results confirm distinct synergy alterations of subcortical regions in MS and NMOSD patients, which indicate different pathophysiological process between MS and NMOSD. Simultaneous occurrence of demyelination, axonal loss and remyelination process are common pathological changes in MS[6]. Moreover, the current study enrolled mainly MS patients of RRMS type. Transient remyelination and partially restored conduction velocity may protect axons from inflammatory damage and determine temporary remission of RRMS[7]. All these evidence supports that MS of RRMS type tends to trigger minor inflammatory damage to white matter within more extensive areas, and thus may leave more room for compensatory reorganization across subcortical areas in a more extensive way. In addition, Kato et al found that in some normal-appearing white matter areas, the degree of myelin destruction in NMOSD was more serious than that in MS patients of RRMS type[8]. This indicates that white matter damage caused by NMOSD may be more irreversible. Therefore, though with less lesion load of demyelination and no apparent brain atrophy,NMOSD patients suffer from more extensive missing connections.Conclusion
Different with NMOSD patients, MS patients exhibited more pronounced atrophy of brain regions. Furthermore, MS and NMOSD patients had distinct patterns of anatomical connection in brain regions, which reveal different underlying pathophysiology of the two diseases.Acknowledgements
Funding: This project was supported by the National Natural Science Funds of China (Grants No.81730049, No.82102024).References
1. Zielinski BA, Gennatas ED, Zhou J, Seeley WW (2010) Network-level structural covariance in the developing brain. Proc Natl Acad Sci U S A 107:18191-18196
2. Tewarie P, Steenwijk MD, Tijms BM et al (2014) Disruption of structural and functional networks in long-standing multiple sclerosis. Hum Brain Mapp 35:5946-5961
3. Tur C, Eshaghi A, Altmann DR et al (2018) Structural cortical network reorganization associated with early conversion to multiple sclerosis. Sci Rep 8:10715
4. Hyun JW, Park G, Kwak K et al (2017) Deep gray matter atrophy in neuromyelitis optica spectrum disorder and multiple sclerosis. Eur J Neurol 24:437-445
5. Lee CY, Mak HK, Chiu PW, Chang HC, Barkhof F, Chan KH (2018) Differential brainstem atrophy patterns in multiple sclerosis and neuromyelitis optica spectrum disorders. J Magn Reson Imaging 47:1601-1609
6. Filippi M, Brück W, Chard D et al (2019) Association between pathological and MRI findings in multiple sclerosis. The Lancet Neurology 18:198-210
7. Mancuso R, Hernis A, Agostini S, Rovaris M, Caputo D, Clerici M (2015) MicroRNA-572 expression in multiple sclerosis patients with different patterns of clinical progression. Journal of Translational Medicine 13
8. Kato S, Hagiwara A, Yokoyama K et al (2022) Microstructural white matter abnormalities in multiple sclerosis and neuromyelitis optica spectrum disorders: Evaluation by advanced diffusion imaging. Journal of the Neurological Sciences 436
Figures