0468
White matter changes detected based on multi-component MR Fingerprinting in Multiple Sclerosis1Department of Imaging Physics, Delft University of Technology, Delft, Netherlands, 2C.J. Gorter MRI Center, Radiology Department, Leiden University Medical Center, Leiden, Netherlands, 3Computer Assisted Clinical Medicine, Medical Faculty Mannheim, Heidelberg University, Mannheim, Germany, 4Neuroimmunology and Multiple Sclerosis Unit and Laboratory of Advanced Imaging in Neuroimmunological Diseases (ImaginEM), Hospital Clinic Barcelona, Institut d'Investigacions Biomediques August Pi i Sunyer (IDIBAPS) and Universitat de Barcelona, Barcelona, Spain, 5Department of Neurology, Medical Faculty Mannheim, Heidelberg University, Mannheim, Germany, 6Department of Radiology and Nuclear Medicine, Erasmus MC, Rotterdam, Netherlands, 7Department of Radiology, Leiden University Medical Center, Leiden, Netherlands
Synopsis
Keywords: Multiple Sclerosis, MR Fingerprinting
White matter hyperintensities are an MRI biomarker of Multiple Sclerosis (MS). However, not all white matter changes are visible on conventional, qualitative MRI. We applied a multi-component MR Fingerprinting protocol to identify potential white matter abnormalities based on increased $$$T_2^*$$$-values. FLAIR and MRF scans were performed in 44 MS patients and 12 healthy control subjects. Significant differences were found in the volume of MRF components with 500ms<$$$T_1, T_2^*$$$<2.5s. This volume correlated moderately with white matter damage on structural MR images. The MRF approach identified larger abnormal tissue volumes than those visible on the structural scans.Introduction
White matter hyperintensities (WMH) are a key imaging biomarker of multiple sclerosis (MS). Previous studies have shown that the white matter surrounding WMH is also commonly affected by MS, which is sometimes visible as dirty appearing white matter (DAWM) on structural FLAIR scans[1], [2]. However, these structural brain abnormalities (i.e. WMH and DAWM) are not able to fully capture the extent of white matter damage[3], [4]. Our aim was to evaluate a new method to quantify the full extent of white matter tissue changes in MS. We obtained MC-MRF estimates with a fast a fast, multi-parametric quantitative MRI protocol in MS patients and healthy controls. We then compared the MC-MRF outcomes between patients with MS and control subjects and correlated them with structural white matter damage identified on FLAIR MRI scans in patients with MS.Methods
Data acquisitionData was acquired at 2 sites, on 3T MRI scanners (Magnetom Skyra and Prisma, Siemens Healthineers, Erlangen, Germany). At the first site, 12 healthy volunteers (75% male, min 22 and max 30 (mean: 26) years) and 18 patients (39% male, min 23 and max 73 (mean: 39) years) with MS were scanned. At the second site, 32 patients (37% male, min 1 and max 63 (mean: 41) years) with MS were scanned. Previously, this data was used to analyze relaxation times in WMH as obtained from single-component MRF analysis[5]. This bi-center study was approved by the local institutional review boards at both sites (2019-711N, BCB2012/7965), and written, informed consent was obtained from all participants prior to scanning.
MRF-EPI images [6], [7] were acquired with in-plane spatial resolution=1×1mm2, slice thickness=2mm, bandwidth=998Hz/px, GRAPPA-factor=3, partial-Fourier=5/8, variable flip angle=(34°-86°),TE=(21-81.5 ms),TR=(3530-6570 ms), and fat suppression with acquisition times 4:23 and 1:52 (simultaneous multislice-factor=3).
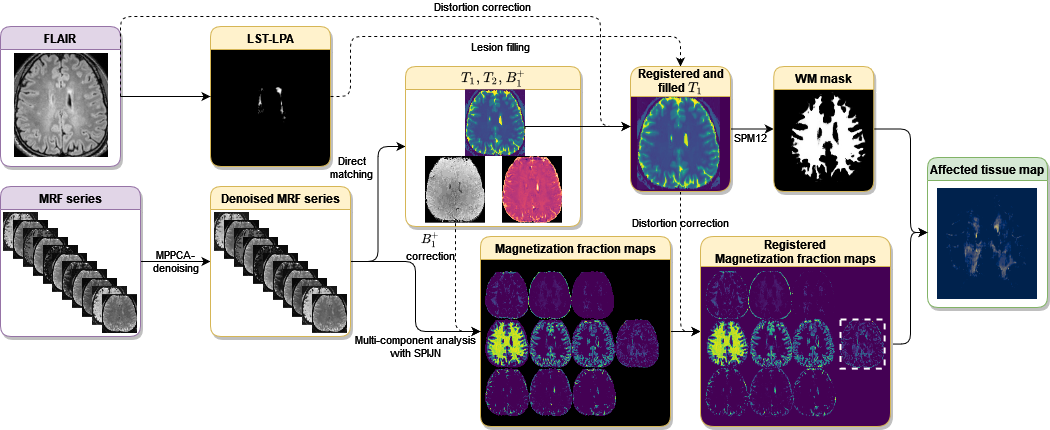
Image processing
Image processing steps are shown in Fig.1. SPIJN MC-MRF analysis [8] was performed on the MRF data after MP-PCA denoising[9]. Per participant MC-MRF components with relaxation times of 500ms<$$$T_1$$$<2.5s and 500ms<$$$T_2^*$$$<2.5s were combined into a single magnetization fraction map if multiple components were identified.
Scoring of FLAIR scans
Based on the T2-weighted and T2-FLAIR scans white matter regions were scored by an expert neuroradiologist on a 0-5 scale reflecting the amount of observed white matter changes (DAWM+WMH). DAWM was defined as a uniform area of subtle signal intensity increase on T2-weighed scans compared to the signal intensity of the normal-appearing white matter[10]. The following visual volume score as a percentage of total white matter was applied:
0. No structural changes
1. 0 to 10% abnormal white matter
2. 10 to 25% abnormal white matter
3. 25 to 50 % abnormal white matter
4. 50% to 75% abnormal white matter
5. 75% or more abnormal white matter
Scoring was performed per white matter region (frontal, parietal, occipital, and temporal), and per hemisphere, resulting in a maximum score of 40 points.
Atlas registration
Distortion corrected T1 maps were registered to the MNI152 template (ICBM 2009a Nonlinear Symmetric 1×1x1mm template) [11]–[13] to obtain segmentations of the frontal, occipital, parietal, and temporal lobes.
Statistical analysis
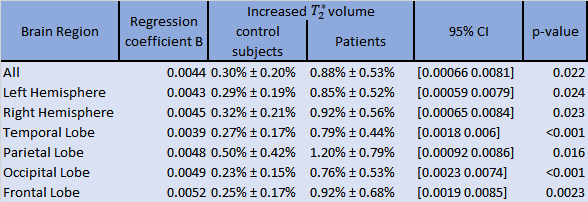
A generalized linear model correcting for age and sex was applied to assess the (corrected) difference in normalized increased $$$T_2^*$$$-MRF-component volumes between patients with MS and controls in various brain regions.
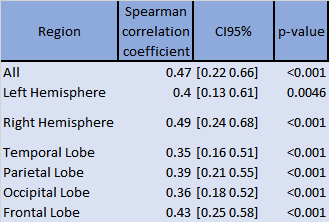
A Spearman pairwise correlation test was performed to test for correlations between the estimated normalized component volumes and the visual volume scoring within the patient group per brain, hemisphere and WM region.
Results
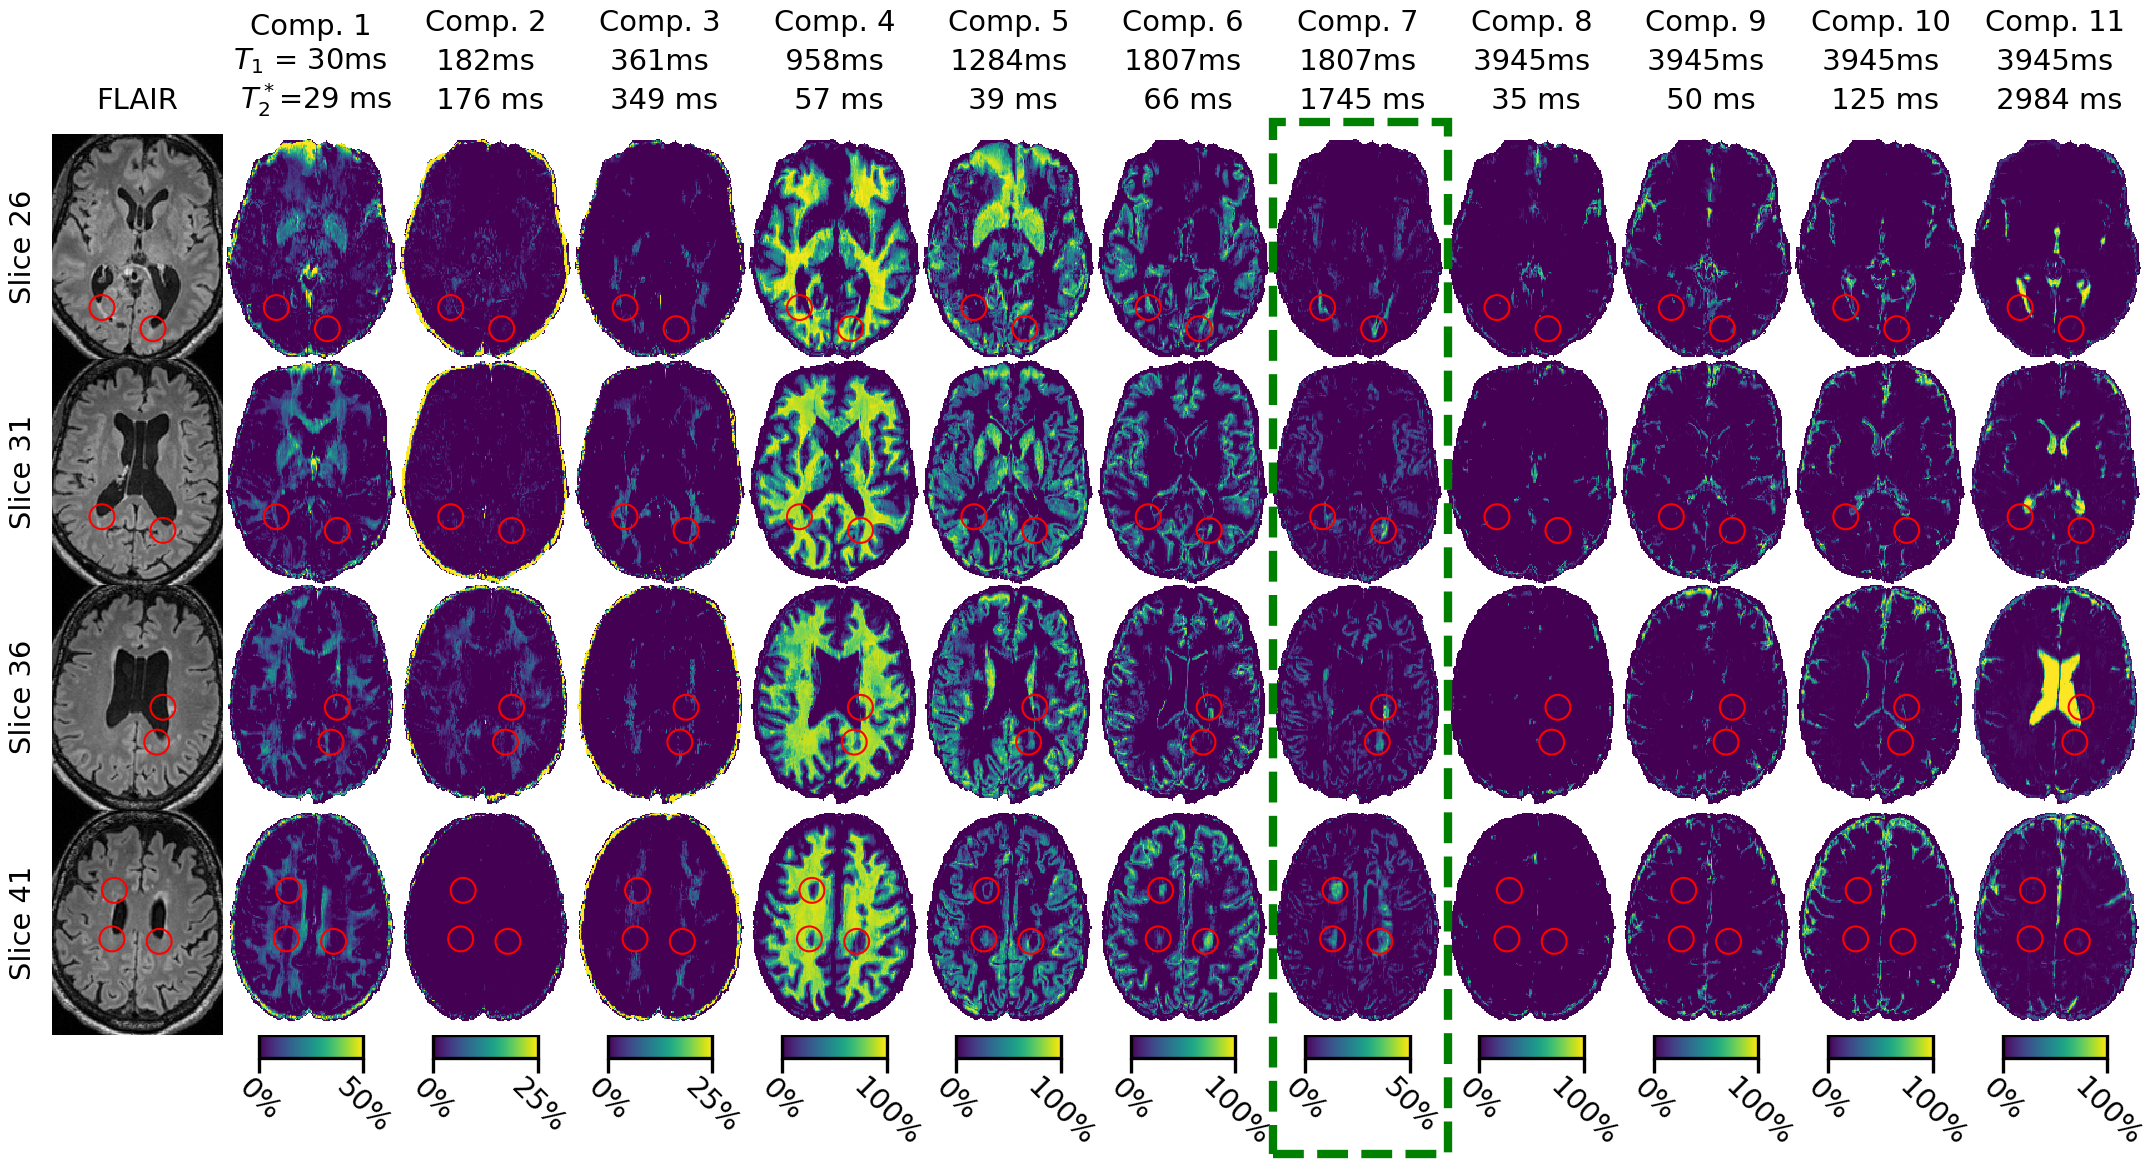
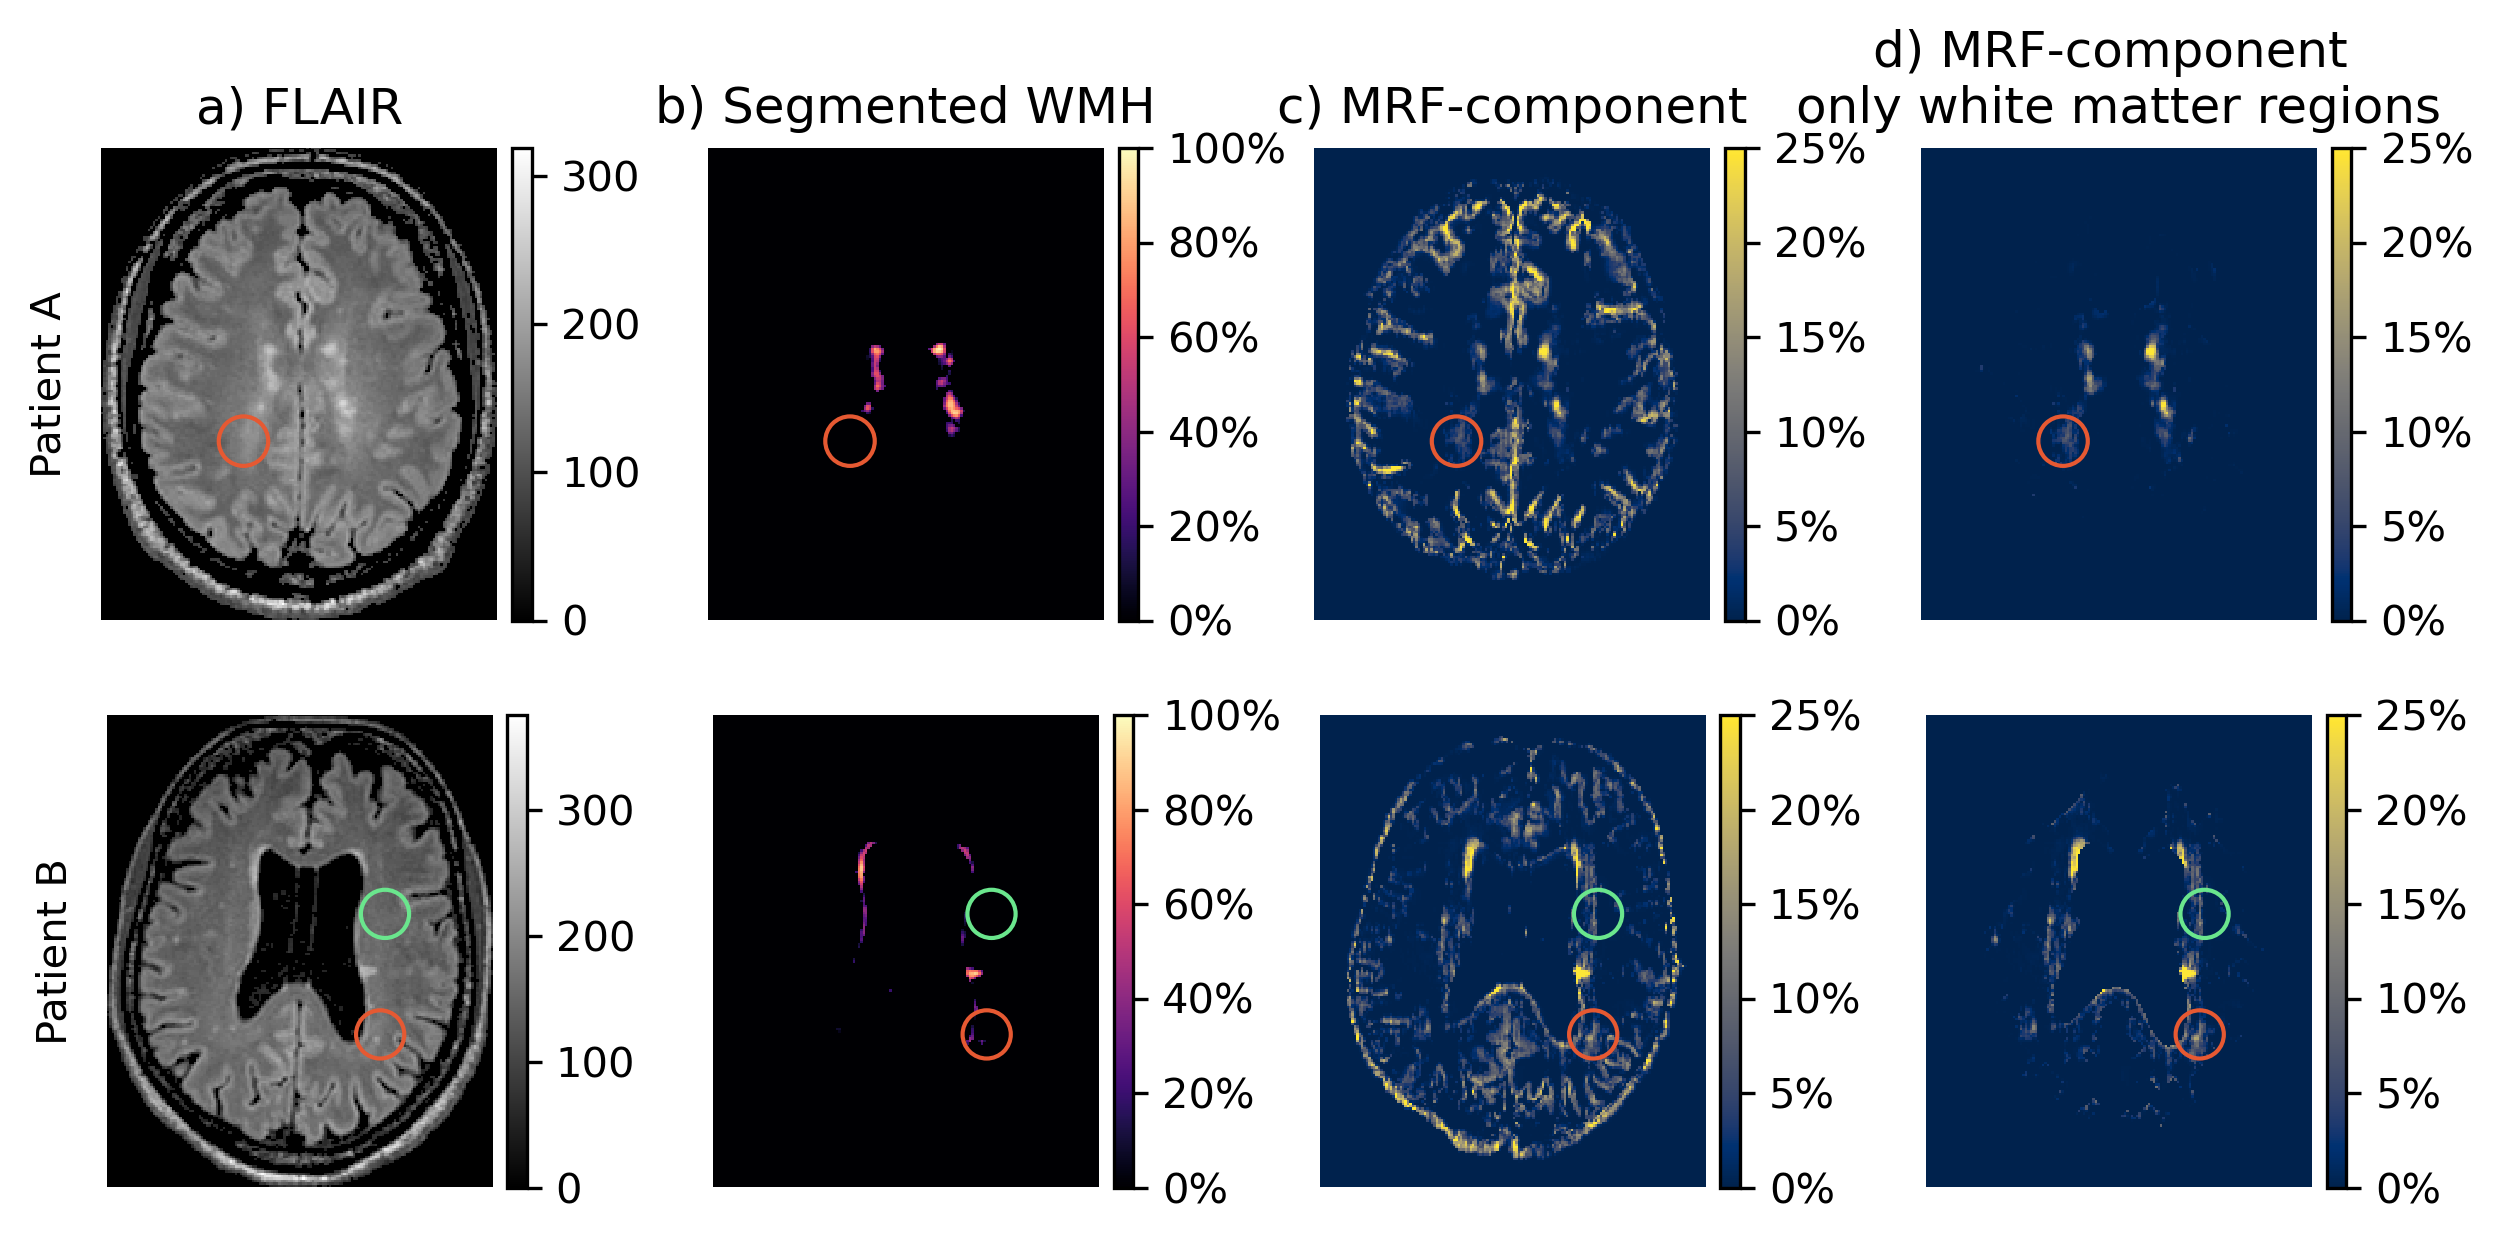
Representative MC-MRF magnetization fraction maps of one patient are shown in Fig.2. A close-up of the component with increased $$$T_2^*$$$ is shown in Fig.3 for two other patients of which the first shows a similar extent of white matter changes in the MRF and FLAIR scan and the second shows more extensive abnormalities on the MRF image. Patients with MS had significantly higher volume of the increased $$$T_2^*$$$-component in the white matter compared to healthy controls (B (95%-CI) = 0.004 (0.0006-0.008), p=0.02), see Table 1. This could reflect a higher free water content in MS patients. The MRF component volume showed a moderate correlation (correlation coefficient 0.47) with visible structural white matter changes on FLAIR MRI scans (white matter hyperintensities and DAWM) as shown in Table 2.Discussion
Prolonged transversal relaxation time components (ms) were previously found in MS[14],[15]. It is hypothesized that this prolonged component reflects an increase in lesion extracellular water, potentially related to an increase in edema[16]. Larger regions were identified (See Fig.3) using the MRF component than on FLAIR MRI. As such our results may indicate that the white matter damage identifiable in structural FLAIR MR images is only the tip-of-the-iceberg of the disease process[17].Conclusion
The proposed MRF acquisition and analysis facilitated the detection of potential white matter tissue abnormalities in MS patients based on the fractional volume of a long $$$T_2^*$$$-component. This component was more extensively present in the patients compared to white matter changes visible in weighted MR scans. This suggests that the disease burden of MS may be underestimated using only conventional clinical MRI scans. Owing to the short acquisition time, the proposed method is suited for inclusion in clinical protocols to quantify white matter changes.Acknowledgements
This work was partly funded by the Medical Delta project Dementia and Stroke 3.0.References
[1] C. Laule et al., “Diffusely Abnormal White Matter in Multiple Sclerosis: Further Histologic Studies Provide Evidence for a Primary Lipid Abnormality With Neurodegeneration,” J. Neuropathol. Exp. Neurol., vol. 72, no. 1, pp. 42–52, Jan. 2013, doi: 10.1097/NEN.0b013e31827bced3.
[2] J. Cairns et al., “Diffusely abnormal white matter in multiple sclerosis,” J. Neuroimaging, vol. 32, no. 1, pp. 5–16, 2022, doi: 10.1111/jon.12945.
[3] N. M. Moll et al., “Multiple sclerosis normal-appearing white matter: Pathology–imaging correlations,” Ann. Neurol., vol. 70, no. 5, pp. 764–773, 2011, doi: 10.1002/ana.22521.
[4] M. Filippi et al., “Association between pathological and MRI findings in multiple sclerosis,” Lancet Neurol., vol. 18, no. 2, pp. 198–210, Feb. 2019, doi: 10.1016/S1474-4422(18)30451-4.
[5] I. Hermann et al., “Accelerated white matter lesion analysis based on simultaneous T1 and T2* quantification using magnetic resonance fingerprinting and deep learning,” Magn. Reson. Med., vol. 86, no. 1, pp. 471–486, 2021, doi: 10.1002/mrm.28688.
[6] B. Rieger, F. Zimmer, J. Zapp, S. Weingärtner, and L. R. Schad, “Magnetic resonance fingerprinting using echo-planar imaging: Joint quantification of T1 and relaxation times,” Magn. Reson. Med., vol. 78, no. 5, pp. 1724–1733, 2017, doi: 10.1002/mrm.26561.
[7] B. Rieger et al., “Time efficient whole-brain coverage with MR Fingerprinting using slice-interleaved echo-planar-imaging,” Sci. Rep., vol. 8, no. 1, p. 6667, Apr. 2018, doi: 10.1038/s41598-018-24920-z.
[8] M. A. Nagtegaal, P. Koken, T. Amthor, and M. Doneva, “Fast multi-component analysis using a joint sparsity constraint for MR fingerprinting,” Magn. Reson. Med., vol. 83, no. 2, pp. 521–534, 2020, doi: 10.1002/mrm.27947.
[9] J. Veraart, D. S. Novikov, D. Christiaens, B. Ades-aron, J. Sijbers, and E. Fieremans, “Denoising of diffusion MRI using random matrix theory,” NeuroImage, vol. 142, pp. 394–406, Nov. 2016, doi: 10.1016/j.neuroimage.2016.08.016.
[10] A. Seewann et al., “Diffusely Abnormal White Matter in Chronic Multiple Sclerosis: Imaging and Histopathologic Analysis,” Arch. Neurol., vol. 66, no. 5, pp. 601–609, May 2009, doi: 10.1001/archneurol.2009.57.
[11] D. L. Collins, A. P. Zijdenbos, W. F. C. Baaré, and A. C. Evans, “ANIMAL+INSECT: Improved Cortical Structure Segmentation,” in Information Processing in Medical Imaging, vol. 1613, A. Kuba, M. Šáamal, and A. Todd-Pokropek, Eds. Berlin, Heidelberg: Springer Berlin Heidelberg, 1999, pp. 210–223. doi: 10.1007/3-540-48714-X_16.
[12] V. Fonov, A. Evans, R. McKinstry, C. Almli, and D. Collins, “Unbiased nonlinear average age-appropriate brain templates from birth to adulthood,” NeuroImage, vol. 47, p. S102, Jul. 2009, doi: 10.1016/S1053-8119(09)70884-5.
[13] V. Fonov, A. C. Evans, K. Botteron, C. R. Almli, R. C. McKinstry, and D. L. Collins, “Unbiased average age-appropriate atlases for pediatric studies,” NeuroImage, vol. 54, no. 1, pp. 313–327, Jan. 2011, doi: 10.1016/j.neuroimage.2010.07.033.
[14] C. Laule et al., “MR evidence of long T2 water in pathological white matter,” J. Magn. Reson. Imaging, vol. 26, no. 4, pp. 1117–1121, 2007, doi: 10.1002/jmri.21132.
[15] C. Laule et al., “Long T2 water in multiple sclerosis: What else can we learn from multi-echo T2 relaxation?,” J. Neurol., vol. 254, no. 11, pp. 1579–1587, Nov. 2007, doi: 10.1007/s00415-007-0595-7.
[16] A. Deshmane et al., “Partial volume mapping using magnetic resonance fingerprinting,” NMR Biomed., vol. 0, no. 0, p. e4082, Mar. 2019, doi: 10.1002/nbm.4082.
[17] Wardlaw Joanna M., Valdés Hernández Maria C., and Muñoz‐Maniega Susana, “What are White Matter Hyperintensities Made of?,” J. Am. Heart Assoc., vol. 4, no. 6, p. e001140, 2015, doi: 10.1161/JAHA.114.001140.
[18] Schmidt, Paul, “Bayesian inference for structured additive regression models for large-scale problems with applications to medical imaging,” Ludwig-Maximilians-Universität München, 2017. doi: 10.5282/EDOC.20373.
[19] J. Ashburner and K. J. Friston, “Unified segmentation,” NeuroImage, vol. 26, no. 3, pp. 839–851, Jul. 2005, doi: 10.1016/j.neuroimage.2005.02.018.
[20] “SPM - Statistical Parametric Mapping.” https://www.fil.ion.ucl.ac.uk/spm/
Figures