0459
Classifying patients with chronic mild traumatic brain injury: a rs-fMRI study and support vector machine analysis
Faezeh Vedaei1, Najmeh Mashhadi2, George Zabrecky1, Daniel Monti1, Emily Navarreto1, Chloe Hriso1, Nancy Wintering1, Andrew B. Newberg1, and Feroze B. Mohamed1
1Thomas Jefferson University, Philadelphia, PA, United States, 2University of California-Santa Cruz, Santa Crus, CA, United States
1Thomas Jefferson University, Philadelphia, PA, United States, 2University of California-Santa Cruz, Santa Crus, CA, United States
Synopsis
Keywords: Traumatic brain injury, fMRI (resting state)
Machine learning classification of patients with chronic mild traumatic brain injury using rs-fMRI metricsIntroduction
Traumatic brain injury (TBI) is one of the most common neurological disorders across the world that can result in a broad spectrum of symptoms that tremendously impact a person’s personality, behavior, thinking, and memory.1,2 Recently, there has been growing interest in the application of machine learning (ML) algorithms to neuroimaging data for diagnostics and prognostic assessment of brain disorders.3 We aimed to develop automatic classification model employing the support vector machine (SVM) to distinguish between chronic mild TBI (mTBI) patients from healthy controls (HCs).Methods
Resting-state functional magnetic resonance imaging (rs-fMRI) scans were acquired in 60 chronic mTBI patients and 40 HCs. Voxel-wise brain maps of rs-fMRI metrics including fractional amplitude of low frequency fluctuation (fALFF), regional homogeneity (ReHo), degree centrality (DC), voxel-mirrored homotopic connectivity (VMHC), functional connectivity strength (FCS) generated for each subject using DPARSF_V5.0 after preprocessing steps.4 Statistical two-sample t-test was employed comparing between mTBI and HCs groups. Then, for each rs-fMRI metric the features were selected extracting the mean values from the clusters showing significant differences. Finally, the kernel-based radial basis function SVM models based on separate and multilevel metrics were built and the performance of the model was evaluated and quantified on the test dataset via 5-fold stratified CV using the receiver operator characteristic (ROC) curve analysis. The corresponding area under the curve (AUC), balanced accuracy, sensitivity, specificity, positive predictive value (PPV), and negative predictive value (NPV) were obtained. Feature importance was estimated using Shapley additive explanation (SHAP) values.5Results
Several brain regions have been found as significant differences of rs-fMRI metrics between mTBI and HCs groups as summarized in Table 1 and shown in Figure 1. In identification of mTBI patients versus HCs, the %AUC, balanced accuracy, sensitivity, specificity, PPV and NPV values were obtained for the rs-fMRI measures. The list of these values and ROC analysis are summarized in Table 2, Figure 2. The %AUC value was 88.75 for fALFF, 96.25 for ReHo, 100 for DC, 96.25 for VMHC, and 86.67 for FCS. Additionally, we found highest performance of SMV classification using multilevel measure analysis achieving an %AUC of 100. However, DC as a single measure showed the highest %AUC of 100 among the whole rs-fMRI metrics.Moreover, the SHAP summary plots of top 20 features with the greatest contribution to classification in the multilevel measure models are presented in Figure 3. The DC value of left postcentral had the greatest contribution to the model prediction among the local measures. ReHo values in left superior frontal cortex and VMHC in right superior parietal cortex were also important for model prediction.Discussion
There is an important need to differentiate chronic mTBI and HCs, and yet, there is a lack of objective imaging biomarkers. The scientific motivation of this study was to investigate classification performance of distinction chronic mTBI patients and HCs utilizing multivariate rs-fMRI metrics. Specifically, DC among the whole measures showed the highest classification accuracy suggesting using this metric in classification tasks when just one measure needed to be employed.In order to address the black box nature of the ML method, the SHAP methodology was employed to enable interpretation of the ML models and yield the feature importance values. The DC value of the postcentral gyrus served as the most important feature. The postcentral gyrus is the main part of the somatosensory cortex and higher DC values in this area represents the higher-order integration of different inputs like sensory and motor.6 ReHo in the frontal cortex was also shown as important feature in discrimination of individual patients with mTBI.7 Several studies have demonstrated the vulnerability of the frontal lobe in mTBI. Specifically, the medial superior frontal lobe as the main part of the DMN plays a role in cognitive processing.8,9 Also, our results are in line with previous studies reporting abnormality of resting-state FC in fronto-parietal network in patients with chronic mTBI. The fronto-parietal network has been shown to be involved in top-down attention control that is activated when attention is shifted from self-awareness to the external environment as well as working memory.10–12Conclusion
This study provided a comprehensive approach employing SVM in classification of chronic mTBI patients using several rs-fMRI measures. Our findings demonstrated that different rs-fMRI metrics can provide complementary information for classifying patients suffering from chronic mTBI. Moreover, we showed that ML approach is a promising tool for detecting patients with mTBI and might serve as potential imaging biomarker to identify patients at individual level.Acknowledgements
No acknowledgement found.References
1. Taylor C, Bell JM, Breiding MJ, et al. Traumatic Brain Injury-Related Emergency Department Visits, Hospitalizations, and Deaths-United States, 2007 and 2013 Surveillance Summaries Centers for Disease Control and Prevention MMWR Editorial and Production Sta. Morb Mortal Wkly Rep 2017; 66: 1–8.2. Vedaei F, Newberg AB, Alizadeh M, et al. Resting-State Functional MRI Metrics in Patients With Chronic Mild Traumatic Brain Injury and Their Association With Clinical Cognitive Performance. Front Hum Neurosci 2021; 15: 1–13.3. Ahmed Z, Mohamed K, Zeeshan S, et al. Artificial intelligence with multi-functional machine learning platform development for better healthcare and precision medicine. Database 2020; 2020: 1–35.4. Yan CG, Wang X Di, Zuo XN, et al. DPABI: Data Processing & Analysis for (Resting-State) Brain Imaging. Neuroinformatics 2016; 14: 339–351.5. Lundberg SM, Lee SI. A unified approach to interpreting model predictions. Adv Neural Inf Process Syst 2017; 2017-Decem: 4766–4775.6. Wang X, Hu T, Yang Q, et al. Graph-theory based degree centrality combined with machine learning algorithms can predict response to treatment with antiepileptic medications in children with epilepsy. J Clin Neurosci 2021; 91: 276–282.7. Meier TB, Giraldo-Chica M, España LY, et al. Resting-state fMRI metrics in acute sport-related concussion and their association with clinical recovery: A study from the NCAA-DOD CARE consortium. J Neurotrauma 2020; 37: 152–162.8. Lu L, Li F, Wang P, et al. Altered hypothalamic functional connectivity in post-traumatic headache after mild traumatic brain injury. J Headache Pain 2020; 21: 1–9.9. Schwedt TJ, Chong CD, Peplinski J, et al. Persistent post-traumatic headache vs. migraine: an MRI study demonstrating differences in brain structure. J Headache Pain 2017; 18: 1–8.10. Kasahara M, Menon DK, Salmond CH, et al. Traumatic brain injury alters the functional brain network mediating working memory. Brain Inj 2011; 25: 1170–1187.11. Stevens MC, Lovejoy D, Kim J, et al. Multiple resting state network functional connectivity abnormalities in mild traumatic brain injury. Brain Imaging Behav 2012; 6: 293–318.12. Shumskaya E, Andriessen TMJC, Norris DG, et al. Abnormal whole-brain functional networks in homogeneous acute mild traumatic brain injury. Neurology 2012; 79: 175–182.Figures
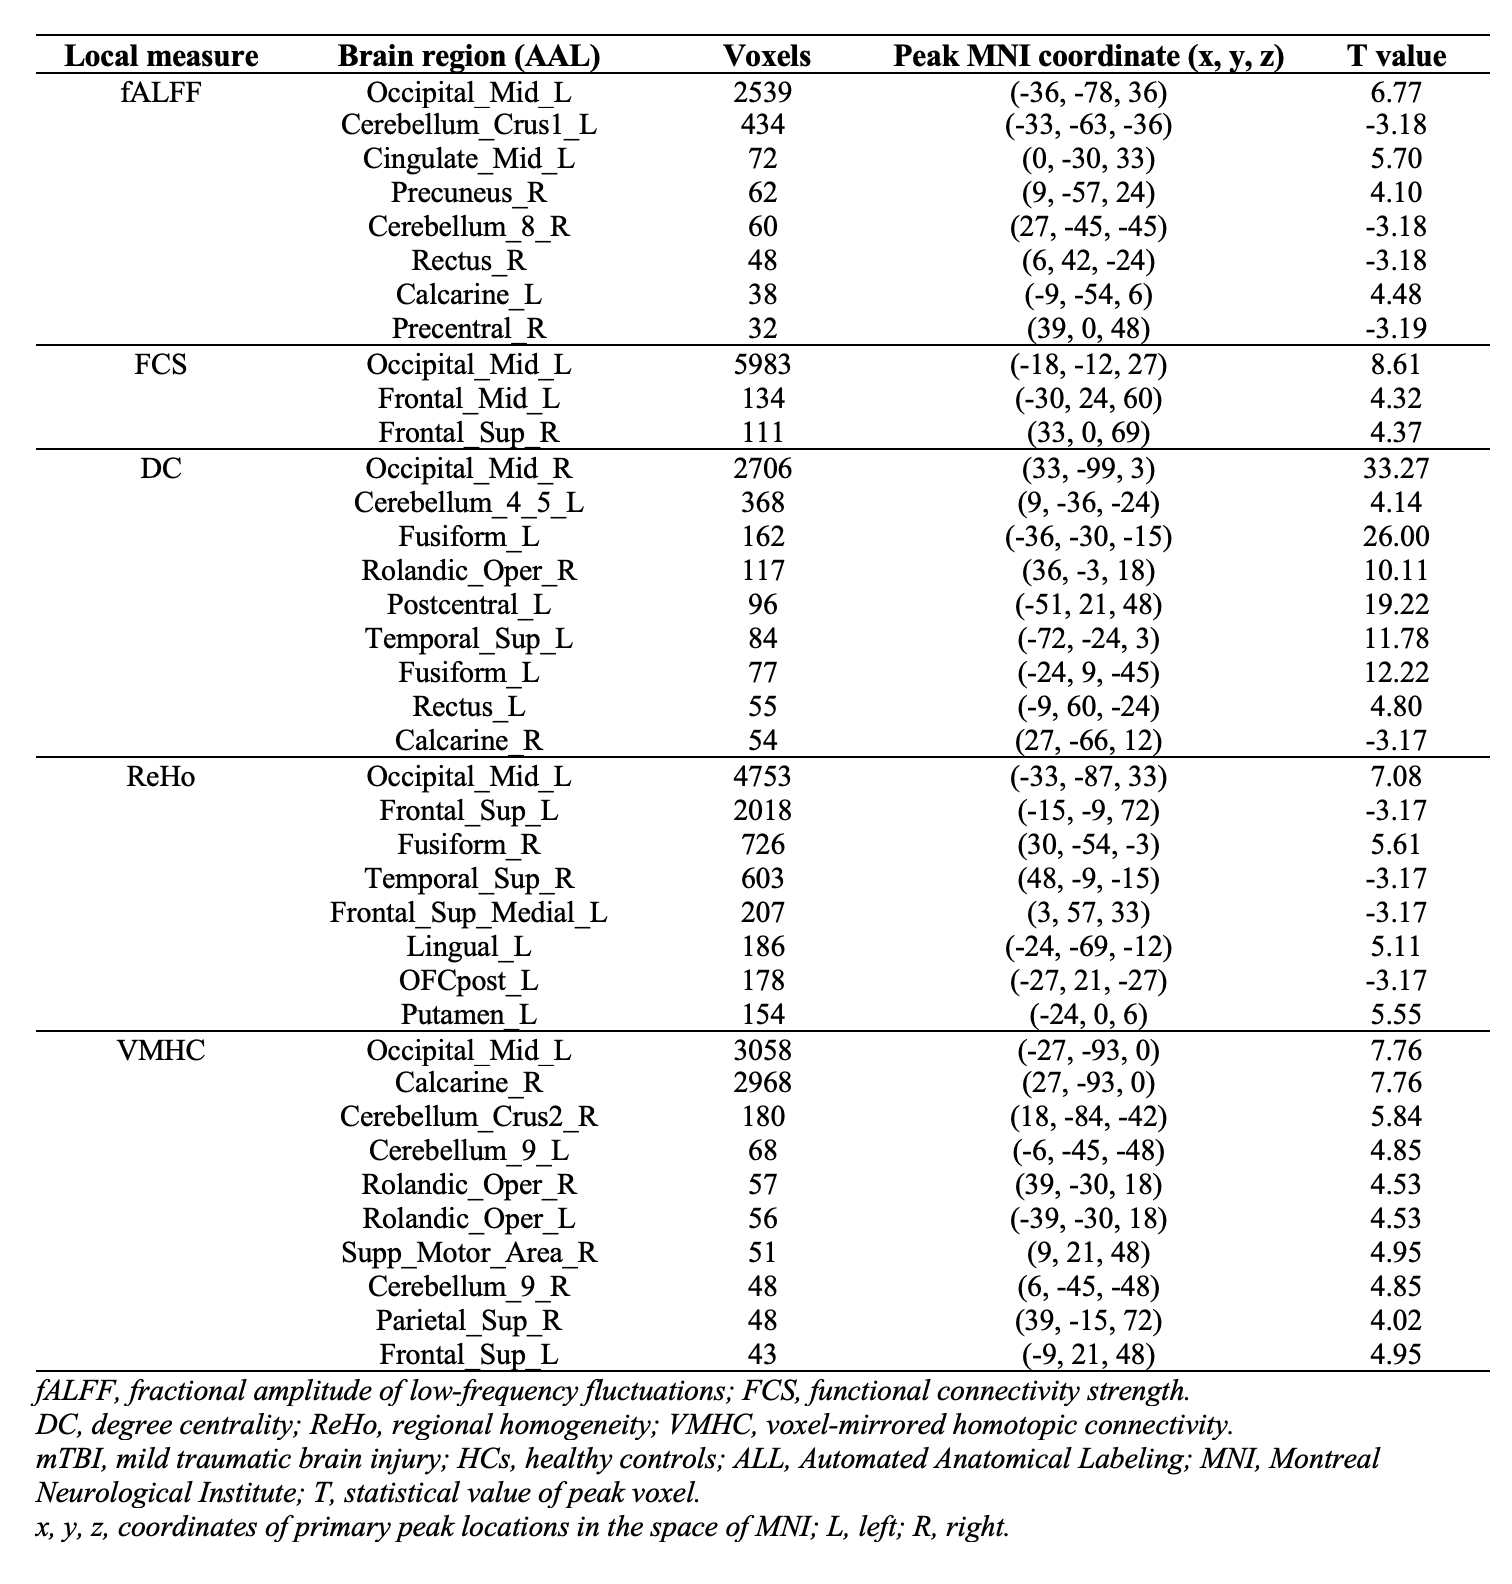
Table 1. Brain regions with significant rs-fMRI metric differences between the mTBI patients and HCs.
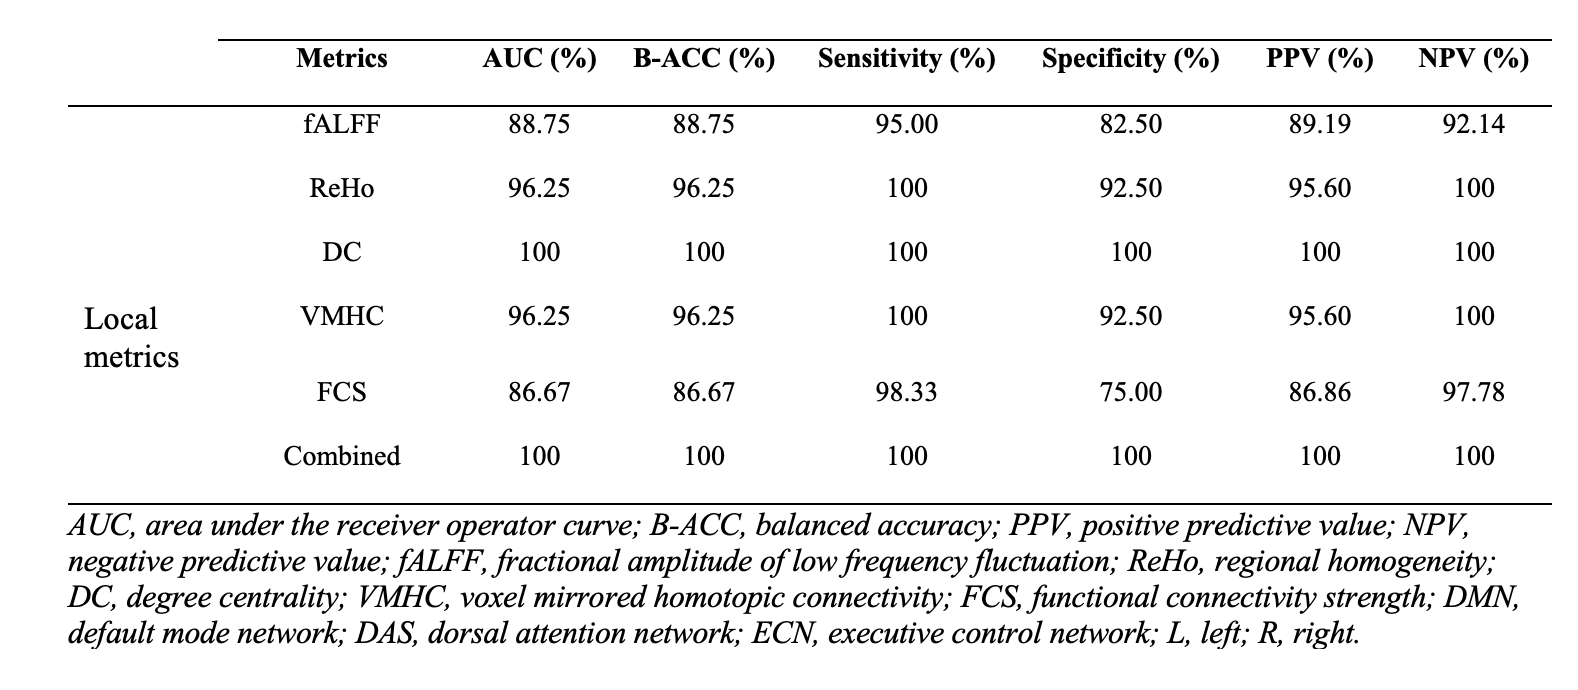
Table 2. Classification performances of single model and combined model for rs-fMRI metrics.
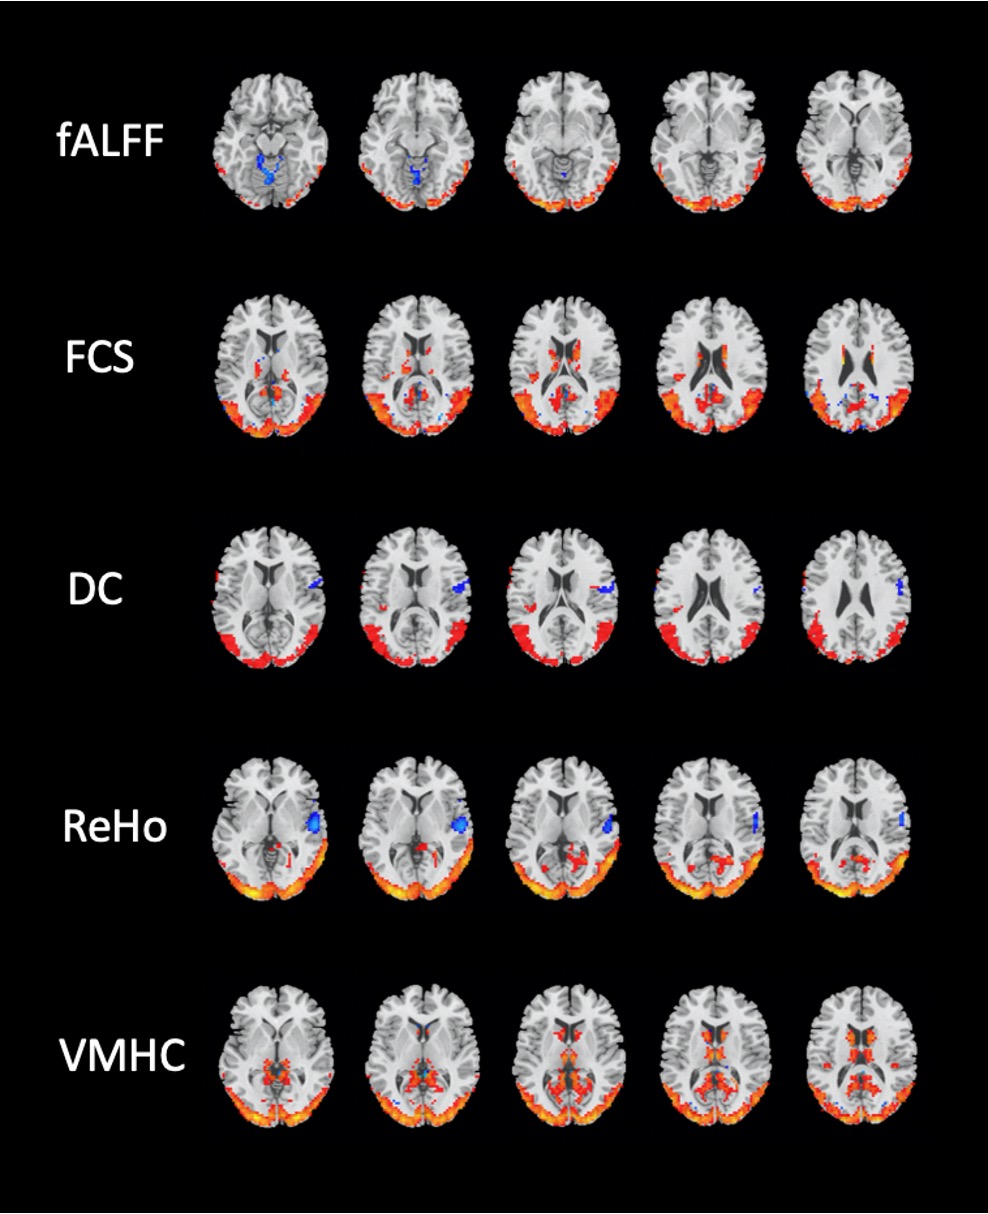
Figure 1. Brain regions with significant differences in rs-fMRI metrics between the mTBI and HCs groups(Two-sample t-test, GRF-corrected, voxel-level p < 0.001, cluster-level p < 0.01).
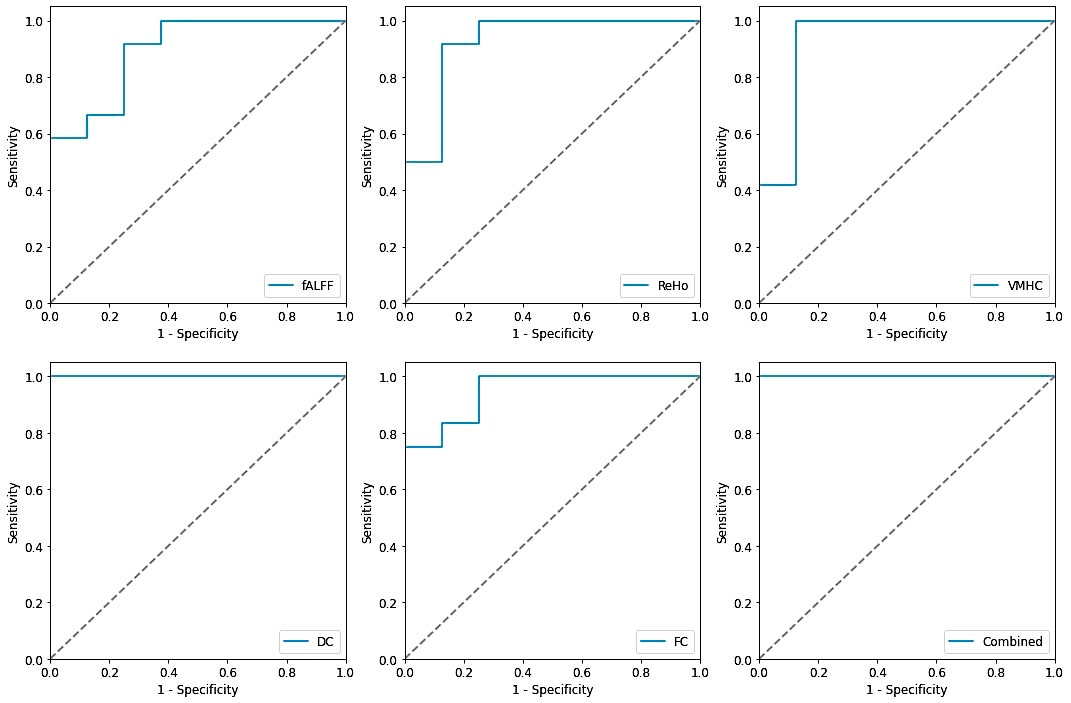
Figure 2. Receiving operating characteristic curve (ROC) of the SVM model based on the single and combined rs-fMRI metrics.
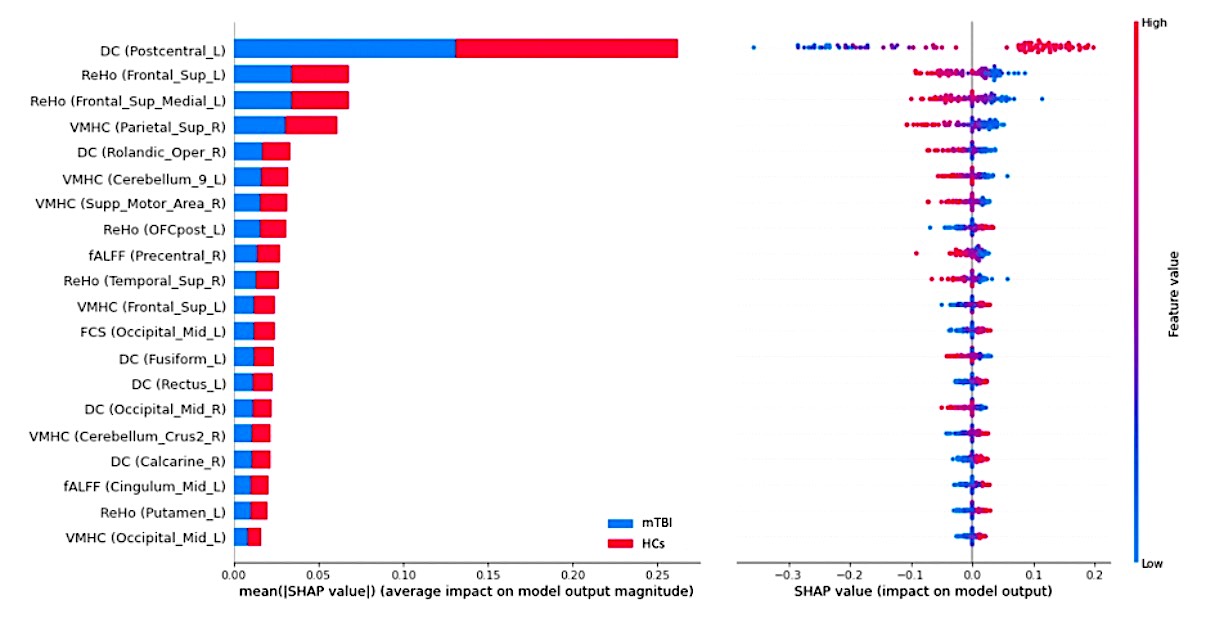
Figure 3. Summary plot of the top 20 features with the most contribution to the model prediction of the rs-fMRI metrics. Left: The mean absolute Shapley Additive explanations (SHAP) values of the features. Right: The SHAP values of features in every sample. Each line represents a feature, and each dot visualizes the SHAP value for one subject and corresponding feature. A positive SHAP value indicates an increase in the risk of predicting mTBI and vice versa. The vertical axis represents both the features, ordered by the mean absolute SHAP values and their distribution.
DOI: https://doi.org/10.58530/2023/0459