0454
Simultaneous Measurements of GABA, Glx and GSH in the Thalamus in Patients with Mild Traumatic Brain Injury: A Preliminary Study1Department of Diagnostic Radiology and Nuclear Medicine, University of Maryland School of Medicine, Baltimore, MD, United States
Synopsis
Keywords: Traumatic brain injury, Spectroscopy, Thalamus, HERMES
In this study, we report the preliminary results of simultaneous measurements of GABA, Glx (glutamate + glutamine), and GSH in the thalamus using HERMES in the mTBI patients. HERMES was acquired in the thalamus for patients in acute, subacute, and chronic stages, and control subjects as reference using optimized acquisition and processing. Metabolite fitting were performed in Gannet with spectral alignment. The results demonstrate that HERMES can maintain the spectral and fitting quality in the mTBI patients versus the control subjects. Differences in the metabolite levels warrant accruing a larger number of patients for a more definite evaluation.Introduction
Previous studies investigating traumatic brain injury (TBI) have implicated altered glutamate (Glu)/γ-aminobutyric acid (GABA)-glutamine (Gln) cycle and such dysfunction was correlated with behavioral outcomes. TBI triggers initial rapid release of Glu, leading to a metabolic energy failure and possibly resulting in neuron cell death1. Long-term consequences of such metabolic failure may lead to brain atrophy2. Another important metabolite, glutathione (GSH), an antioxidant that helps in limiting the damage to the brain cells caused by reactive oxygen species, has been reported to decrease following TBI3-4. We and others have shown that the thalamus which plays a central role as sensory and motor relay station communicating between the sub-cortical regions, cerebellum and the cortex is highly vulnerable to TBI. Therefore we hypothesized that measurement of these metabolites using advanced MR spectroscopy sequence in the thalamus could provide valuable insights into the pathophysiological sequelae of mild TBI (mTBI).5-7The recent development of HERMES (Hadamard Enconding & Reconstruction of Mega PRESS sequence) allows the simultaneous detection of GABA, Glx (Glu + Gln) and GSH. HERMES is a powerful and sensitive technique which has been successfully applied many regions of the brain. Previously we had optimized the acquisition and processing of HERMES acquisition over the thalamus in healthy volunteers. Here we measure the longitudinal changes in these metabolites in the thalamus among mild TBI patients in comparison to control subjects.
Methods
Experiment designHERMES was administered on five groups of subjects, including 3 groups of mTBI patients in the acute (N=10), subacute (N=6), and chronic (N=8) stages, patients with non-brain injury (N=6) that served as controls to the brain injury patients, and healthy adult volunteers (N=9) with no know injuries.
MR acquisition
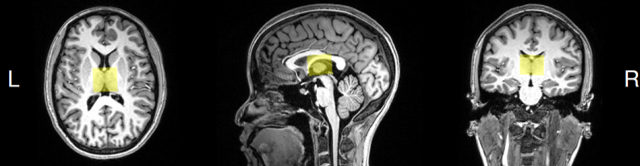
All HERMES experiments were performed on a Siemens PrismaFIT 3T scanner with a 64-channel head coil. The HERMES sequence9, contains four sub-experiments that apply editing to both GABA and GSH, GABA-only, GSH-only or neither in an interleaved fashion. The scan parameters were: TE=80ms, TR=2s with 320 averages (80 averages each sub-experiment). A 3´3´2.5 cm3 voxel of interest covered the bilateral thalamus as shown in Figure 1.
Processing of HERMES spectra and statistical analysis
HERMES data were processed with frequency-and-phase correction using Gannet10-11. Absolute metabolite concentrations in institutional units (i.u.) were obtained following CSF-correction. The metabolite levels between the control patients and the healthy volunteers were compared with unpaired t-test for independent samples. However, since there was no difference between these two groups, these two groups were merged to a single group and were compared with the TBI group in further analysis. The metabolite levels and spectral quality, including fitting errors, peak full width at half maximum (FWHM), and signal-to-noise ratio (SNR) were compared between each mTBI group against the merged control group using unpaired t-test.
Results
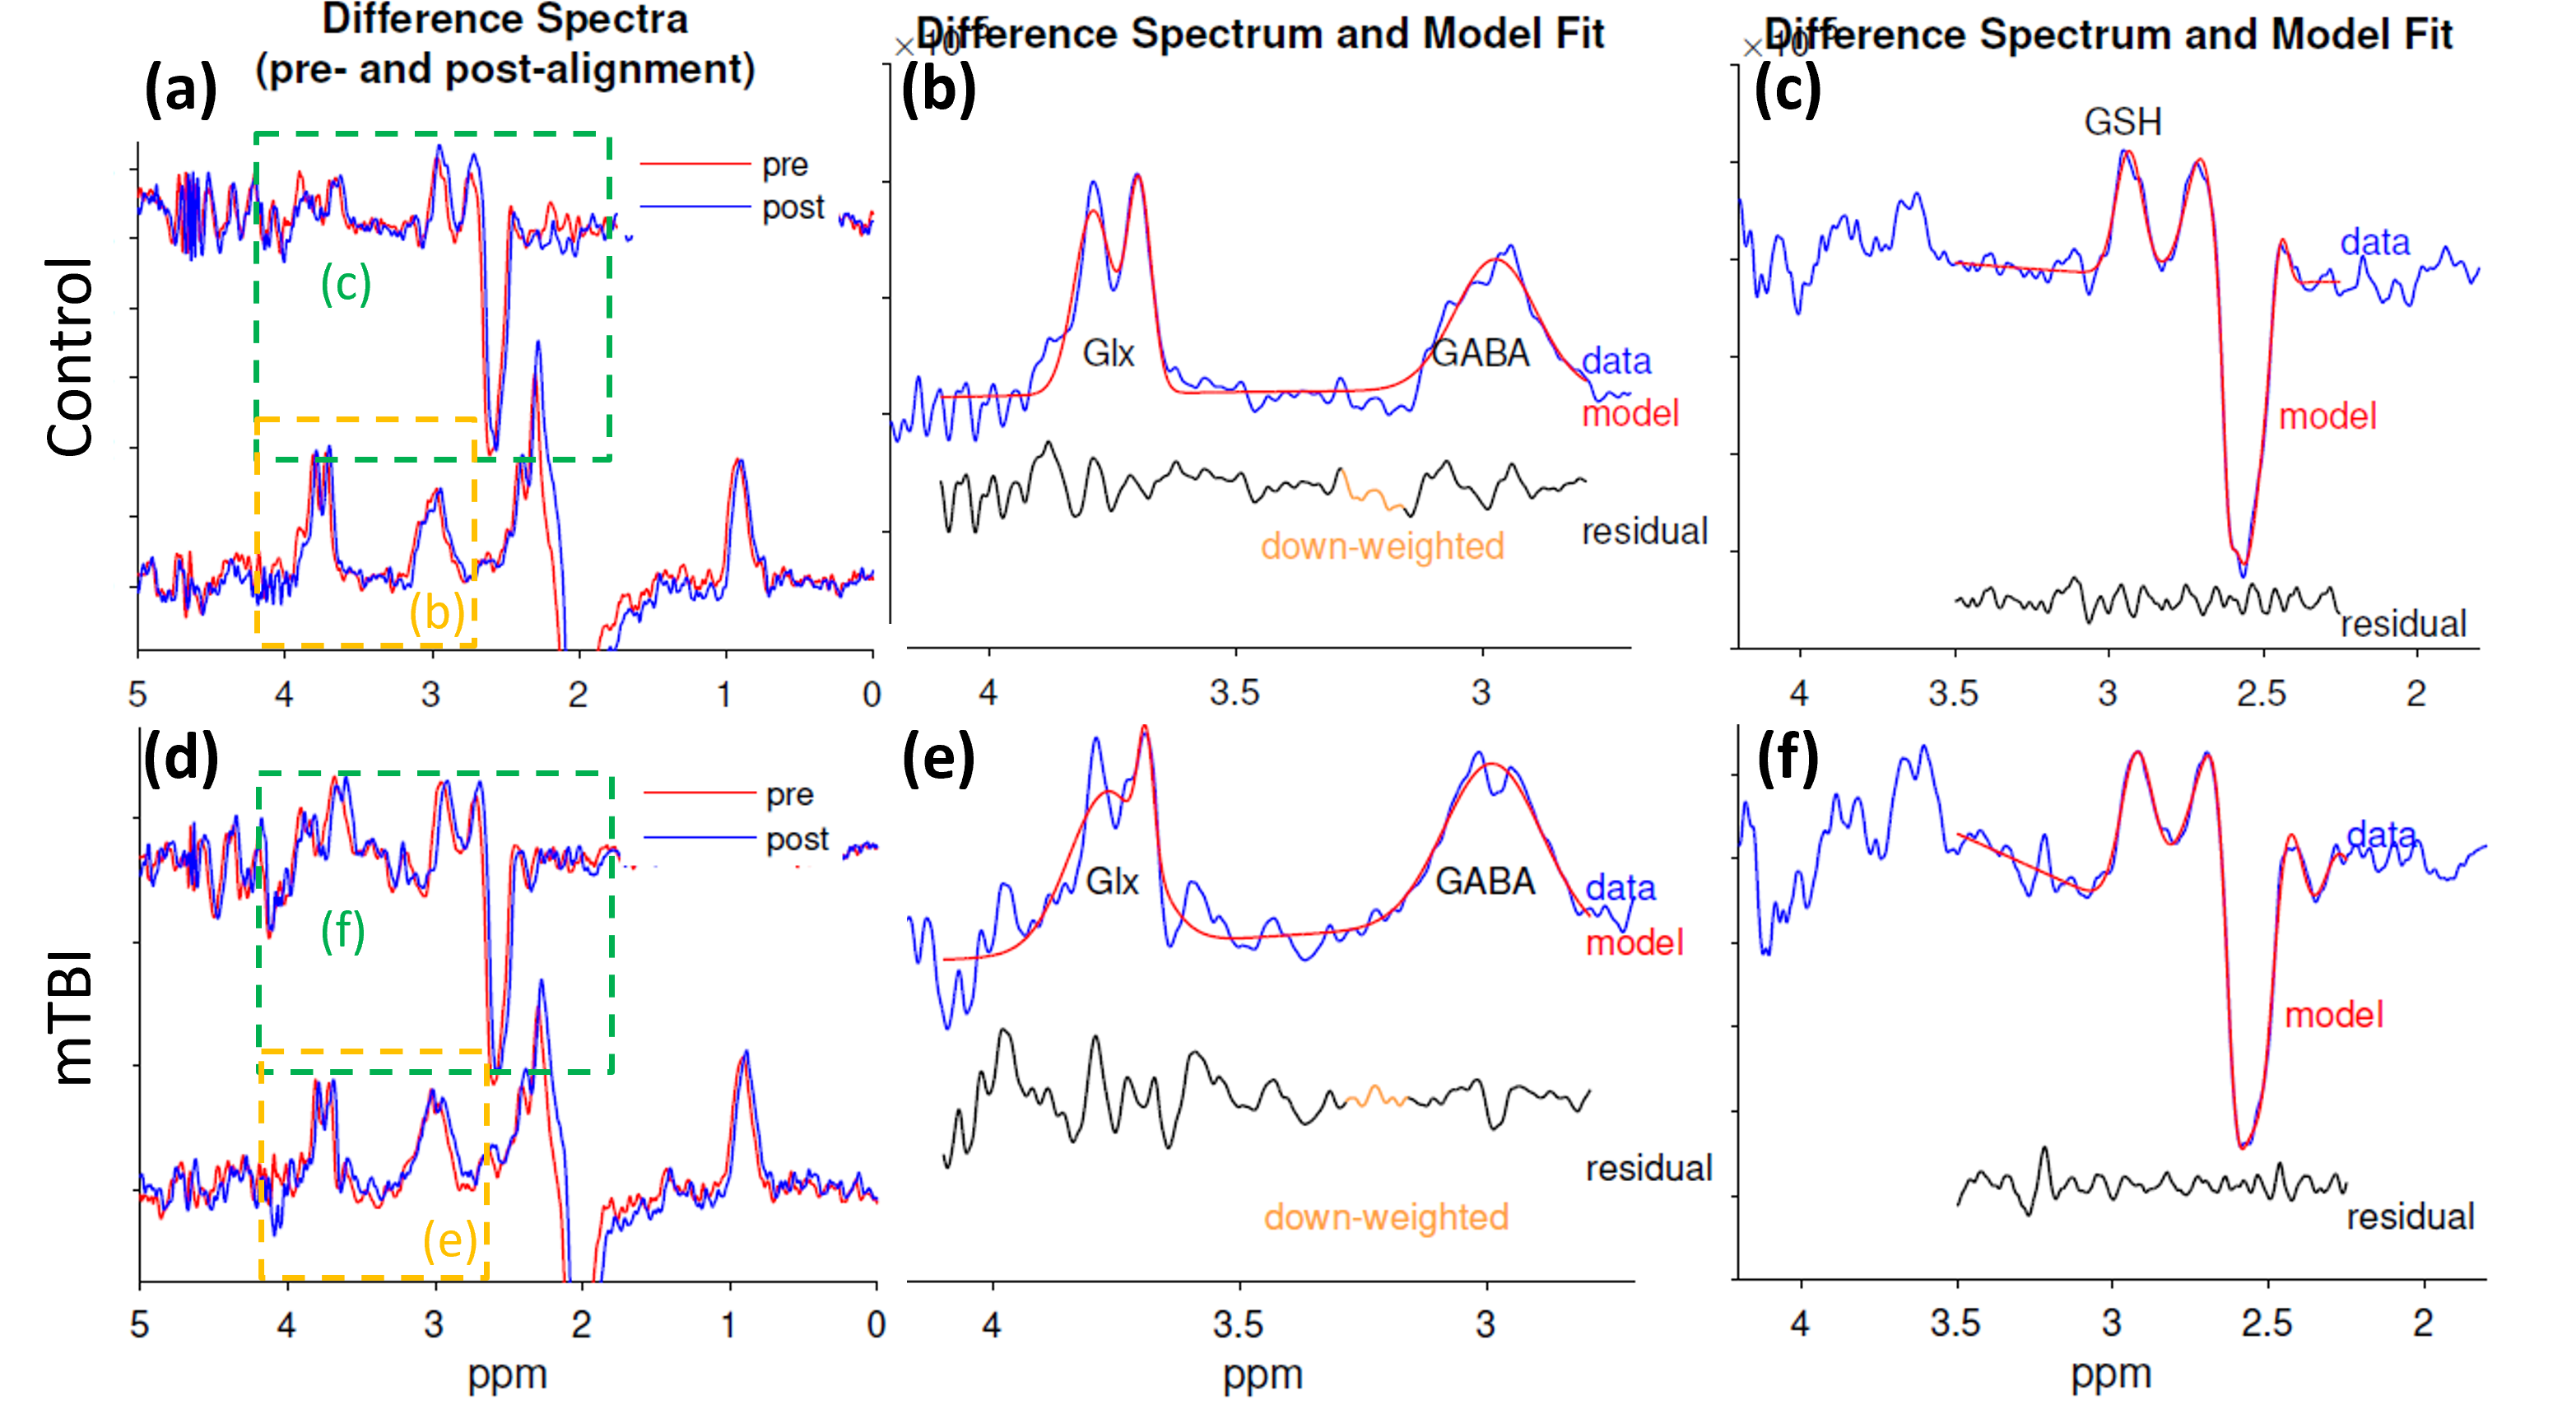
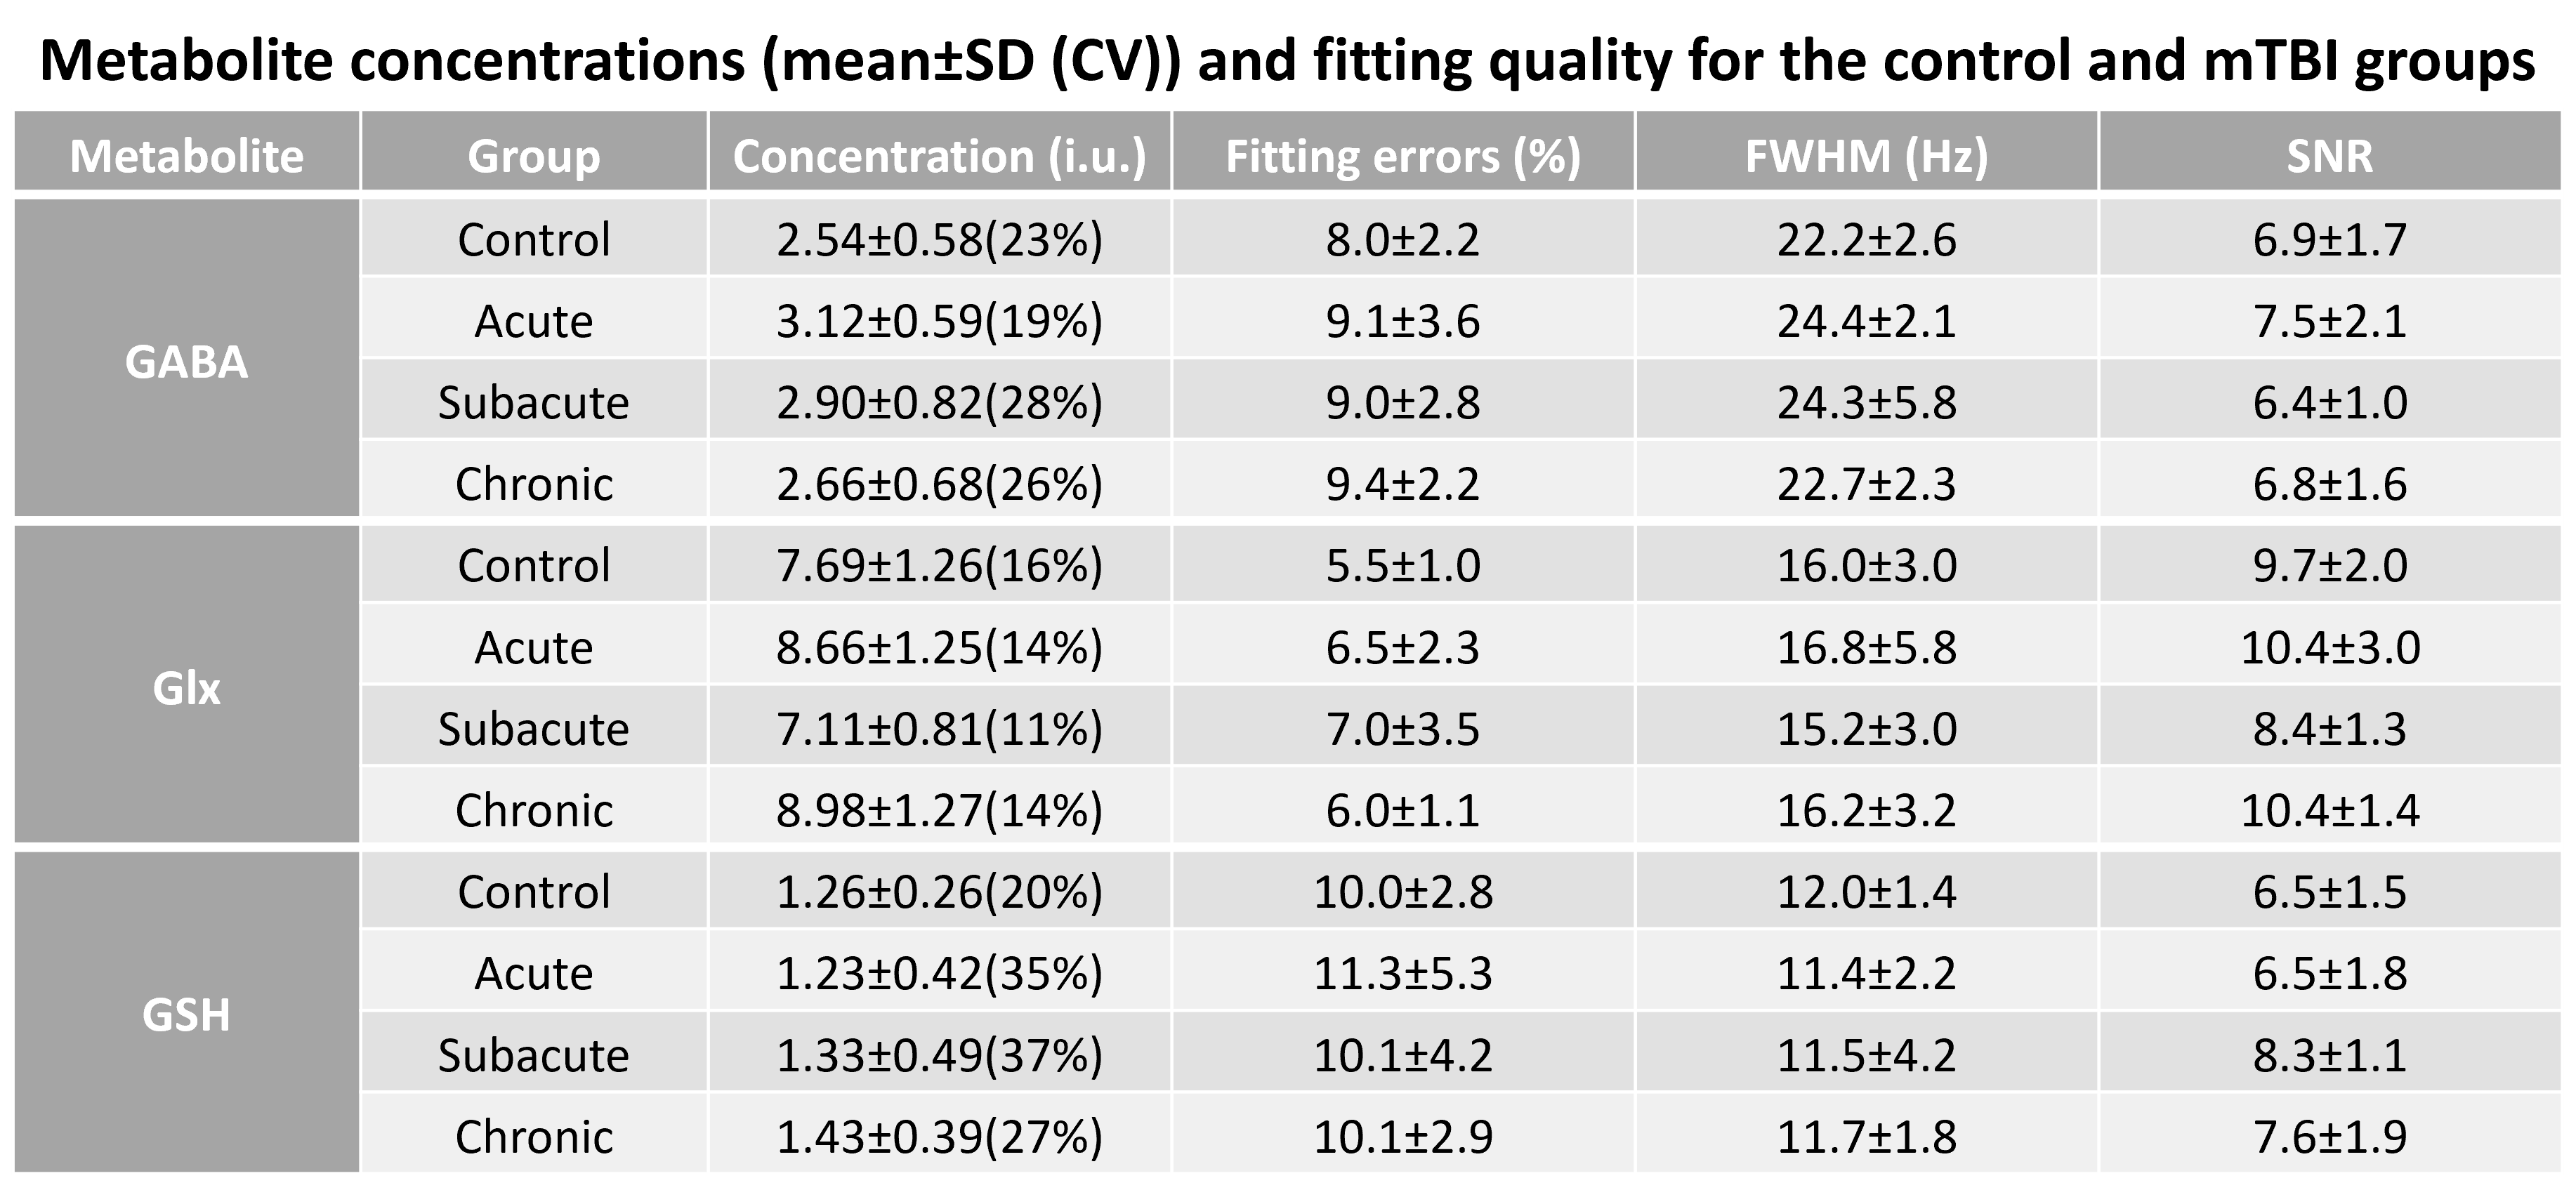
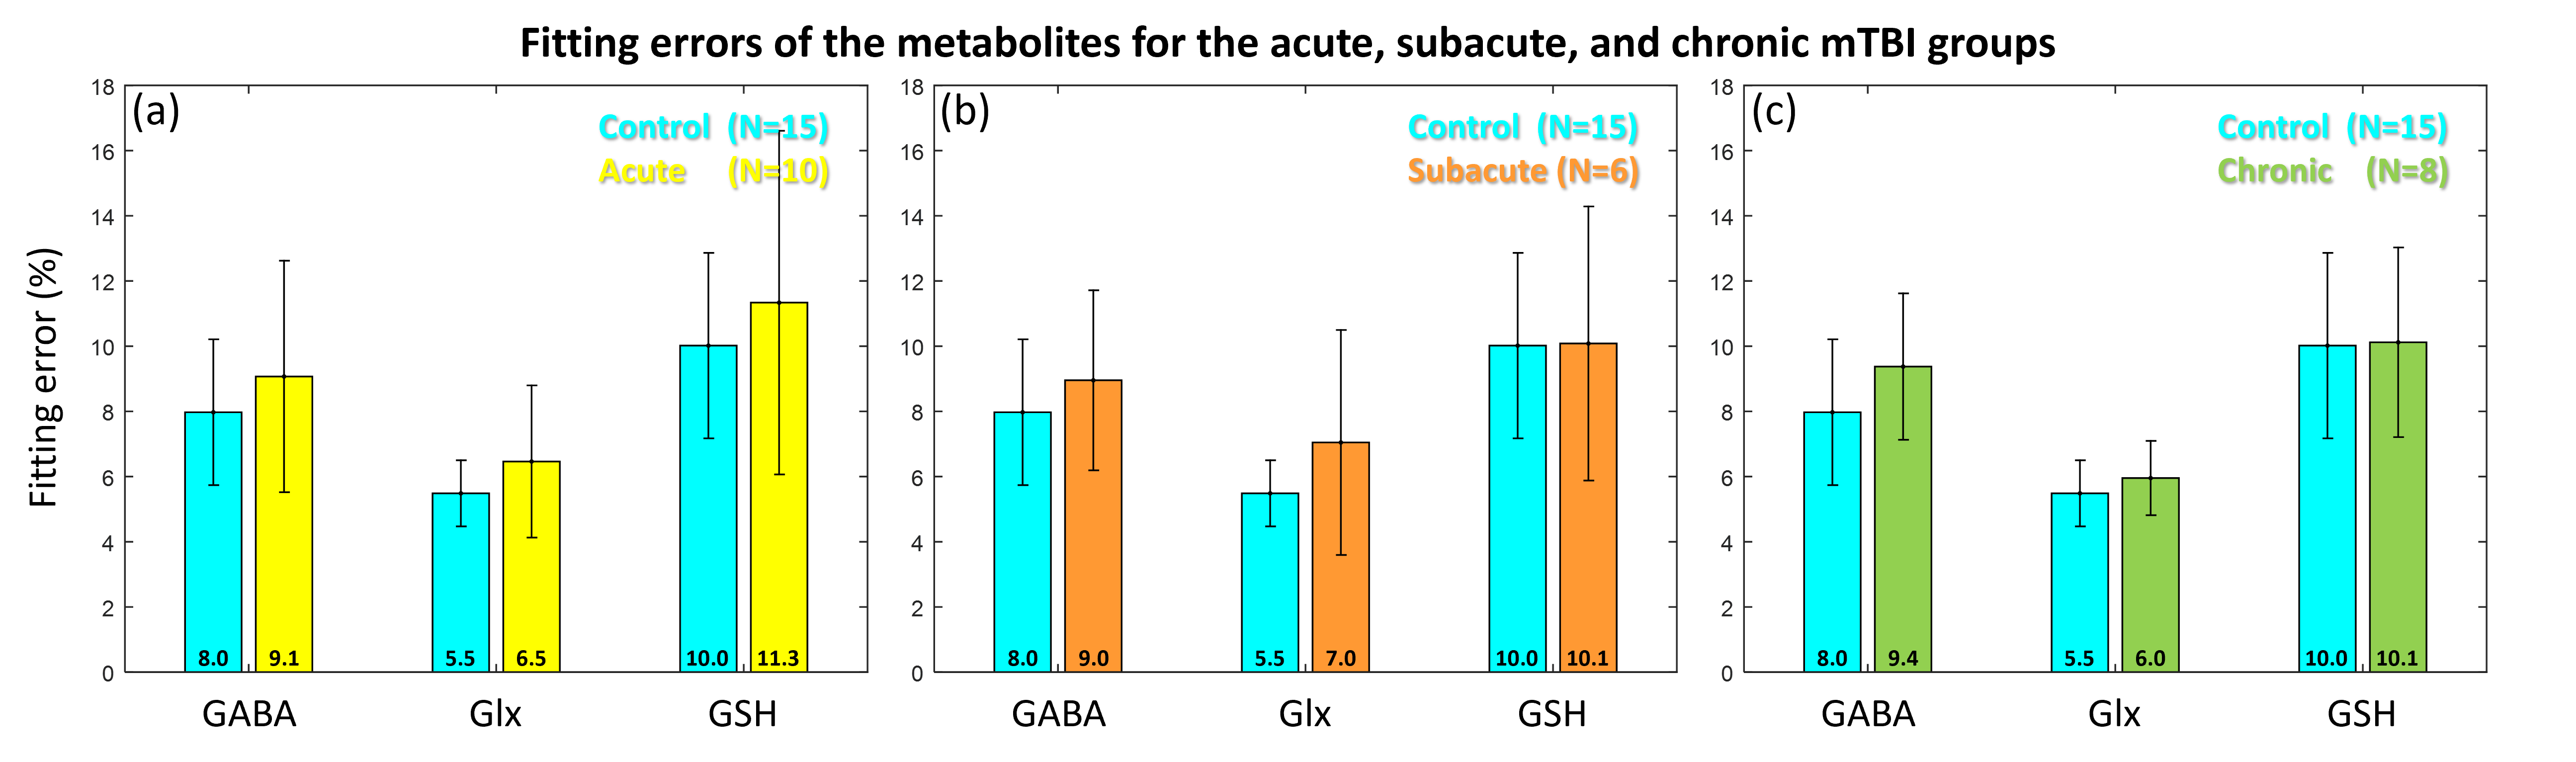
Figure 2 shows the difference spectra (left column) and fitting results (right two columns) for an example control and a mTBI subject. In both cases, the noise level in the difference spectra and residual spectra after fitting are comparably low.Comprehensive results of metabolite levels and the fitting quality are presented in Figure 3. The reliability of the metabolite levels as measured by coefficient of variation (CV) is generally comparable between the mTBI and control subjects. Notably, the mean fitting errors for the three metabolites from all the groups are below 12%, indicating robust HERMES quality in both control and mTBI subjects. Figure 4 further shows no significant difference in the fitting errors was found in any group or metabolite, indicating comparable fitting quality between the mTBI patients and the control subjects.
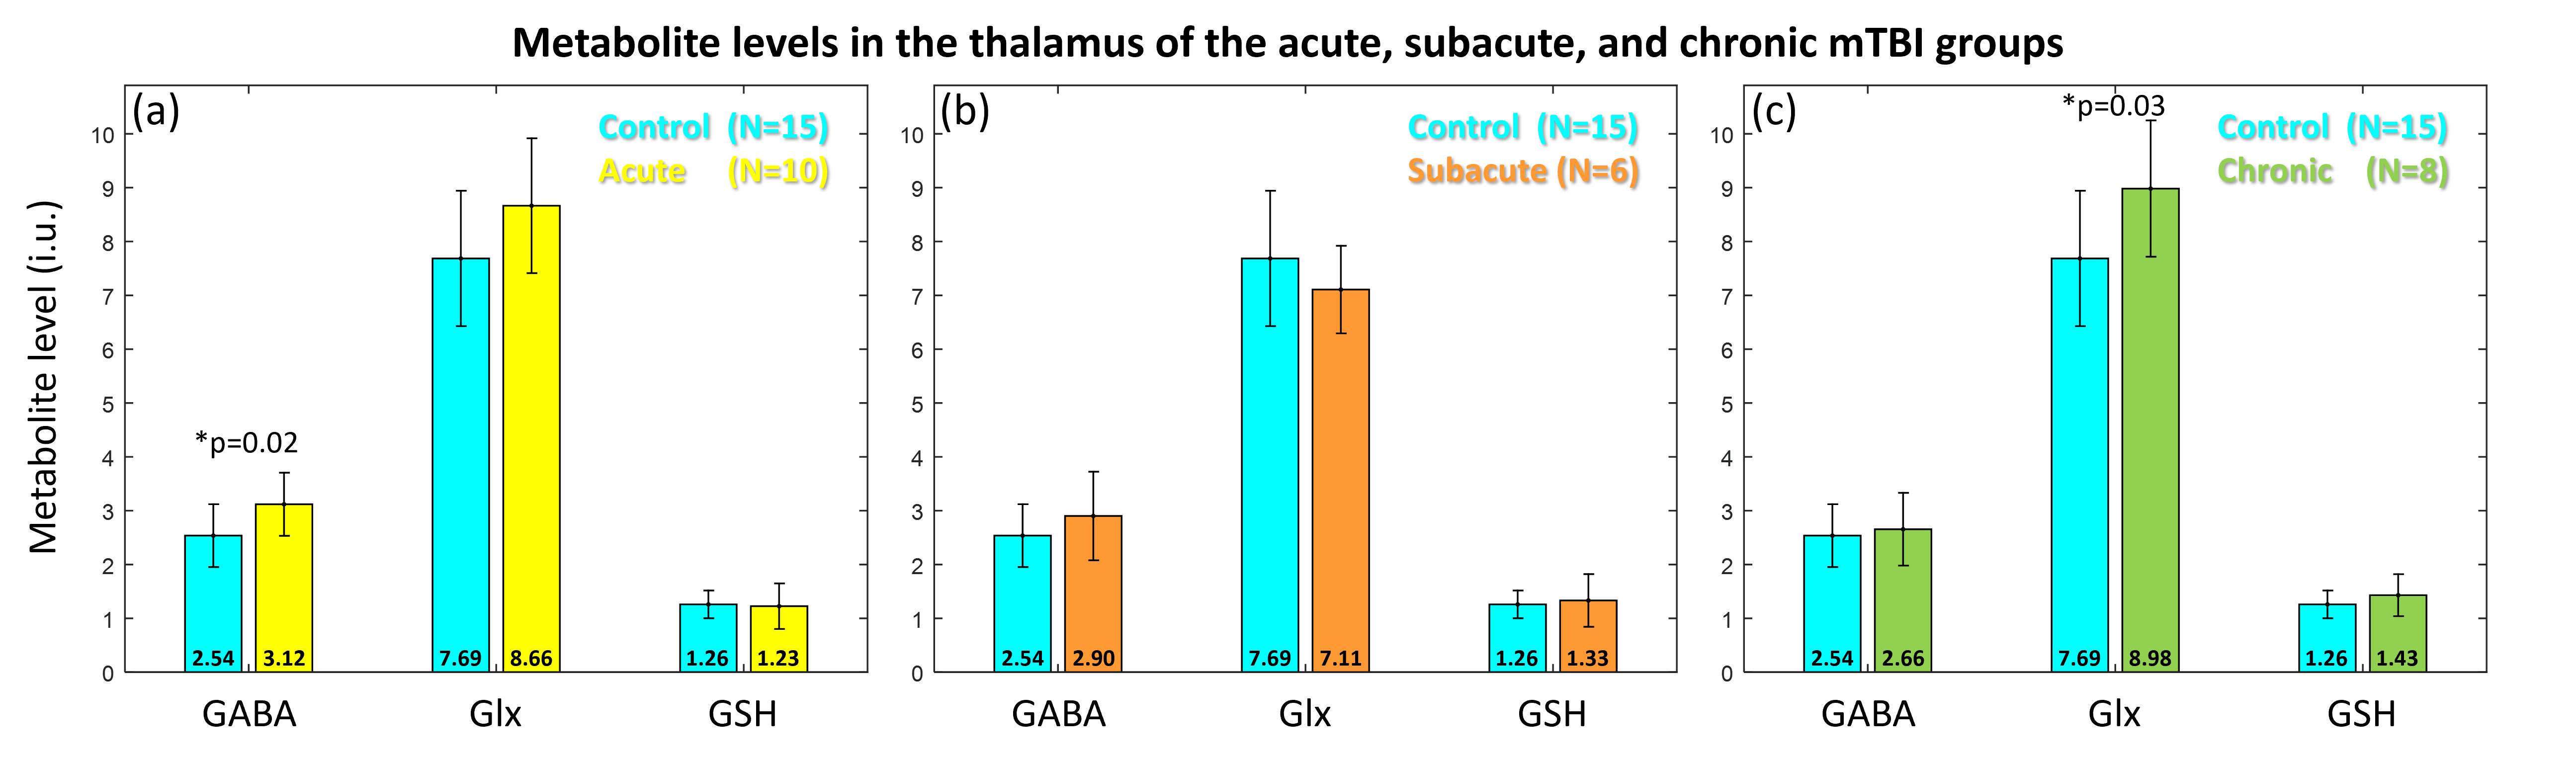
Figure 5 shows a comparison of metabolite levels between the mTBI and the control group. Compared against the control group, GABA and Glx was found to be significantly higher in the acute and chronic mTBI groups, respectively. No significant difference was found for GSH levels. It should be noted that the GSH exhibited higher CV for the mTBI groups compared to the control group.
Discussion
The trend for higher CVs among the mTBI group may likely be attributed to the inherent lower GSH concentrations or higher variability in the underlying physiological or pathological process.Simultaneous increase of GABA and Glx in the thalamus in the acute group suggests an immediate imbalance in the inhibitory and excitatory pathways to facilitate normal tissue functioning. Elevated levels of Glx in the chronic group may suggest ongoing chronic inflammation leading to excitotoxic conditions in the thalamus. It is quite likely that a continued imbalance may could potentially lead to thalamic atrophy and also result in behavioral deficits. It should be noted that these findings are preliminary due to the small sample size. The study will continue accruing patients which will enable us to more definitely evaluate the metabolic state of the thalamus in mTBI patients.
Conclusion
In this study, we demonstrate the feasibility of simultaneous measurements of GABA, Glx and GSH in the thalamus using HERMES in the mTBI patients. HERMES yielded three important metabolite data in a single scan with excellent SNR. Preliminary results suggest imbalance between the excitatory and inhibitory pathways in the acute stage and a sustained excitatory state in the chronic stage.Acknowledgements
The study was conducted at University of Maryland School of Medicine Center for Innovative Biomedical Resources, Translational Research in Imaging @ Maryland (CTRIM) – Baltimore, Maryland. The study is supported by NIH under grant 5R01NS105503 and grant K99DA051315. We thank Dr. Richard Edden from Johns Hopkins University for providing us with the HERMES sequence.
References
1. Guerriero RM, Giza CC, Rotenberg A. Glutamate and GABA imbalance following traumatic brain injury. Curr Neurol Neurosci Rep. 2015;15(5):27. doi:10.1007/s11910-015-0545-1
2. Wu L, Zhou F, Zhang Y, et al. Thalamic atrophy and dysfunction in patients with mild-to-moderate traumatic diffuse axonal injury: a short-term and mid-term MRI study. Neuroreport. 2018;29(15):1282-1287. doi:10.1097/WNR.0000000000001106
3. Chi L, Ke Y, Luo C, Gozal D, Liu R. Depletion of reduced glutathione enhances motor neuron degeneration in vitro and in vivo. Neuroscience. Feb; 2007 144(3):991–1003.
4. Olanow CW. An introduction to the free radical hypothesis in Parkinson’s disease. Ann Neurol. 1992; 32(Suppl):S2–9
5. O'Neill J, Lai TM, Sheen C, et al. Cingulate and thalamic metabolites in obsessive-compulsive disorder. Psychiatry Res Neuroimaging. 2016;254:34-40. doi:10.1016/j.pscychresns.2016.05.005
6. Bathel A, Schweizer L, Stude P, et al. Increased thalamic glutamate/glutamine levels in migraineurs. J Headache Pain. 2018;19(1):55. Published 2018 Jul 17. doi:10.1186/s10194-018-0885-8
7. Younis S, Hougaard A, Christensen CE, et al. Feasibility of Glutamate and GABA Detection in Pons and Thalamus at 3T and 7T by Proton Magnetic Resonance Spectroscopy. Front Neurosci. 2020;14:559314. Published 2020 Oct 23.
8. Liang X, Saleh MG, Roys S, Gullapalli RP, Zhuo J. Feasibility of Simultaneous Measurements of GABA, Glx and GSH in the Thalamus Using HERMES. 2022 Joint Annual Meeting ISMRM-ESMRMB, London, UK, May 7-12, 2022
9. Saleh MG, Oeltzschner G, Chan KL, Puts N, Mikkelsen M, Schär M, Harris AD, Edden R. Simultaneous edited MRS of GABA and glutathione. NeuroImage 2016;142:576–582.
10. Chan KL, Puts NA, Schär M, Barker PB, Edden RA. HERMES: Hadamard encoding and reconstruction of MEGA-edited spectroscopy. Magn Reson Med. 2016;76(1):11-19.
11. Edden RAE, Puts NAJ, Harris AD, Barker PB, Evans CJ. Gannet: A batch-processing tool for the quantitative analysis of gamma-aminobutyric acid– edited MR spectroscopy spectra. J Magn Reson Imaging JMRI. Dec; 2014 40(6):1445–52.
Figures