0452
Radiomic profiling and classification of active vs. inactive multiple sclerosis lesions using quantitative MRI1The Department of Biomedical Engineering, Tel-Aviv University, Tel-Aviv, Israel, 2Sackler School of Medicine, Tel-Aviv University, Tel-Aviv, Israel, 3Department of Diagnostic Imaging, Sheba Medical Center, Ramat-Gan, Israel, 4Sagol School of Neuroscience, Tel-Aviv University, Tel-Aviv, Israel, 5Center for Advanced Imaging Innovation and Research (CAI2R), New-York University Langone Medical Center, New-York, NY, United States
Synopsis
Keywords: Multiple Sclerosis, Contrast Agent
Multiple sclerotic (MS) patients undergo routine MRI examination in order to monitor disease state and progression. The gold standard way to assess disease activity is by identifying the amount of active lesions using contrast enhanced imaging. The use of gadolinium-based contrast agents constitute a major radiologic concern as these are known to accumulate in the body for years without an effective clearance mechanism. In this study we investigated the utility of Radiomic profiling of lesions as an alternative for contrast injection. We show that the quantitative MRI (qMRI) markers have the potential to classify lesions to active/inactive.Introduction
MS is an autoimmune chronic inflammatory disease which damages the central nervous system, in a process of lesion formation, inflammation, and demyelination. MS leads to severe motoric and cognitive deterioration while the activity of the disease determines the course of treatment1-3. Radiologically, disease activity is identified by injecting gadolinium contrast agent (CA) and performing contrast enhanced MRI, where active lesions undergo signal enhancement while inactive (chronic) lesions remain hypointense4. Several studies report on long-term gadolinium accumulation in the brain. Increased in gadolinium deposition in the dentate nucleus (DN), globus pallidus (GP), and thalamus in early MS is associated with lifetime cumulative Gd administration without clinical or radiologic correlates of more aggressive disease5. In this study, we investigated an alternative to the Gd injection by generating Radiomic profiles of MS lesions based on their proton density and T2 relaxation times. These profiles were used in two supervised machine learning classifiers, XGBoost6-8 and logistic regression9, which were trained to differentiate active and inactive lesions (i.e., without the need for contrast injection), while ground truth labeling was done based on gold standard approach of comparing pre- and post-contrast MRI scans and identifying enhancing (active) vs. non-enhancing (inactive) lesions.Methods
Patient population: The study was approved by the Helsinki committee of Sheba medical center (approval No. 3933-17-SMC). Eight patients with active lesions were selected for the study and additional 17 MS patients with verified inactive lesions. In total, we identified 39 active lesions and 57 inactive lesions.MRI scans: MRI scans were performed on a 3 Tesla Siemens Prisma Scanner and included: T1-weighted MPRAGE pre and post-contrast, FLAIR, and multi-echo spin-echo (MESE) for quantitative mapping of T2 and proton density (PD) [TR = 4600 ms; echo-spacing (TE) = 12 ms; echo-train-length (ETL) = 11; matrix size = 112x128; FOV = 200x220 mm2; Slice thickness = 3 mm; acceleration = x2 GRAPPA].
Data post-processing: T2 and PD values were estimated using the EMC algorithm10,11. Quantitative features were extracted for each lesion including mean, standard deviation (SD), standard error of the mean (SE), and 5, 25, 50 (median), 75 percentile values.
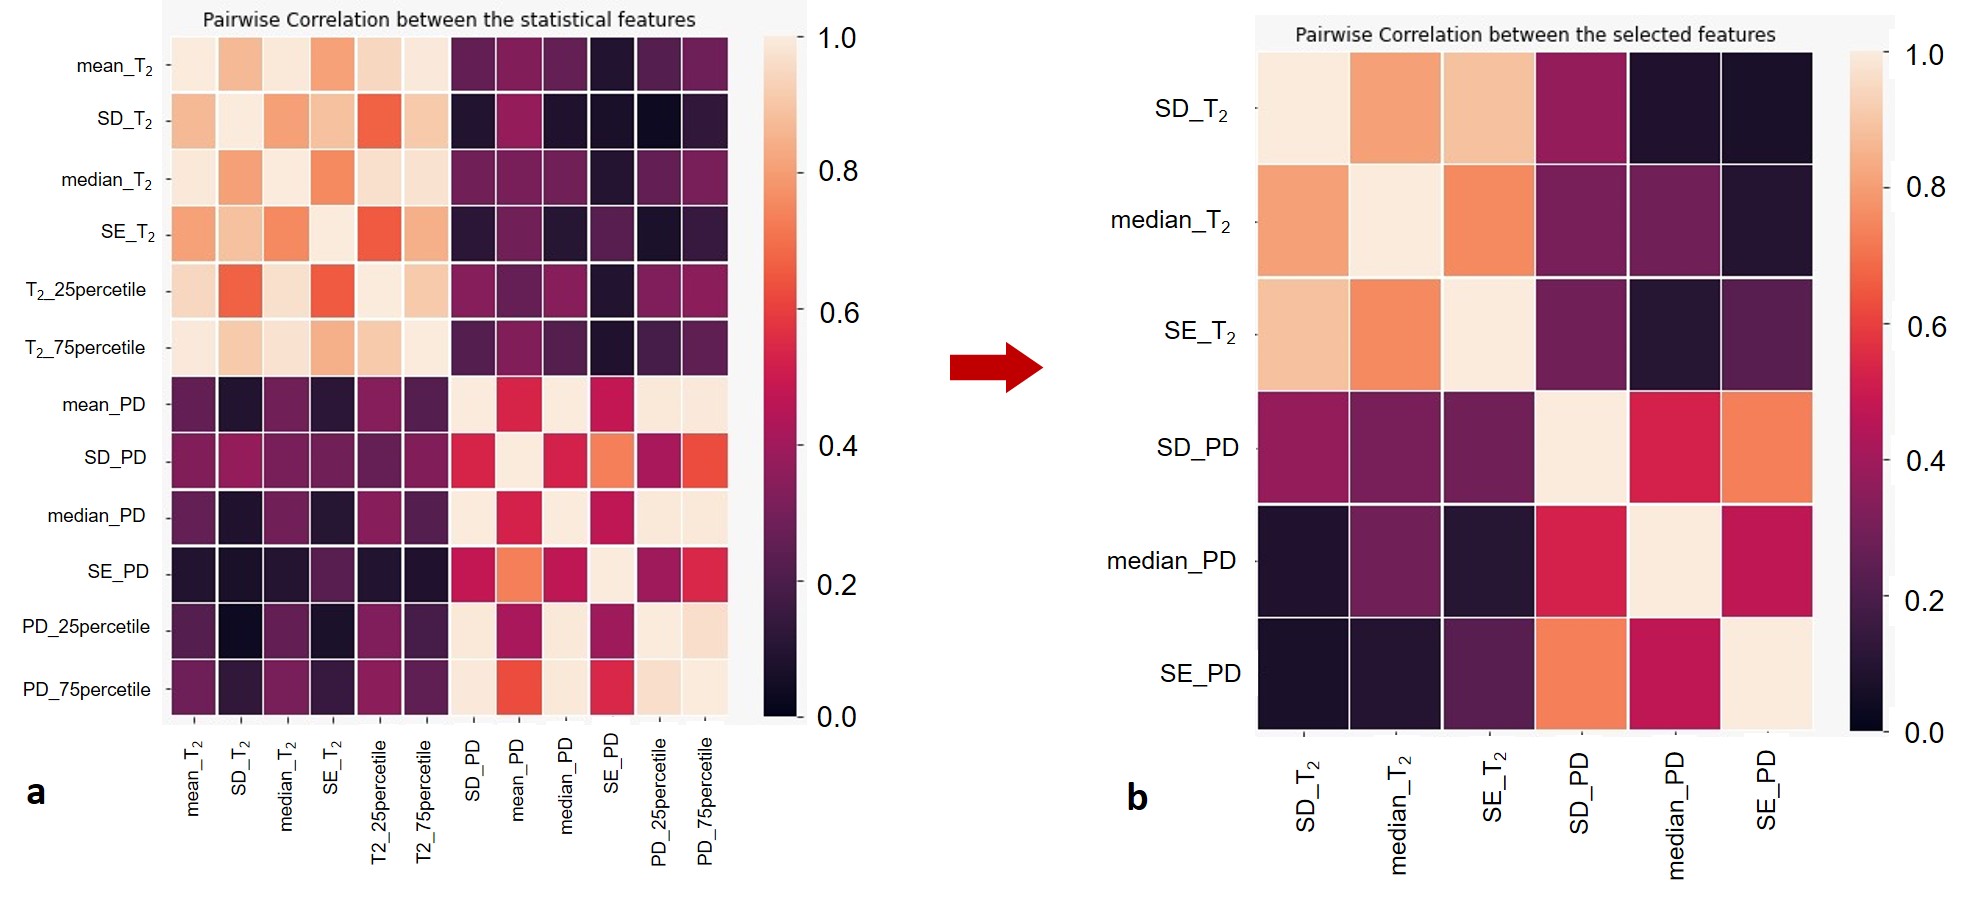
Statistical analysis: Pairwise correlation coefficients were computed between each quantitative feature in order to exclude linearly dependent features. The correlation matrix was generated from the Seaborn library in Python, followed by excluding one feature from every pair that produced a correlation coefficient of 0.8 and above.
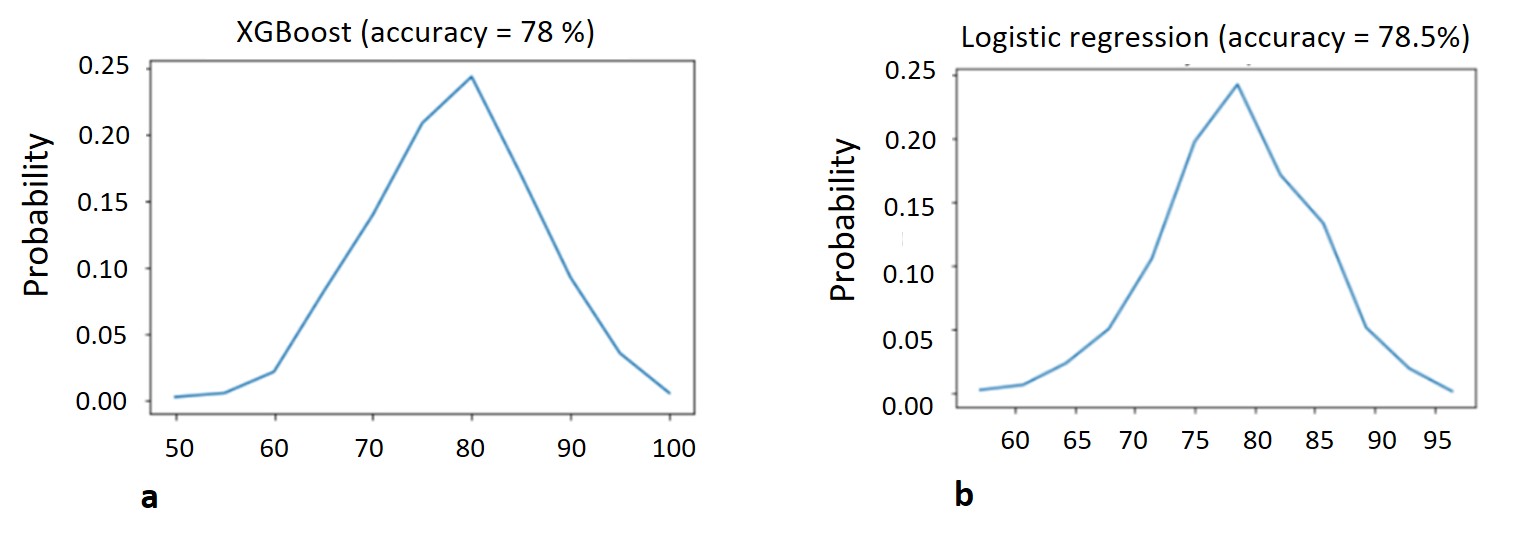
Classification: The subset of linearly independent features was inputted into two machine learning classifiers: XGBoost – a gradient-boosted decision tree, and standard logistic regression. Models were trained on 80% of the data (train and validation), while classification accuracy was estimated on the remaining 20% of the lesions. This was repeated a thousand times, with different random separation of the data to train, validation, and test. Overall accuracy score was then calculated as the average of all runs.
Results
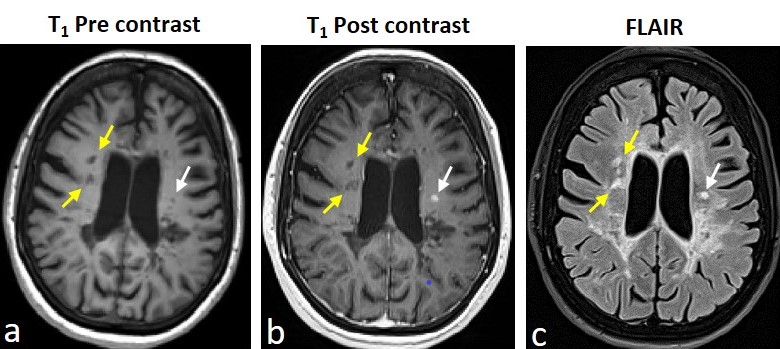
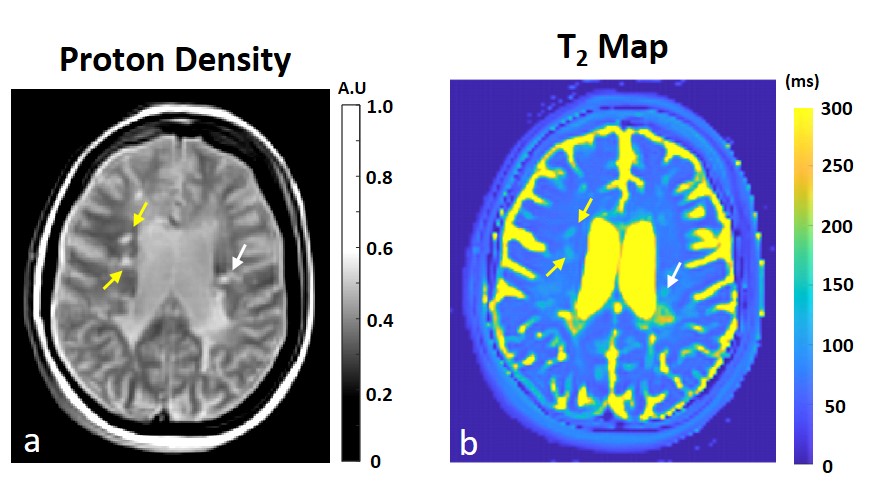
The lesions were marked on T1w pre and post contrast and FLAIR images using in-house GUI (Figure 1) and were divided as active or inactive according to the Gd enhancement. After marking all lesions, professional radiologists were conducted to assure lesion type identification. The lesions present with quantitative values T2 and PD maps and were used for statistical estimation between the active and inactive lesions (Figure 2). A pairwise correlation matrix between the selected features from machine learning models showed a correlation between 12 features that were picked (Figure 3a) and the six features which were given a lower correlation (Figure 3b). The results from testing both models XGBoost (Figure 4a) and logistical regression (Figure 4b). The predictive accuracy in expectation of an active vs. inactive MS lesion is 78% and 78.5% respectively.Discussion
In this study, we investigated whether quantitative MRI data, derived from T2 and PD maps, could be used to differentiate between active and inactive MS lesions. Machine-learning classifiers trained on radiomic profiles of lesions showed predictive accuracy of ~78% suggesting that that this approach has the potential to identify local disease activity. Expanded radiomic profiles based on additional contrast mechanisms might improve the classification accuracy and provide an alternative to Gd based CA injection, particularly for MS patients that undergo frequent MRI scans or with adverse response to CAs.Acknowledgements
No acknowledgement found.References
1. Dobson R, Giovannoni G. Multiple sclerosis - a review. Eur J Neurol. 2019 Jan;26(1):27-40.
2. McGinley MP, Goldschmidt CH, Rae-Grant AD, Diagnosis and Treatment of Multiple Sclerosis: A Review. JAMA. 2021 Feb 23; 325(8):765-779.
3. Correale J, Gaitán MI, Ysrraelit MC, Fiol MP. Progressive multiple sclerosis: from pathogenic mechanisms to treatment. Brain. 2017 Mar 1;140(3):527-546.
4. Grossman RI, Gonzalez-Scarano F, Atlas SW, Galetta S, Silberberg DH. Multiple sclerosis: gadolinium enhancement in MR imaging. Radiology. 1986 Dec;161(3):721-5.
5. Zivadinov R, Bergsland N, Hagemeier J, Ramasamy DP, Dwyer MG, Schweser F, Kolb C, Weinstock-Guttman B, Hojnacki D. Cumulative gadodiamide administration leads to brain gadolinium deposition in early MS. Neurology. August 06, 2019; 93 (6).
6. Chen T, Guestrin C. XGBoost: A Scalable Tree Boosting System. 2016 https://arxiv.org/abs/1603.02754.
7. Borstelmann SM. Machine Learning Principles for Radiology Investigators. Acad Radiol. 2020 Jan;27(1):13-25.
8. Wang X, You X, Zhang L, Huang D, Aramini B, Shabaturov L, Jiang G, Fancorresponding J. A radiomics model combined with XGBoost may improve the accuracy of distinguishing between mediastinal cysts and tumors: a multicenter validation analysis. Ann Transl Med. 2021 Dec; 9(23): 1737. 9. Gudivada, V. N., Irfan, M. T., Fathi, E., & Rao, D. L. (2016). Cognitive Analytics: Going Beyond Big Data Analytics and Machine Learning. Handbook of Statistics, 35, 169–205.
10. Ben-Eliezer N, Sodickson DK, Block KT. Rapid and accurate T2 mapping from multi-spin-echo data using bloch-simulation-based reconstruction. Magn Reson Med. 2015;73(2):809-817.
11. Radunsky D, Stern N, Nassar J, Tsarfaty G, Blumenfeld-Katzir T, Ben-Eliezer N. Quantitative platform for accurate and reproducible assessment of transverse (T2) relaxation time. NMR Biomed. 2021;34(8):1-14.
Figures