0451
Affinity of Structural White Matter Tracts between Infant and Adult Pigs1Department of Physics and Astronomy, Franklin College of Arts and Sciences, University of Georgia, Athens, GA, United States, 2College of Family and Consumer Sciences, University of Georgia, Athens, GA, United States, 3Regenerative Bioscience Center, University of Georgia, Athens, GA, United States
Synopsis
Keywords: Brain Connectivity, Diffusion/other diffusion imaging techniques, Tractography
Affinity of structural white matter tracts during development is critical for longitudinal studies of many neurological diseases and brain injuries. Diffusion weighted imaging (DWI) data was collected from 3-week-old piglets. Data-driven tractography analysis was applied to profile white matter tracts for the piglets, which were then compared to recently reported 27 adult pig white matter tracts. Among the 27 tracts, 17 were found with consistent high spatial correlations between infant and adult pigs. This result provides possibilities to further study white matter during development, and to evaluate how different interventions (e.g., TBI) alter the brain myelination trajectory.Introduction
Due to significant similarities in brain anatomy, physiology, and development, the pig model has drawn growing interest recently1,2. Moreover, the pig shares similar organ size and lifespan with humans and is often employed to model human diseases and recovery3. The adult pig brain has already been structurally mapped and shown to share a common connectivity space to facilitate pig-human cortical alignment4. On the other hand, a piglet model, a surrogate pediatric model, has yet to be developed despite having significant potential in studying long-term recovery after brain injury, neurodevelopment, and nutrition studies. However, there has been a lack of structural connectivity comparison between infant and adult pig brains. In this study, we evaluated white matter (WM) tractography affinity between the infant and adult pig brain utilizing diffusion weighted magnetic resonance imaging (DWI) data acquired from 11 healthy piglets.Methods
Animal preparation and MRI acquisition: T1-weighted anatomical, DW-MRI, and phase images were collected from piglets (n = 11, 3 weeks of age) using a GE 32-channel fixed-site Discovery MR750 3.0 Tesla magnet and an 8-channel knee coil. All work in this study was conducted in accordance with the University of Georgia Institutional Animal Care and Use Committee (IACUC) guidelines. Preprocessing of DWI data: The collected DW-MRI images were firstly skull stripped by using FSL bet5, and then corrected for Eddy current and motion artifact through FSL Eddy6. Image distortions caused by susceptibility were also corrected with FSL Eddy using field maps generated by FSL prelude. The corrected DW-MRI images were fed into FSL BedpostX7 procedure to generate two-fiber tensor model estimations for the probabilistic data-driven tractography analysis. Voxel-based data-driven tractography: For each subject, the gray matter (GM) mask was generated from the pig brain atlas8. Matrices of streamlines (Figure 1, the blue matrix Du*v) that pass from each voxel in the GM mask to every voxel in the whole brain mask were generated. This was achieved by using FSL probtractx7 for each subject with a number of samples of 500. Fifty independent components (ICs) in the gray matter dimension and their corresponding activation maps in the brain space were calculated by applying Fast ICA to the streamline probability matrix. The spatial correlation coefficient matrices (Figure 1, the orange matrix Rm*n) were found between the heatmaps (purple) and 27 White Matter (WM) tracts of adult pigs (red), recently reported by Austin et.al. 4. This procedure was applied to all 11 subjects, and results were collected to show each subject components’ similarity with the WM tract atlas.Results
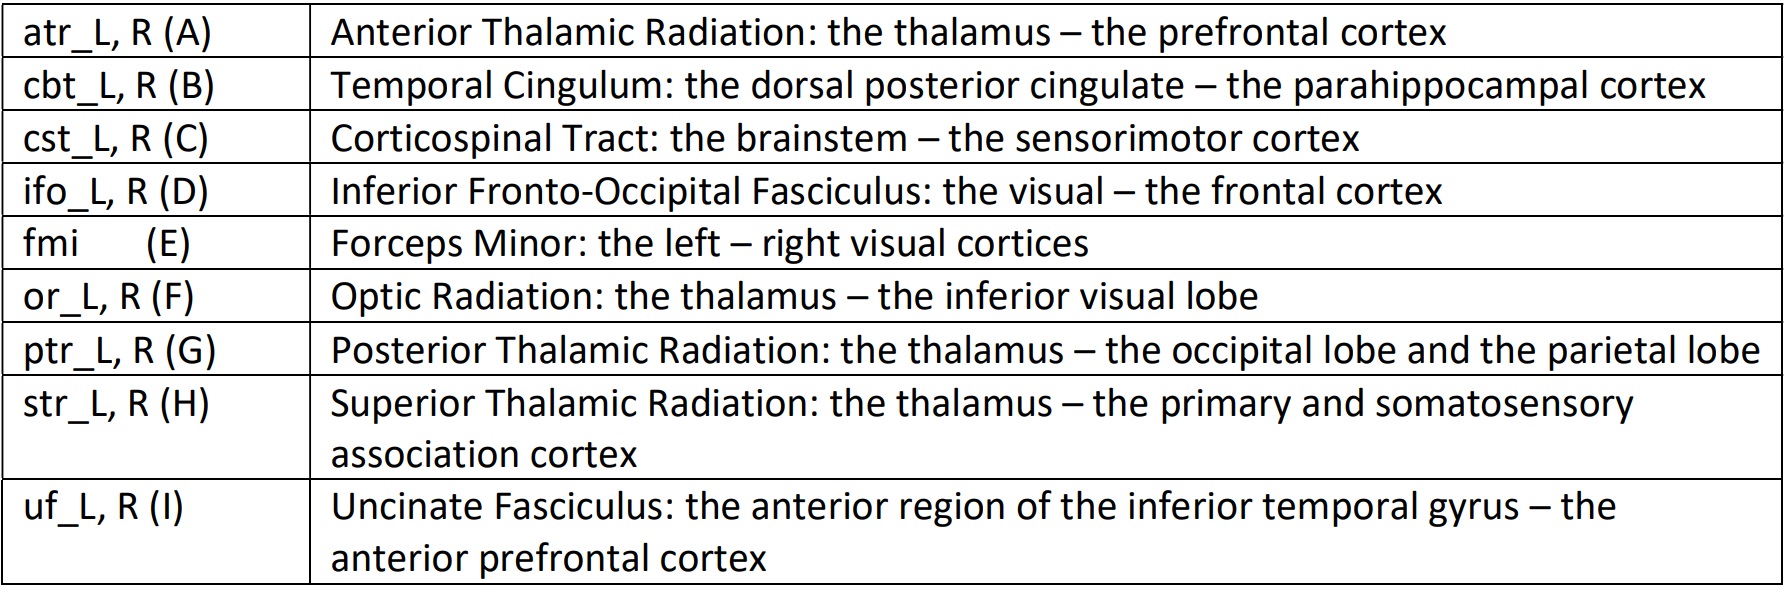
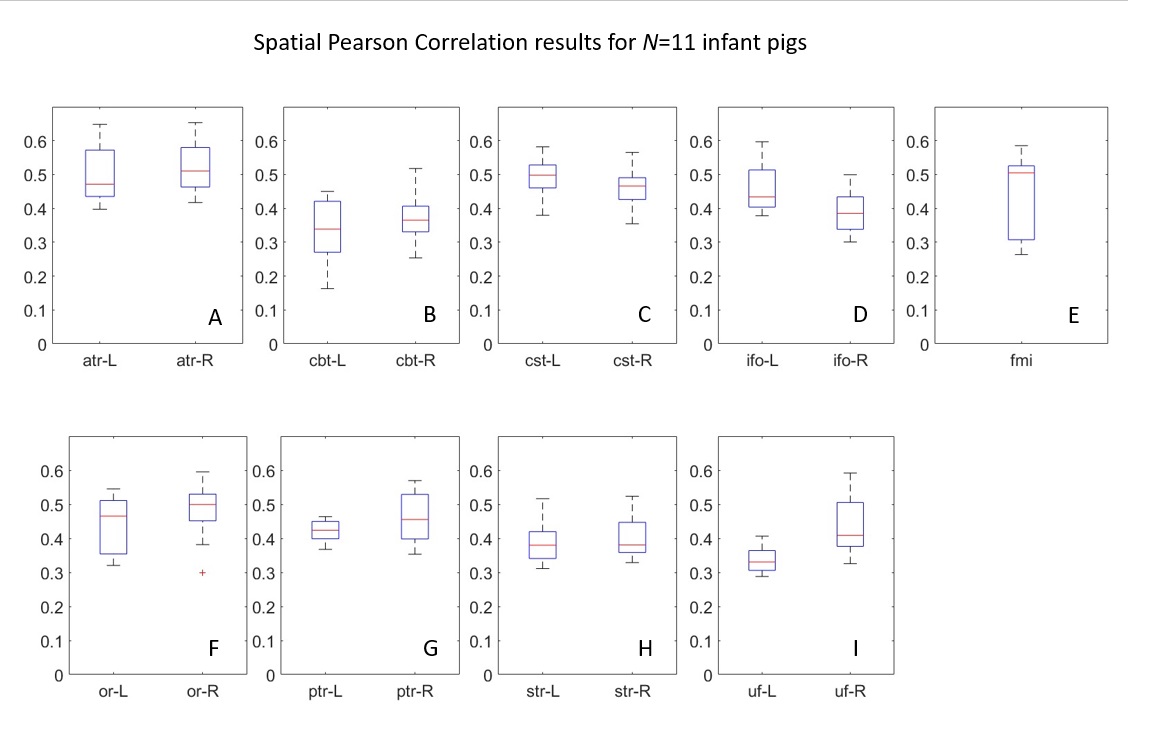
Out of the 27 white matter tracts of an adult pig that show high correlation with those of a human brain4, 17 tracts were identified in the infant pig brain that are highly correlated with adult pigs. Figure 2 shows the correlation boxplot of pairing symmetric tracts across left and right hemispheres in each subplot (except that fmi, Fig 2.E, is self-symmetric across the two hemispheres) for all 11 subjects. The 17 tracts all have a median over 0.3, among which the atr_L and atr_R (A) are the highest correlation pair.Discussion and conclusion
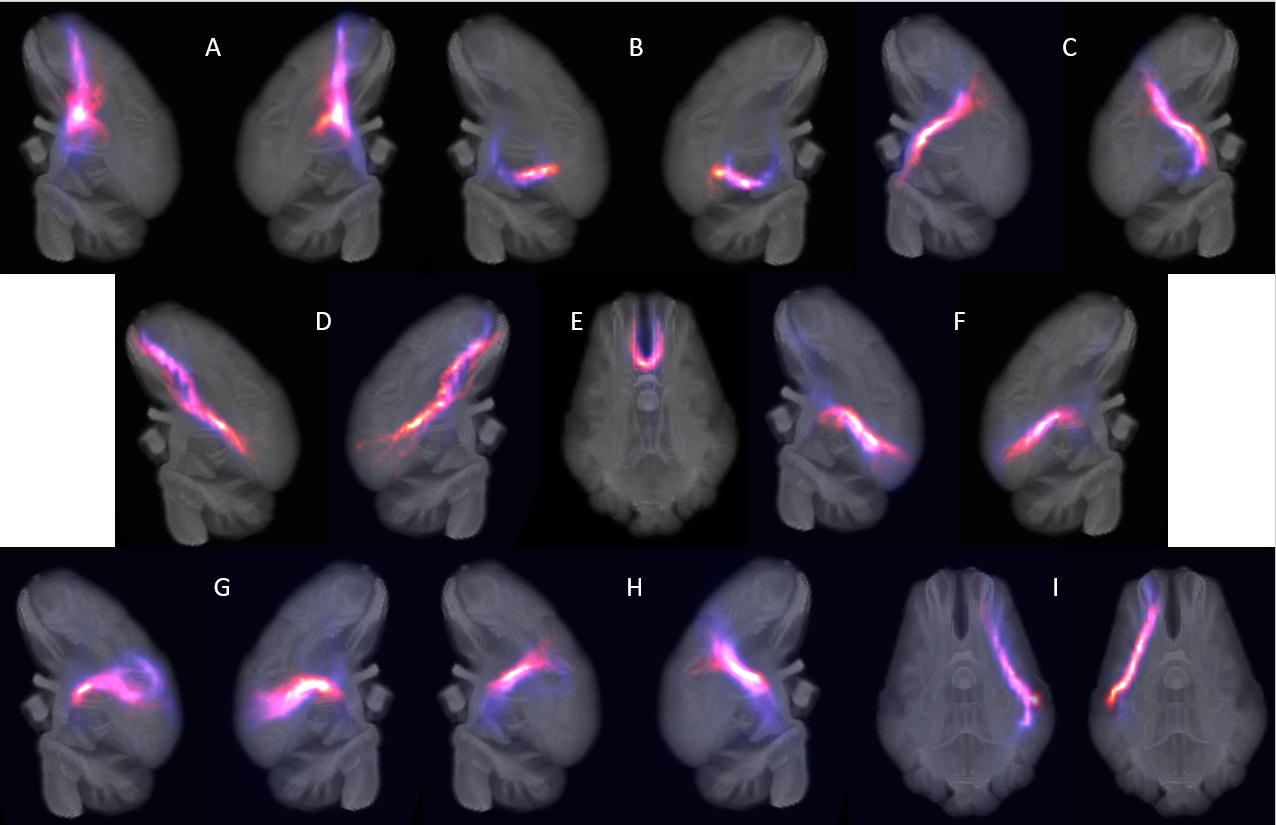
The spatial correlation results show the affinity of white matter tract between the infant pig and the adult pig. 17 out of 27 WM atlas tracts were found highly correlative between the infant and adult pigs. Among the 17 tracts, 14 (or 7 pairs) tracts are showing symmetry across the left and right hemispheres. Structurally, all tracts related to the thalamus are found, i.e., tract atr (Fig.3A), cst (Fig.3C), or (Fig.3F), ptr (Fig.3G), and str (Fig.3H), possibly indicating an early thalamus development in the infant pig brains. Additionally, 4 out of 6 visual cortex related tracts were found (i.e., ifo (Fig.3D), fmi (Fig.3E), or (Fig.3F), and ptr (Fig.3G)). All 3 tracts of the Somatosensory and Motor cortex were found (i.e., atr (Fig.3A), cst (Fig.3C), str (Fig.3H)). These results show structural tract differences between the infant and adult pigs, indicating possible early (but later slowed down) development of the thalamus, sensorimotor system, and possibly inadequate early visual development. Despite exciting structural tract affinity between infant and adult pig brains, this study has some limitations that may be improved in the future. For example, an ICA component number of 50 is tested and refined, but it may not be the best choice as we found several WM tracts share the same best component, indicating possible combined tracts in these components. Furthermore, the subject number (N=11) is still relatively small. A larger group can elevate the statistical power. In the future, a direct comparison to infant human brain tracts, instead of adult pig models, might reveal more developmental trends. In summary, the data-driven analysis clearly shows affinity of structural tracts between the infant and adult pig brains. This study may shed light on the neurodevelopment studies on the piglet model, and its sharing of common connectivity space to facilitate piglet-pediatric human cortical alignment. It also provides possibility for structural-guided functional analysis using an infant/adult pig model.Acknowledgements
No acknowledgement found.References
1. Lind, N. M., et al. (2007). "The use of pigs in neuroscience: modeling brain disorders." Neuroscience & Biobehavioral Reviews 31(5): 728-751.
2. Sauleau, P., et al. (2009). "The pig model in brain imaging and neurosurgery." animal 3(8): 1138-1151.
3. Kinder, H. A., et al. (2019). "The pig as a preclinical traumatic brain injury model: current models, functional outcome measures, and translational detection strategies." Neural regeneration research 14(3): 413.
4. Benn, R. A., et al. (2022). "Opening the Pig to Comparative Neuroimaging: A Common Space Approach Contextualizes the Pig and Human Structural Connectome." bioRxiv: 2020.2010.2013.337436.
5. Smith, S. M. (2002). "Fast robust automated brain extraction." Human brain mapping 17(3): 143-155.
6. Andersson, J. L. and S. N. Sotiropoulos (2016). "An integrated approach to correction for off-resonance effects and subject movement in diffusion MR imaging." Neuroimage 125: 1063-1078.
7. Behrens, T. E., et al. (2003). "Characterization and propagation of uncertainty in diffusion‐weighted MR imaging." Magnetic Resonance in Medicine: An Official Journal of the International Society for Magnetic Resonance in Medicine 50(5): 1077-1088.
8. Saikali, S., et al. (2010). "A three-dimensional digital segmented and deformable brain atlas of the domestic pig." Journal of neuroscience methods 192(1): 102-109.
Figures