0449
A deep learning pipeline using priori knowledge for automatic evaluation of placenta accreta spectrum disorders with MRI1Shanghai key lab of magnetic resonance, East China Normal University, Shanghai, China, 2Department of Radiology, Obstetrics and Gynecology Hospital of Fudan University, Shanghai, China, 3Department of Obstetrics, Obstetrics and Gynecology Hospital of Fudan University, Shanghai, China, 4Department of Radiology, Shanghai First Maternity and Infant Health Hospital, Shanghai, China, 5MR Scientific Marketing, Siemens Healthcare, Shanghai, China
Synopsis
Keywords: Placenta, Placenta
Placenta accreta spectrum (PAS) is a pathologic condition of placentation associated with significant maternal morbidity and mortality. We enrolled 540 patients from two institutions to build an automatic pipeline for early diagnosis of PAS based on T2W images. An nnU-Net model was trained for automatic segmentation of the placenta, then an image stripe was created, in which utero-placental borderline (UPB) was straightened and centered. The UPB image was fed into a DenseNet-based network together with placental position for PAS diagnosis. The pipeline achieved good performance with AUCs of 0.860 and 0.897 in internal and external test cohorts, respectively.Introduction
Placenta accreta spectrum (PAS) is a pathologic condition of placentation in which the villous tissue adheres or invades the uterine wall. The incidence of PAS is rising worldwide, most likely due to the increasing rates of cesarean delivery1,2. PAS is associated with significant maternal morbidity and mortality, in particular, major obstetric hemorrhage and peripartum hysterectomy3. Accurate antenatal diagnosis of PAS has been demonstrated to improve maternal outcomes. Role of MRI has in diagnosis of PAS has been well established4. However, the diagnostic performance before invasive surgical procedure is highly dependent on radiologists’ expertise5.Since PAS occurs in the boundary region, we hypothesized that a deep-learning model with proper attention mechanism on this region could achieve high-performance PAS diagnosis. Therefore, we proposed an automatic pipeline including segmentation of the placental region, an utero-placental boundary straightening strategy, and identification of PAS disorders.Methods
A total of 540 pregnant women with clinically suspected PAS disorder were retrospectively enrolled from two institutions between January 2015 and December 2018. Dataset from the first institution, which was obtained from 1.5T MR unit (Magnetom Avanto, Siemens), was split temporally into a training cohort (125 PAS / 284 normal) and an internal test cohort (32 PAS / 71 normal). Dataset from the second institution, obtained from either a 3T (Ingenia 3.0T, Philips) or a 1.5T (Optima MR 360, GE) MR scanner, was used as an external test cohort (13 PAS disorders /15 normal). PAS was confirmed by the surgical or histopathological findings. All visible placental tissue or suspicious sign of PAS disorder was marked on T2W images by a radiologist with 10 years of experience.The flowchart of this study was shown in Figure 1. The proposed pipeline includes 4 components. First, A 3D nnU-Net6 was trained to segment placenta in T2W images. A novel approach, namely utero-placental borderline straightening (UBS), was used to extract the utero-placental boundary region and straightened it into a rectangular UPB image strip (Figure 1b). Because UBS contains no spatial information of placenta location, we trained a DenseNet-based model (DenseNet-PP) to identify the placenta position. Finally, we feed the UPB image strip into another DenseNet called DenseNet-PAS to identify the PAS disorder. The placenta position vector (PPV) produced by DenseNet-PP was directly concatenated to the second last fully connected layers. We used the cross-entropy loss as the loss function and the stochastic gradient descent (SGD) algorithm as the optimizer. During training, ensemble learning with 5-fold cross-validation was used.
Results
The trained nnU-Net model achieved a mean Dice coefficient of 0.890 in the test cohort and was used directly to segment the external test cohort. As shown in Figure 2, the segmentation was in good agreement with the radiologists' label.For PAS diagnosis, the DenseNet-PAS, fed with UPB image strips and PPV, achieved an AUC of 0.860 (95% CI: 0.784-0.925) and 0.897 (95% CI, 0.754-0.994) in the internal and external test cohort, respectively. Comparison of different models was listed in Table 1. The ROC curves, DCA curve and waterfall plot were shown in Figure 3. To better understand the inference process of the model, Gradient-weighted Class Activation Mapping (Grad-CAM) was used to visualize the activation map, overlapped on the T2W images in Figure 4.
Discussion
In this study, we built an automatic pipeline for PAS status identification. By straightening the placental borderline and center it in image strip of a relatively small size, we proposed a novel approach to make the task easier for the DL model when dealing with small datasets which are typical in medical imaging. To our knowledge, this is the first study to propose a fully automated DL pipeline for PAS diagnosis. Previous studies demonstrated the effectiveness of radiomics for PAS diagnosis7,8. However, the requirement of manual segmentation of placenta region made the model vulnerable to the subjectivity. Benefited from larger training data, our accurate automatic segmentation enables the pipeline to be used in real clinical settings. Furthermore, with the help of Grad-CAM, our model provides the suspicious region containing PAS-related textual anomalies, such as placenta increta, textural features of uterine scar and irregular thick black bands within the placenta. This makes it much easier for radiologist to confirm the prediction, or reject it when obvious incorrect regions are highlighted.Our study also has several limitations. The number of the external test samples are limited. More clinically routine sequences could be used. Although Grad-CAM can point out the suspicious regions, it is still difficult to explain the model’s inference with image signs understandable by radiologists, which is one of our ongoing works.
Conclusion
In conclusion, we proposed a fully automated pipeline for PAS diagnosis. With the prior knowledge that PAS happens in the utero-placental border region, the proposed UBS approach makes it easier for classification model to identify PAS-related signs and symptoms. Combining the automatic segmentation, placenta position classification, and UBS, our proposed pipeline achieved good performance with better interpretability, facilitating its potential use in the early diagnosis of PAS.Acknowledgements
This work was supported, in part, by the National Natural Science grant number: 61731009 and the Open Project of Shanghai Key Laboratory of Magnetic Resonance.References
1 Jauniaux, E. et al. FIGO consensus guidelines on placenta accreta spectrum disorders: Epidemiology. Int J Gynaecol Obstet 140. 2018, 265-273.
2 Vogel, J. P. et al. Use of the Robson classification to assess caesarean section trends in 21 countries: a secondary analysis of two WHO multicountry surveys. Lancet Glob Health 3. 2015, E260-E270.
3 Silver, R. M. & Barbour, K. D. Placenta accreta spectrum: accreta, increta, and percreta. Obstet Gynecol Clin North Am 42. 2015, 381-402.
4 Bourgioti, C. et al. Intraplacental Fetal Vessel Diameter May Help Predict for Placental Invasiveness in Pregnant Women at High Risk for Placenta Accreta Spectrum Disorders. Radiology 298. 2021, 403-412.
5 Ghezzi, C. L. A. et al. Diagnostic performance of radiologists with different levels of experience in the interpretation of MRI of the placenta accreta spectrum disorder. Brit J Radiol 94. 2021.
6 Isensee, F., Jaeger, P. F., Kohl, S. A. A., Petersen, J. & Maier-Hein, K. H. nnU-Net: a self-configuring method for deep learning-based biomedical image segmentation. Nat Methods 18. 2021, 203-+.
7 Peng, L. L. et al. MRI-radiomics-clinical-based nomogram for prenatal prediction of the placenta accreta spectrum disorders. European Radiology. 2022.
8 Shao, Q. et al. Deep learning and radiomics analysis for prediction of placenta invasion based on T2WI. Math Biosci Eng 18. 2021, 6198-6215.
Figures
Figure 3 (A) The ROC curves of different methods over the test cohort. (B) DCA for the comparison models. The curve indicates that the net benefit of using the proposed pipeline (UBS + PPV) is better than the other models when the threshold is in the range between 0.2 and 0.8. (C) The waterfall plot for the distribution of prediction probability of the propose model in the test cohort.
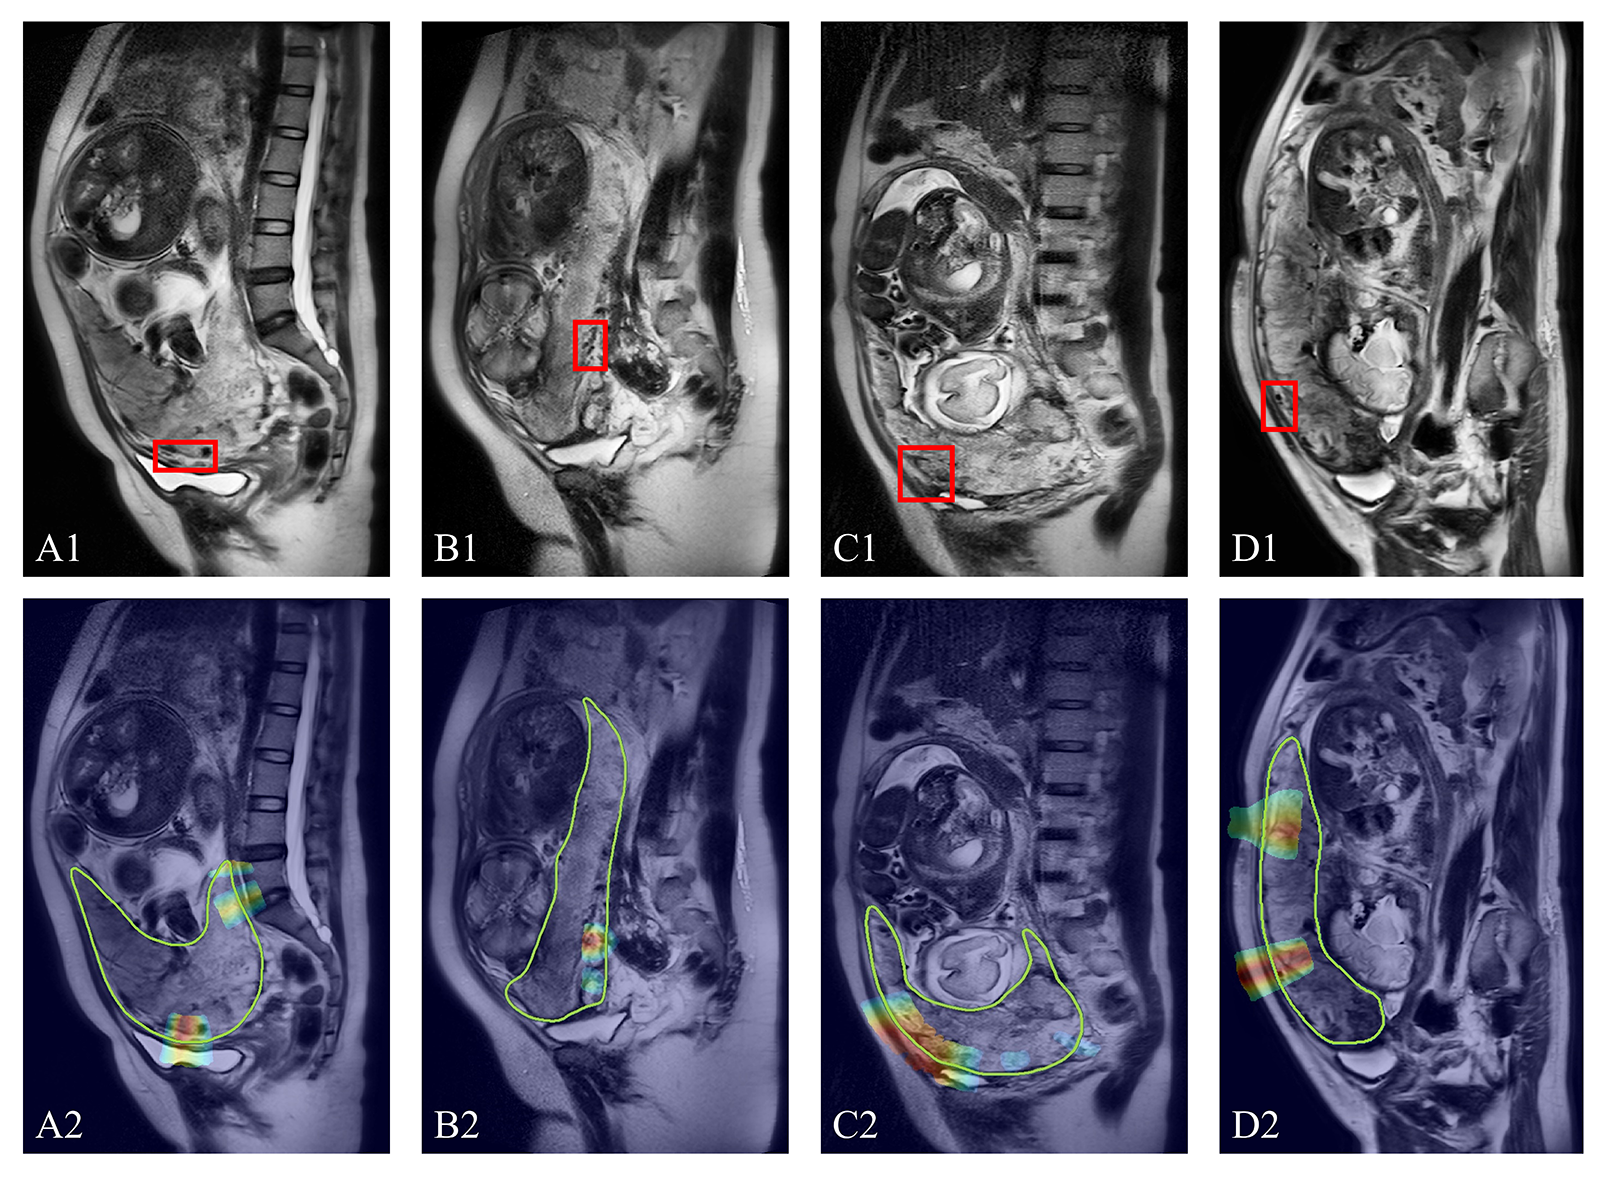
Figure 4. Suspected PAS regions (placenta increta, red box) diagnosed by radiologists compared with Grad-Cam activated regions. The green line (bottom) is the automatically segmented placental area, and the hot regions indicate the regions on which the network’s inferences were based. A and B were from test cohort while C (1.5T) and D (3T) were from external test cohort.