0447
The effects of maternal flow on placental DWI data1The Sir Peter Mansfield Imaging Centre, The University of Nottingham, Nottingham, United Kingdom, 2Mathematical Sciences, The University of Nottingham, Nottingham, United Kingdom, 3Medicine, The University of Nottingham, Nottingham, United Kingdom, 4Life Sciences, The University of Nottingham, Nottingham, United Kingdom
Synopsis
Keywords: Placenta, Diffusion/other diffusion imaging techniques
Placental diffusion imaging data is assumed to be driven by a combination of slow diffusive processes, as well as faster incoherent terms. How these faster incoherent terms combine within a voxel is not obvious, and here we investigate this further by comparing a mathematical simulation of maternal flow through a single placentone to data collected in utero. We observe maternal flows can cause IVIM like effects, with slow exponential decays, but also regions of fast IVIM similar to those observed in the placenta, as well as 'rebounding' of signal.Introduction
Diffusion Weighted Imaging (DWI) has been shown to be a sensitive measure to placental well-being, distinguishing between healthy placentas, and those compromised by preeclampisa (PE) or (FGR). The placental DWI signal is assumed to be driven by a combination of slow diffusive processes, and faster incoherent processes due to a combination of maternal flows, percolation, and fetal flows. It is generally assumed that placental DWI data can be fitted by an IVIM model, but in reality many voxels are found to demonstrate patterns of signal decay that cannot be described by a biexponential diffusive model. In this abstract we aim to compare mathematical simulations of maternal flow through a single placentone, with data collected in utero, to better understand maternal flow in the intervillous space and provide better MRI models to characterise that flow.Theory
In this abstract data were fitted to two models; an IVIM model1$$S(b)=S_0[(1-f_{ivim})e^{-bD}+f_{ivim}e^{-bD^*}](EQ1)$$
and the rebound model2
$$S(b)=S_0[(1-f_{ivim})e^{-bD}+f|cos(cv')|e^{-bD^*}](EQ2)$$
which describe how coherent flows within a voxel can cause refocusing of spins and hence ‘rebounding’ of signal (a flow induced echo in effectively a bipolar gradient field). The amplitude and time delay of the rebound depends on the velocity distribution within a voxel ($$$v’$$$) and the properties of the imaging gradients ($$$c$$$). For a Pulse Gradient Spin Echo (PGSE) $$$c = \gamma\Delta\delta{G}$$$, where $$$\Delta$$$ is the diffusion time, $$$\delta$$$ the lobe length, and $$$G$$$ the maximum gradient strength.
Methods
SimulationsMaternal flow was simulated in a single placentone, considering only the in-plane effects as shown in figure 1. Flow through the inlet and outlets was governed by Stokes flow, and within the placentone we assumed that flow was governed by the Brinkman equation, which describes how incompressible fluids travel through porous media. These were solved using a Discontinuous Finite Element Method to produce a grid of 304x304 evenly spaced velocity vectors, where each vector described the path of a single isochromat which would travel at a constant velocity for the duration of the simulated imaging gradients.
To convert these vectors into MR signals, the placentone was divided into a 16x16 grid of 2.5x2.5mm2 containing 19x19 isochromats as shown in figure 2. A (PGSE) sequence of $$$\Delta$$$=30.9ms, $$$\delta$$$=15.9ms, and varying gradient ($$$G$$$) was simulated for 19 b-values (0-500 s/mm2) and the signal calculated by summing over all N spins within a voxel $$$S(b)=\sum_{n=1}^{N}e^{-i\phi_n}$$$, where the phase change of each spin was given by $$$\phi_{t_n}=\phi_{t_{n-1}}+\textbf{G}(t)\textbf{r}(t)\Delta{t}$$$.
In vivo imaging
Imaging was carried out on a Phillips 3T Ingenia system, using respiratory gated PGSE of the same b-values, $$$\Delta$$$, and $$$\delta$$$ used in the simulated data, and voxel size 2.5x2.5x6mm3. 22 women were scanned, 13 were defined as healthy pregnancy and 9 were compromised by either PE or FGR or both.
Analysis
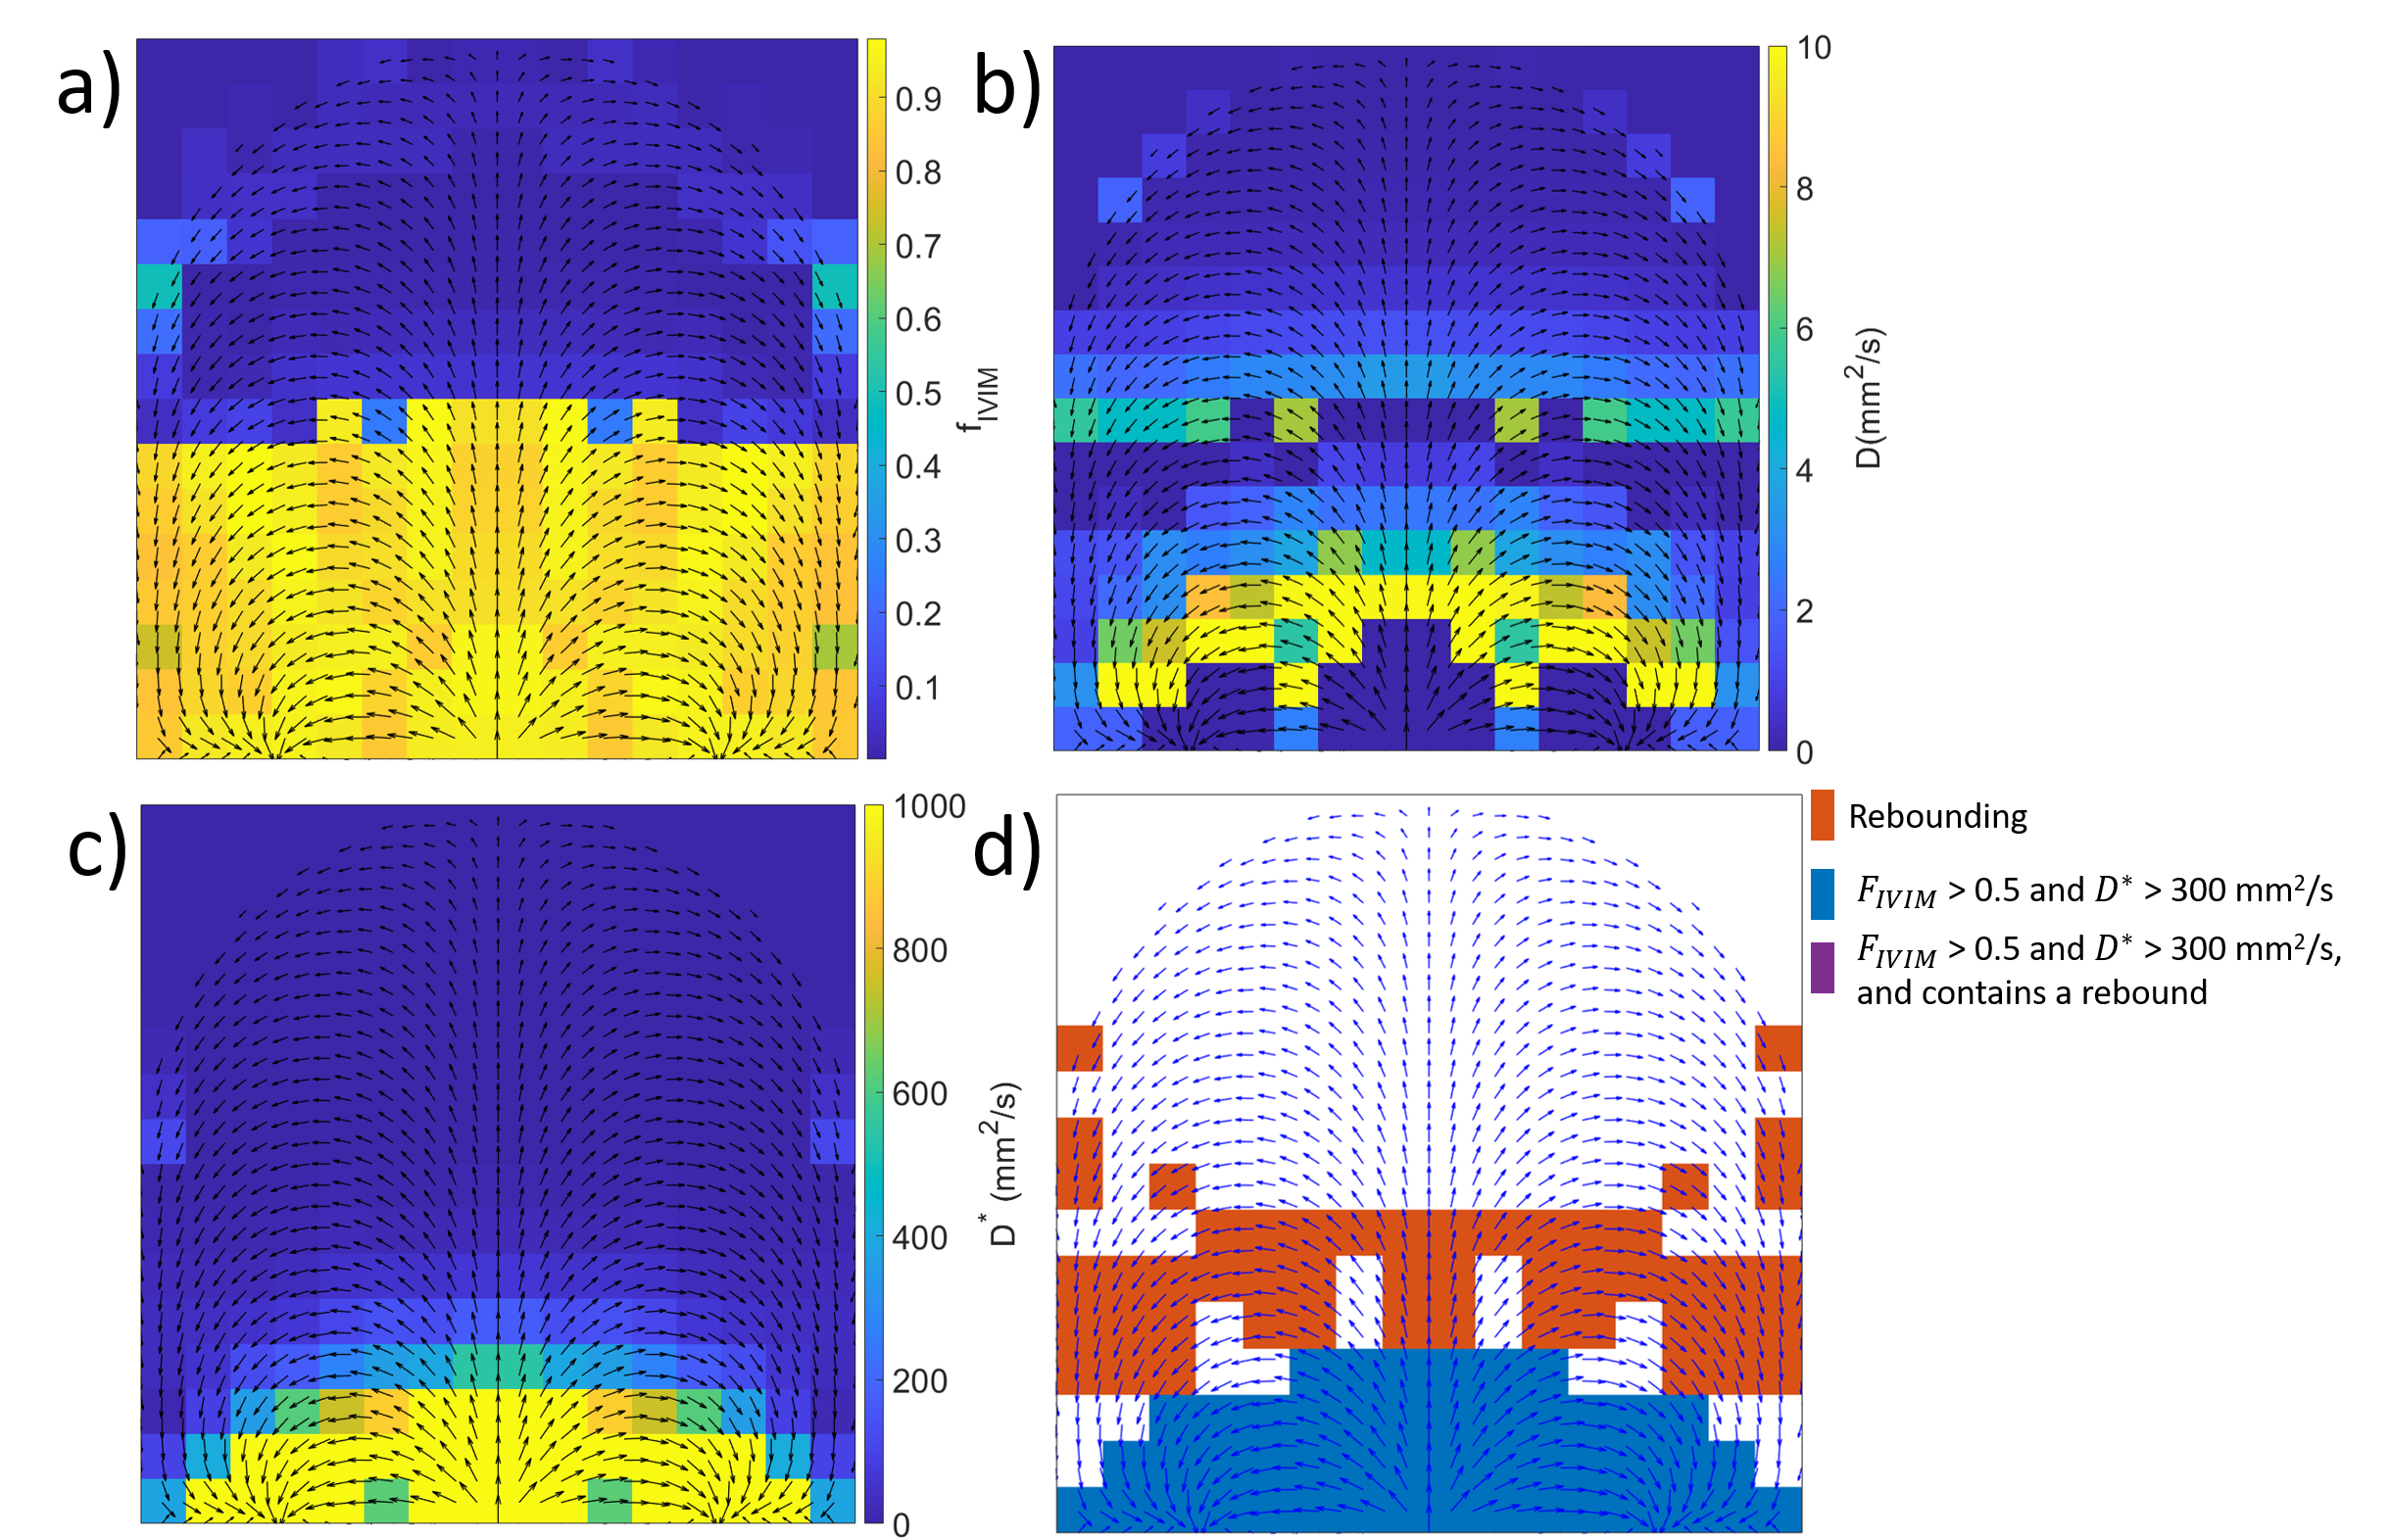
Both the in utero and simulated data were fitted to an IVIM model (EQ1), and the rebounding model (EQ2) in stages: first both the high and low b-value data were fitted to a mono-exponential decay to provide initial estimates before fitting to the full models, with parameters constrained to biologically plausible values. Voxels were then defined into four categories:
1.Rebounding (if the rebound model provided a significantly better fit than the IVIM model, using an F test for P<0.05).
2.Fast IVIM ($$$f_{ivim}>0.5$$$ and $$$D^*>$$$300x10-3mm2/s).
3.Rebounding and fast IVIM.
4.Other generally slow IVIM as in figure 2b.
Results
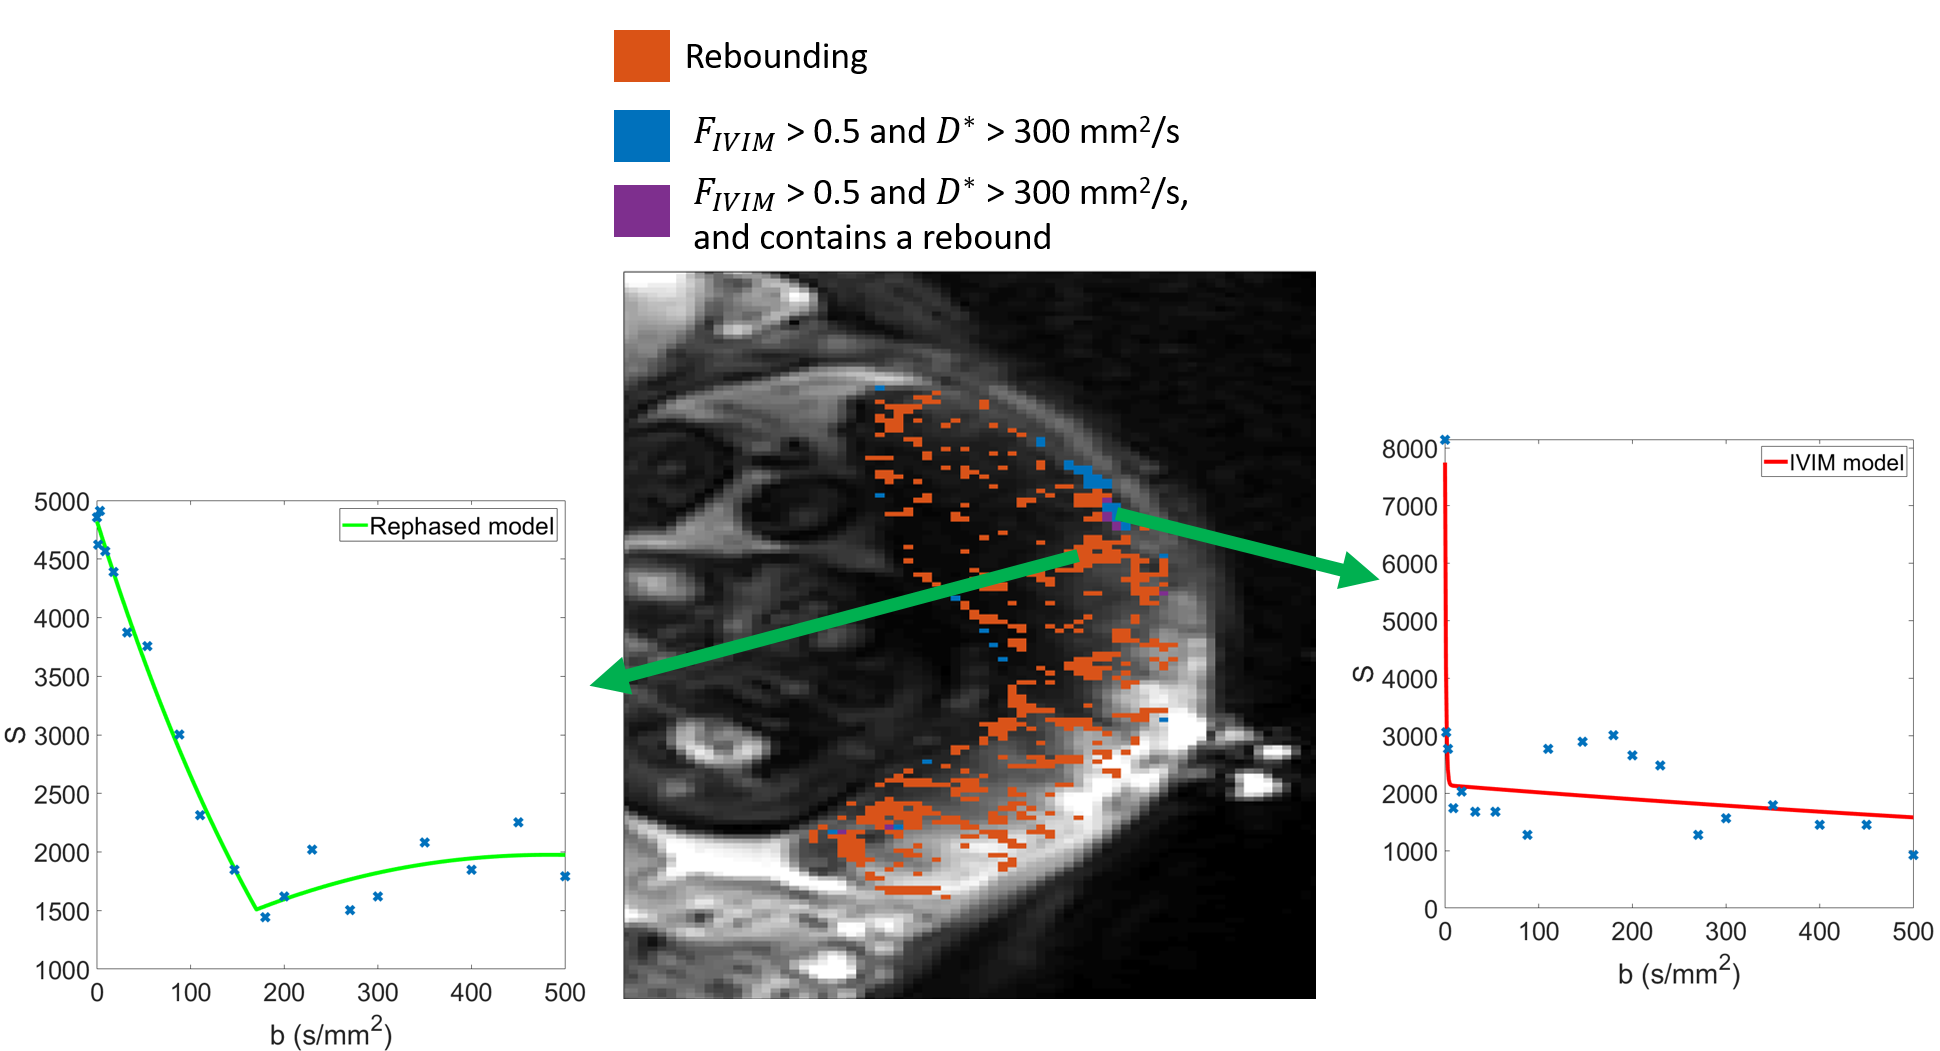
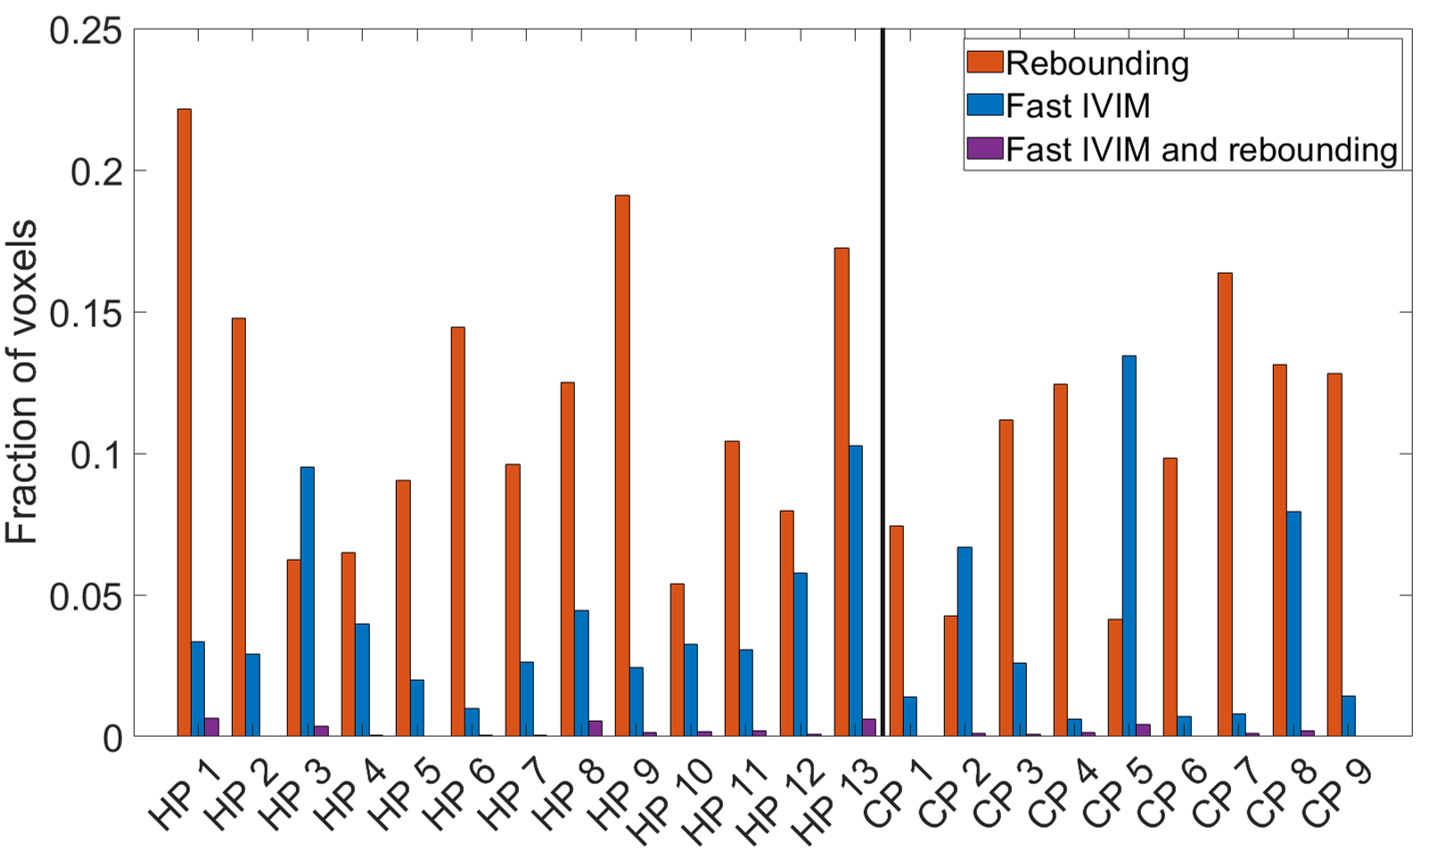
Figure 2 shows example simulated DWI traces for voxels fitting (2b) a slow IVIM model, (2c) the rebound model, and (2d) a fast IVIM model with high $$$f_{ivim}$$$ and $$$D^*$$$. Figure 3 a-c shows parameter maps from fitting the simulated data to the IVIM model, and Figure 3d shows simulated data categorized by whether the data fitted better to a slow IVIM, rebound or fast IVIM model. Figure 4 shows a slice through an MRI scan of a placenta in vivo, with the voxels labelled according to their category, and with two example DWI traces plotted. Figure 5 is a bar chart describing the fraction of the placenta (including the basal plate and uterine wall) for each subject falls in each category.Discussion
These results demonstrate good agreement between simulations and imaging of blood flow through the placenta. Even without diffusion, maternal flow through the placenta can cause IVIM-like effects, (figure 2c,3b) producing diffusion coefficients comparable to those observed in the placenta. The simulations predict regions of high $$$f_{ivim}$$$ and $$$D^*$$$ (figure 3) near the inlets and outlets and similar regions are observed in the placental data (figure 4&5). These high IVIM voxels are typically focused around the periphery of the organ, but are also present in large fractions in the basal plate and uterine wall. Additionally, the simulations predict the presence of rebounds in placental DWI signal (figure 3), depending on the underlying velocity distribution present within a voxel, with rebounding voxels predicted to make up a significant proportion of placental voxels, confirming what we find in vivo (figure5). The b-value at which the rebound occurs, and the amplitude of the rebound will depend on the properties of the imaging gradient $$$c$$$, suggesting this analysis could be optimised to be sensitive to intraplacental flow.Acknowledgements
This work was funded by the National Institute of Health and the EPSRC/MRC Oxford Nottingham Biomedical Imaging CDT, and the Wellcome Leap.References
[1] - Le Bihan D. What can we see with IVIM MRI? Neuroimage. 2019 Feb 15;187:56-67. doi: 10.1016/j.neuroimage.2017.12.062. Epub 2017 Dec 22. PMID: 29277647.
[2] Hutchinson G., Dellschaft N., Jones N., Leach L., Gowland P. Coherent flows detected in placental diffusion weighted imaging data [abstract]. In: proceedings of the 31st ISMRM-ESMRMB & ISMRT Annual meeting, London 2022. Abstract nr 0813.
[3] E. Lecarpentier et al. “Computational Fluid Dynamic Simulations of Maternal Circulation: Wall Shear Stress in the Human Placenta and Its Biological Implications”. In: PLOS ONE 11.1 (2016), pp. 1–18. doi: https://doi.org/10.1371/journal.pone.0147262
Figures
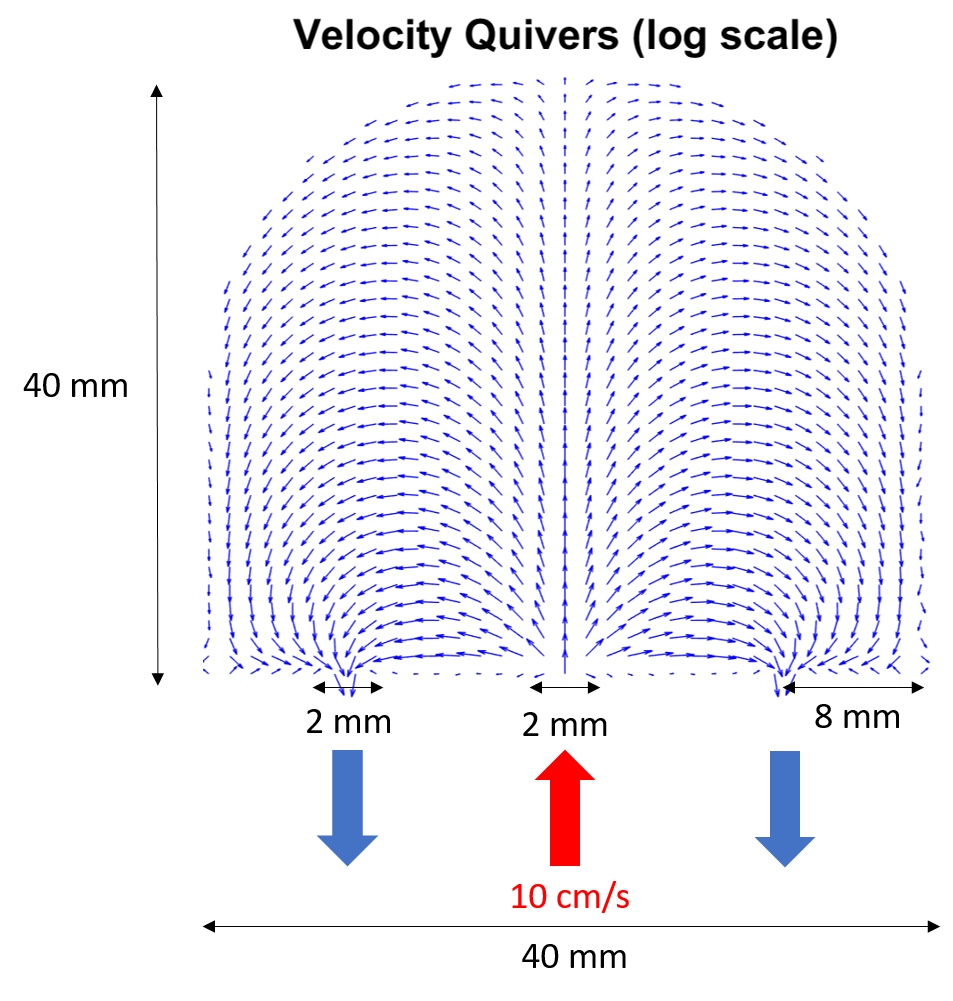
Figure 1:Schematic of the constructed placentone, where there is a central inlet with two outlets on either side. Inlet and outlets were modelled as square pipes of width 2mm, with blood supplied to the placentone at 10cm/s through the inlet, and only allowed to drain from the placentone through the outlets. Velocity vectors were calculated solving the Brinkman equation using a discontinuous finite element method plotted as quivers on a 25x25 grid (less than used to simulate MRI data for visual clarity) where quivers are log scaled.
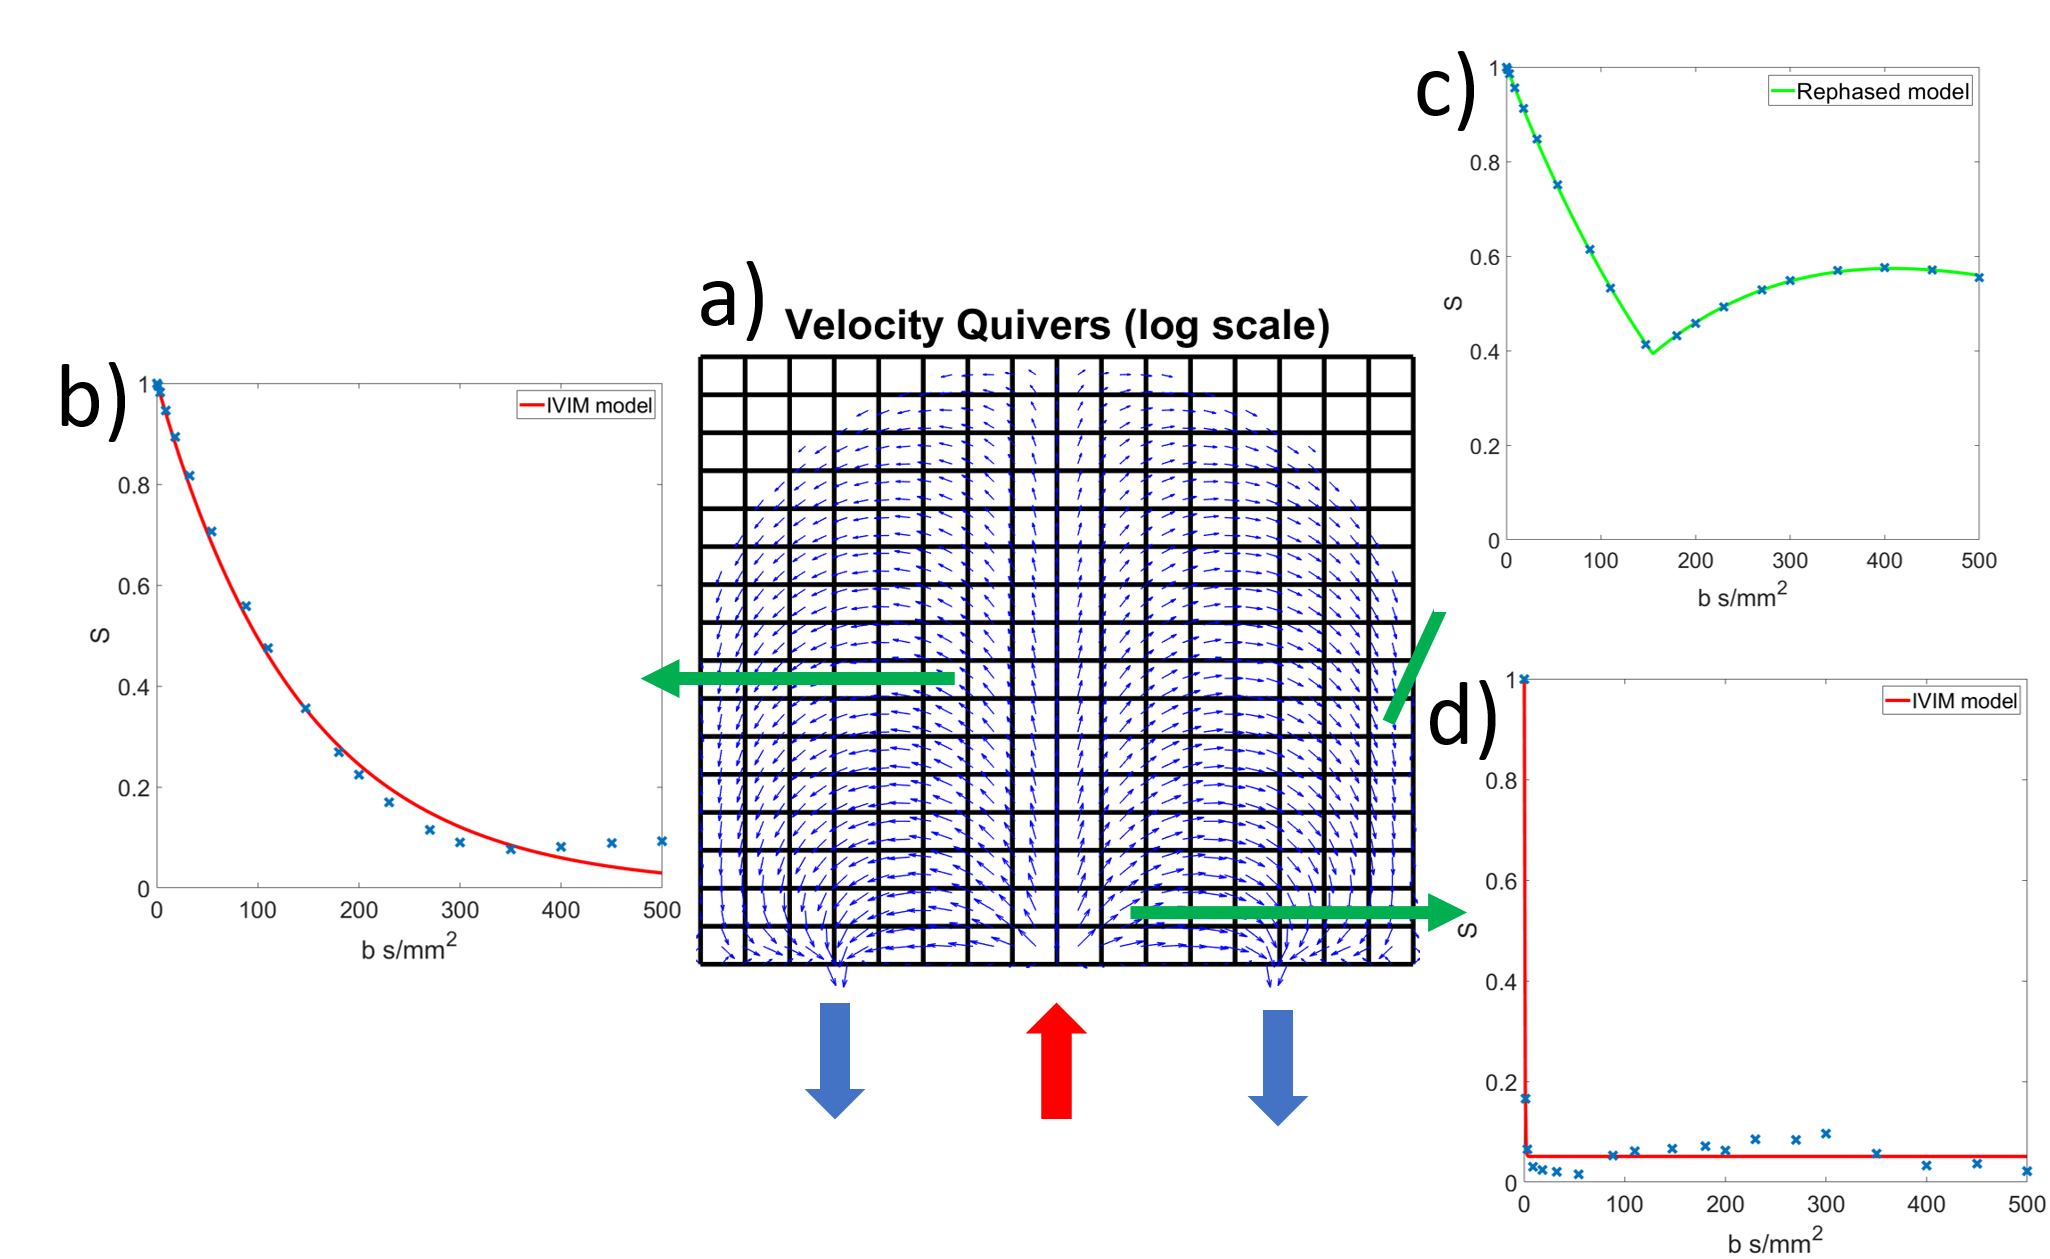
Figure 2:Velocity quivers from figure 1 split into a 16x16 grid of voxels, with the inlet and outlet marked. Example simulated MRI data, normalised to $$$S_0$$$ = 1, also plotted in b) which is fit to an IVIM model, c) which contains a significant rebound, fitted to the rebound model, and d) which shows very fast decay over low b-values, fitted to an IVIM model.