0446
Assessing within-subject rates of change of placental magnetic resonance imaging diffusion metrics1Centre for the Developing Brain, School of Biomedical Engineering and Imaging Sciences, King's College London, London, United Kingdom, 2Biomedical Engineering Department, School of Biomedical Engineering and Imaging Sciences, King's College London, London, United Kingdom, 3Centre for Medical Image Computing, Department of Computer Science, University College London, London, United Kingdom, 4MRC Centre for Neurodevelopmental Disorders, King's College London, London, United Kingdom
Synopsis
Keywords: Placenta, Placenta
This study provides unique data on the evolution of quantitative multi-modal placenta MRl measures over gestation, including, crucially, within-subject results. A multi-compartmental T2*-IVIM model was employed, suited to the complex physiology of the human placenta, and matched to the deployed multi-parametric acquisition technique.Introduction
Given the importance of the placenta as the only connection between mother and developing fetus, as well as its involvement in major pregnancy-related complications, comprehensive antenatal assessments of normal placental development are key to better understand and identify atypical development. Placental MRI is a non-invasive technique allowing such comprehensive analysis, with T2* mapping as a proxy for placental function [1,2], and diffusion imaging techniques to probe the microstructure of the placenta [3] being the most commonly used. Multimodal MRI and matched analysis techniques, exploring the complexity of the underlying biological processes, have recently gained increasing interest [4]. However, the majority of previous studies are cross-sectional, failing to inform on the extent of normal within-subject variability and do not allow investigation of the robustness of such measures.Methods
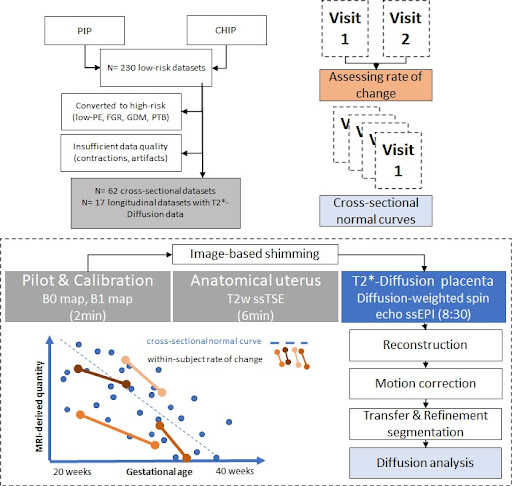
79 low-risk (no pre-eclampsia, hypertension, gestational diabetes or fetal growth-restriction) participants were scanned in the supine position on a Philips Achieva 3T scanner using a 32-channel coil. 17 were scanned twice during pregnancy [Longitudinal cohort - CHIP study], and 62 low-risk individuals were scanned once [Cross-sectional cohort - PIP study] at 3T. Anatomical T2-weighted TSE imaging and a combined multi-echo spin-echo diffusion-weighted ZEBRA sequence [4,5] were acquired (4 TEs [78-186], b=[5,10,25,50,100,200,400,600,1200,1600]smm-2, 8 at b=18smm-2, 7 at b=36smm-2 and 15 at b=800smm-2. After in-house reconstruction, motion correction [6] and manual segmentation of the placental parenchyma, T2*-ADC (Equation 1) and a bi-compartemental T2*-IVIM (Equation 2) modelling was performed using dmipy [7]:Equation 1 - T2*ADC model: S(TE ,b) = S0e-(TE-TEmin)/T*2e-bADC
Equation 2 - T2*IVIM Model: S(TE ,b) = S0 [fe-bD*e-TE/T*perfusing + (1-f)e-bADCeTE/T*diffusing]
where S0 is the signal at the lowest echo time with zero diffusion weighting, f is the perfusion fraction, b is the b‐value, D∗ is the pseudo‐diffusion coefficient, TE is the echo time, T*perfusing is the effective transverse relaxation time associated with the perfusion compartment, ADC is the apparent diffusion coefficient coefficient, and T*diffusing is the effective transverse relaxation time associated with the diffusion compartment.
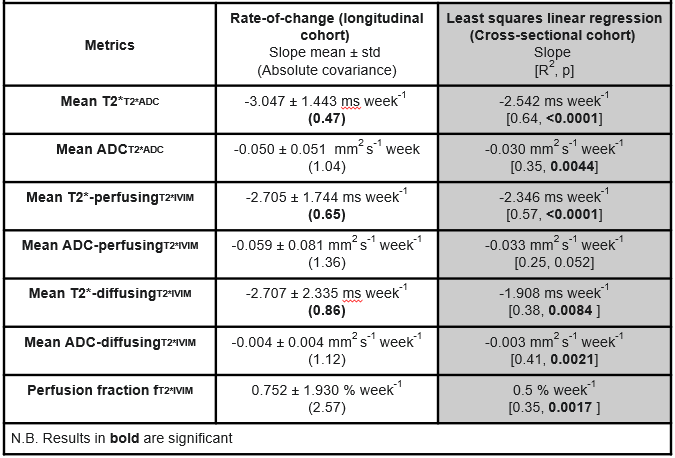
This resulted in whole-placental T2*T2*ADC and ADCT2*ADC measurements for the T2*-ADC model. The T2*-IVIM model (with ADC of the fast compartment restricted to be >0.3 mm2 s-1) resulted in a measure of whole-placental perfusion fraction, as well as T2*-perfusingT2*IVIM, ADC-perfusingT2*IVIM, T2*-diffusingT2*IVIM and ADC-diffusingT2*IVIM. Finally, linear regression was performed for the cross-sectional cohort and within-subject rates-of-change for the longitudinal cohort. Covariance values were calculated in the latter to describe the overall consistency. An overview is given in Figure 1.
Results
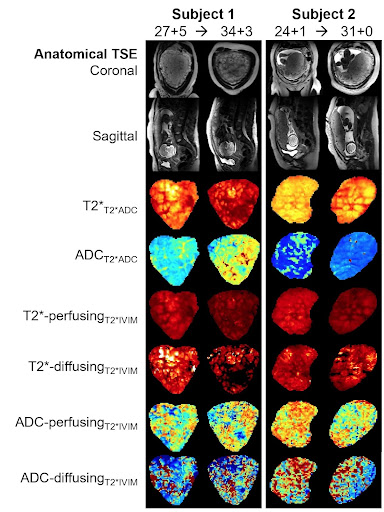
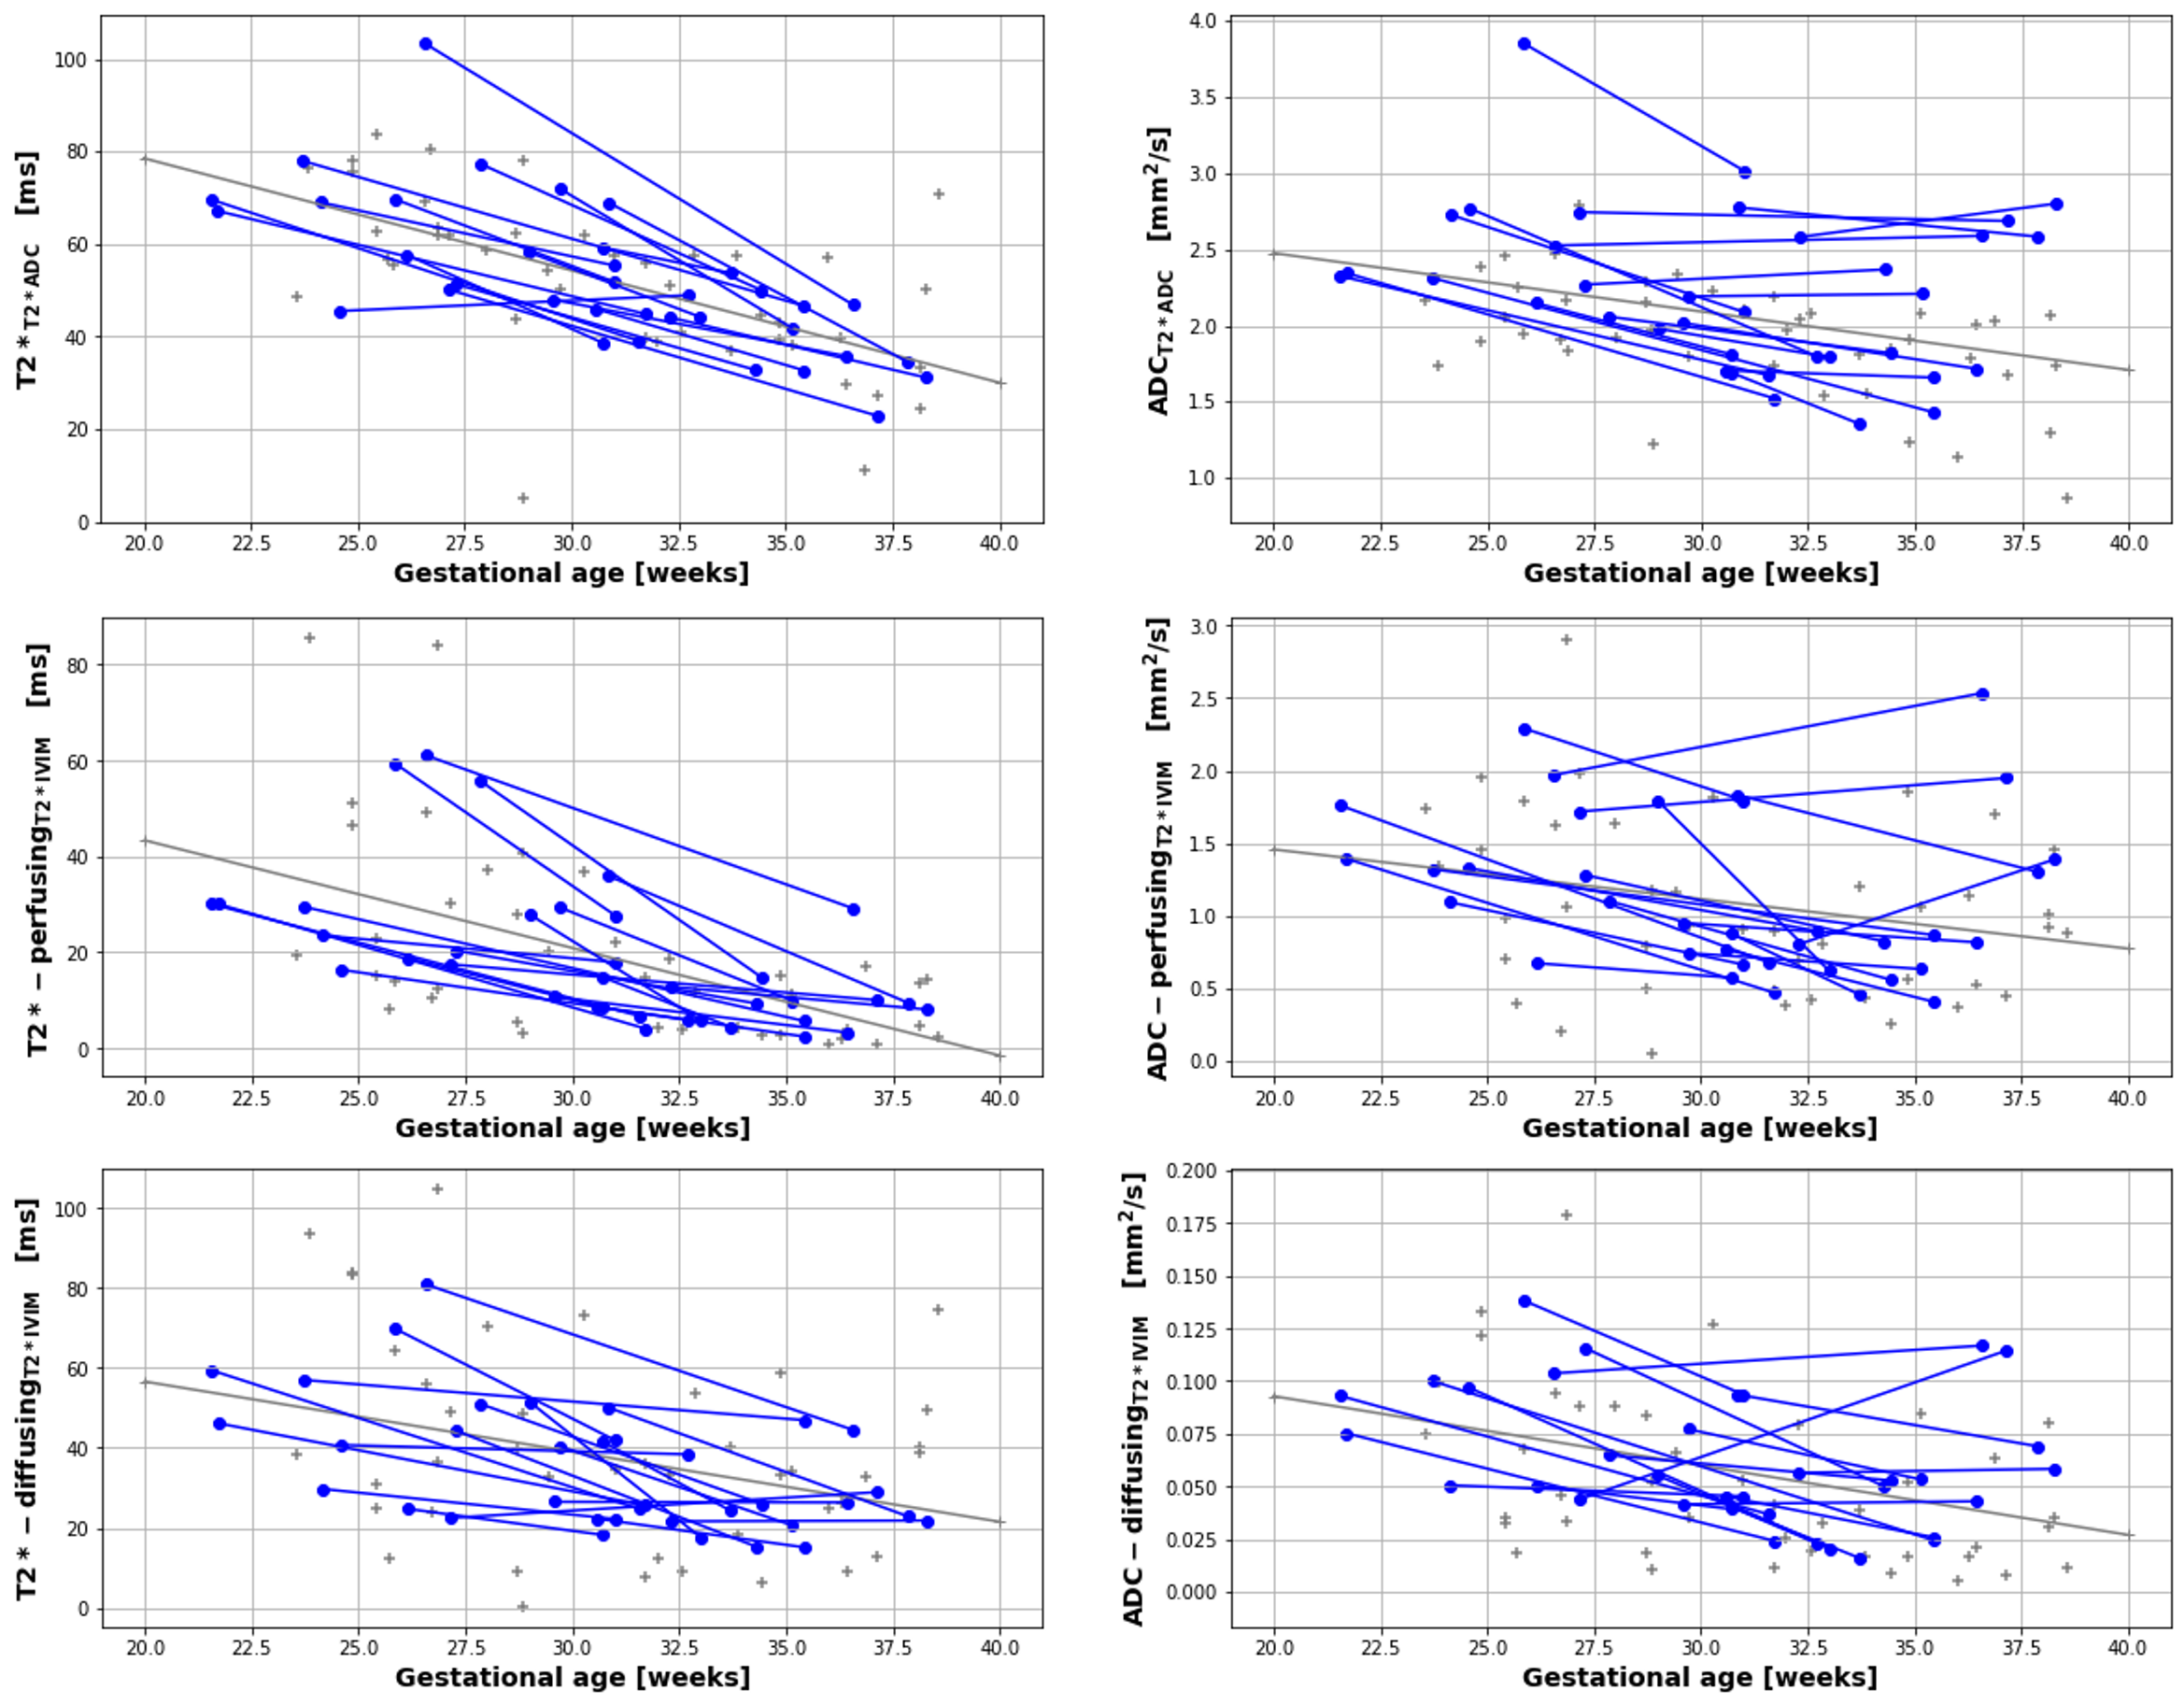
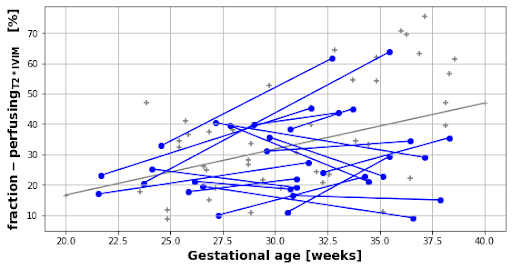
Both cohorts were comparable in gestational age (30.66 weeks vs 30.88 weeks), maternal age (35.75 vs 35.15 years) and maternal BMI (25.7 vs 26.5) at the time of the scan. The average time interval between scans in the longitudinal cohort was 6.87 weeks. Figure 2 demonstrates the acquired data, highlighting, for example, an increase in placental heterogeneity and decline in T2* signal over gestation. There is a significant decline in both whole-placental T2* (p<0.01) and ADC (p<0.01) over gestation in the longitudinal cohort. These declines are consistent within-subjects for whole-placental T2* (Covariance=-0.474), but not ADC (Covariance=-1.036). The T2*IVIM model identified a consistent within-subject decline over gestation in T2* from the perfusing (Covariance=-0.645) and diffusing (Covariance=-0.863) compartments, but not in ADC values from either (Figure 3). The fraction of the placental perfusing compartment increased significantly over gestation in the cross-sectional cohort (R2 = 0.347, p=0.0017), but this increase was not consistent within-subjects (Covariance=2.57) (Figure 4). See Table 1 for all results.Discussion
Whole placental T2* and ADC values decrease over gestation in-line with existing literature [2,3,8,9], although only T2* values show consistent trends within-subjects. There is minimal within-subject variation in rates-of-change of T2* values from perfusing and diffusing compartments, whilst trends in ADC values from these compartments appear to be less consistent over gestation. These findings are likely due to the increased complexity of the bi-compartmental T2*IVIM model and differences in how disparate anatomical regions of the placenta evolve across gestation at a microstructural level. The greater within-subject variation observed from the ADC-perfusingT2*IVIM and ADC-diffusingT2*IVIM compartments may also be related to the increased susceptibility of ADC measurements to maternal motion, and differences in how certain anatomical regions of the placenta evolve throughout gestation, particularly at a microstructural level. Whilst work investigating quantitative longitudinal placental T2* values in a large cohort of normal pregnancies has recently been published [3], ours is the first study that reports similar longitudinal measurements for both placental T2* and ADC rates-of-change within individual subjects, providing a useful benchmark against which to compare how joint placental T2*ADC trajectories may change over gestation in pregnancies affected by placental pathology. Future studies could explore alternative model fitting approaches such as Bayesian or machine learning and focus on collecting serial data from high-risk participants.Acknowledgements
Acknowledgments: We are extremely grateful to all participants who generously gave up their time to undergo placental MRI for this study. We are also grateful to radiographers Emer Hughes, Massimo Marenzana, Katie Colford, Peter Murkin, Louise Dillon, Elaine Green for their assistance with ensuring all imaging was performed successfully; to Tom Arichi, Jennie Almalbmis, Rebe Martinez-Gonzalez, Joanna Robinson, Megan Quirke, Paul Cawley and Alessandra Maggioni for their support in the MRI department; and to Megan Brace, Stefanie Chan, Michelle Jiang and Zoe Hesketh for their assistance with study recruitment and administration.
Funding: This work was supported by grants from the Medical Research Council UK (MR/V002465/1), the Medical Research Council Centre (MR/N026063/1), core funding from the Wellcome/EPSRC Centre for Medical Engineering (WT203148/Z/16/Z), an MRC strategic grant (MR/K006355/1), the NIH Human Placenta Project [1U01HD087202-01], EPSRC grant EP/V034537/1, and by the National Institute for Health Research (NIHR) Biomedical Research Centre based at Guy’s and St Thomas’ NHS Foundation Trust and King’s College London. JH was also supported by a Wellcome Trust Sir Henry Wellcome Fellowship [201374/Z/16/Z] and a UKRI FLF [MR/T018119/1]. The views expressed are those of the authors and not necessarily those of the NHS, the NIHR or the Department of Health.
References
1. Bonel HM, Stolz B, Diedrichsen L et al. Diffusion-weighted MR imaging of the placenta in fetuses with placental insufficiency. Radiology 2010;257:810–9.
2. Sørensen A, Hutter J, Seed M et al. T2*-weighted placental MRI: basic research tool or emerging clinical test for placental dysfunction? Ultrasound Obstet Gynecol 2020;55:293–302.
3. Schabel MC, Roberts VHJ, Gibbins KJ et al. Quantitative longitudinal T2* mapping for assessing placental function and association with adverse pregnancy outcomes across gestation. PloS One 2022;17:e0270360.
4. Slator PJ, Hutter J, Palombo M et al. Combined diffusion-relaxometry MRI to identify dysfunction in the human placenta. Magn Reson Med 2019;82:95–106.
5. Hutter J, Slator PJ, Christiaens D et al. Integrated and efficient diffusion-relaxometry using ZEBRA. Sci Rep 2018;8:15138.
6. Slator PJ, Hutter J, McCabe L et al. Placenta microstructure and microcirculation imaging with diffusion MRI. Magn Reson Med 2018;80:756–66.
7. Garyfallidis E, Brett M, Amirbekian B et al. Dipy, a library for the analysis of diffusion MRI data. Front Neuroinformatics 2014;8:8.
8. Abdel Razek AAK, Thabet M, Salam EA. Apparent Diffusion Coefficient of the Placenta and Fetal Organs in Intrauterine Growth Restriction. J Comput Assist Tomogr 2019;43:507–12.
9. He J, Chen Z, Chen C et al. Comparative study of placental T2* and intravoxel incoherent motion in the prediction of fetal growth restriction. Placenta 2021;111:47–53.
Figures