0444
Microcirculatory changes in the uterus of women during the menstrual cycle - based on intravoxel incoherent motion MRI1Shanghai Institute of Medical Imaging, Shanghai, China, 2Department of Radiology, Huashan Hospital, Shanghai, China, 3MR Application Development, Siemens Shenzhen Magnetic Resonance Ltd., Shenzhen, China, 4MR Collaborations, Siemens Healthineers Digital Technology (Shanghai) Co., Ltd., Shanghai, China, 5MR Application Predevelopment, Siemens Healthcare GmbH, Erlangen, Germany
Synopsis
Keywords: Uterus, Diffusion/other diffusion imaging techniques, Intravoxel incoherent motion, Microcirculation, Perfusion
Purpose: To assess the feasibility of intravoxel incoherent motion MRI on detecting the microcirculatory changes in the uterus of women during the menstrual cycle.
Methods: Volunteers underwent MRI scans by using IVIM. The changes of D value, D* and f value of three layers of uterine structure during menstrual cycle were analyzed quantitatively.
Results: During menstrual cycle, the D values of junctional zone were significantly lower than in myometrium. Meanwhile, the f values of the three zones structure of uterus were significantly different.
Conclusion: IVIM can be used for noninvasive and quantitative evaluation of uterine blood microcirculation changes.
Introduction
The physiology of the uterus changes periodically under the influence of hormones (1,2). Traditional magnetic resonance imaging (MRI) focuses on evaluating the structure of the uterus, while the intravoxel incoherent motion (IVIM) can reflect the blood microcirculation (3–5). The purpose of this study is to assess the feasibility of intravoxel incoherent motion MRI on detecting the microcirculatory changes in the uterus of women during the menstrual cycle.Methods and Materials
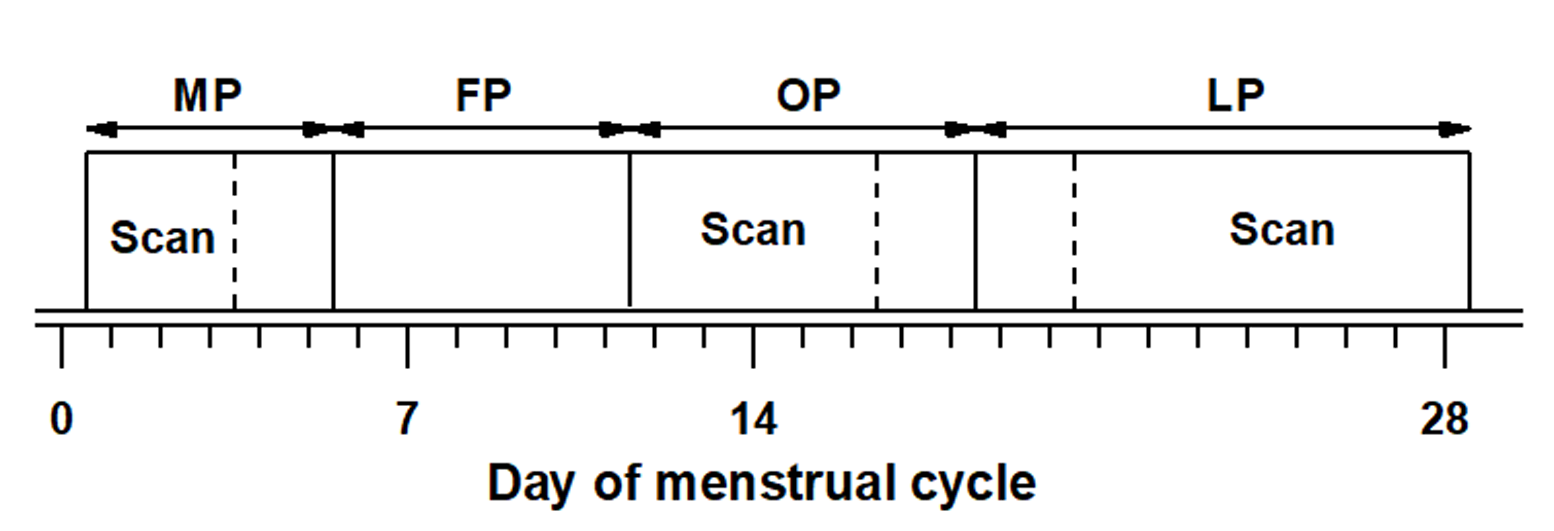
Twenty-one young female volunteers (age range: 23-32 years, mean age: 26.1 years) with regular menstrual cycles (28±7days) were recruited in this study. Volunteers with significant dysmenorrhea, a history of gynecologic disorders, contraceptive use in the past six months, and contraindications to MRI were excluded from the study. Each participant was scanned during menstruation phase (first three days of menstruation), ovulatory phase (two days before and after the expected date of ovulation day), and luteal phase (seven days before the next menstruation) (Fig.1).MRI was performed with a 3T scanner (MAGNETOM Prisma; Siemens Healthcare, Erlangen, Germany) with an 18-channel phase array body coil. IVIM was acquired with a single-shot ZOOMit spin-echo echo-planar imaging (SE-EPI) sequence along the axis of the uterus corpus. Scanning parameters for IVIM MR imaging were as follows: TR= 3200 msec, TE=65mesc, FOV= 200*200mm, Slice thickness= 5.0mm, Slice number= 15, Bandwidth= 1666Hz/Pixel, diffusion directions=3, twelve b values (0, 10, 20, 30, 50, 70, 100, 150, 200, 400, 800, 1000s/mm2).
All IVIM parameters were calculated by using a post-processing research application (Body Diffusion Toolbox, Siemens Healthcare, Erlangen, Germany). Manual-shaped regions of interest (ROIs) were defined respectively within endometrium, junctional zone and myometrium in the regions with a good-fitting curve. The two radiologists blinded to the menstrual cycle of volunteers performed the analysis on the diffusion coefficient (D), pseudo diffusion coefficient (D*), and perfusion fraction (f).
Statistical analysis was performed with IBM Statistical SPSS® v. 22.0(SSPS Inc., Chicago, IL). Difference among three zonal during the menstrual cycle was evaluated using one-way analysis of variance (ANOVA).
Results
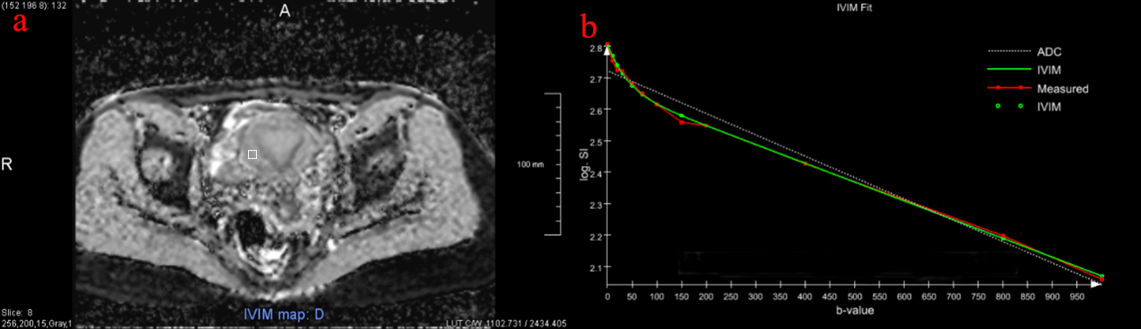
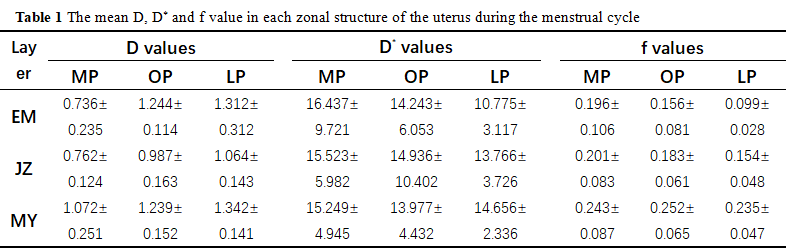
Three volunteers were excluded because of the presence of uterus leiomyomas. Therefore, a total of 18 female participants were recruited in our investigate cohort. Curve fitting results showed that the IVIM model fitted the data well (Fig. 2).The mean D, D* and f values of each uterine zone during menstrual cycle are listed in Table 1. The D values of three zonal structures of uterine in ovulation and luteal phases were significantly higher than that in menstrual phase, and the difference was statistically significant (P<0.05). In comparison to the menstrual phase, the f value of endometrium was much lower during the luteal phase (P=0.004).
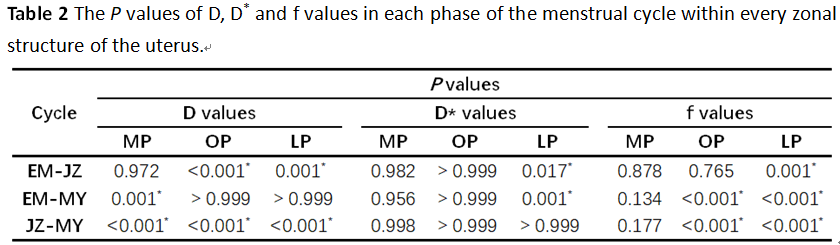
The P values of IVIM-related parameters between different layers of uterus in the same menstrual cycle are showed in Table 2. In each phase of menstrual cycle, the D value of the junctional zone was significantly lower than that of the myometrium, with statistical significance (P<0.001). During ovulation and luteal phase, the D value of the junctional zone was also lower than that of the endometrium (P<0.001) (Fig 3). The f value of myometrium was significantly higher than that of endometrium and junctional zone during ovulation and luteal phase (P<0.013).
Discussion
The mean D value in each zonal structure of uterine in menstrual phase was significantly lower than those in other phases of menstrual cycle, which indicated that the diffusion of water molecules in the uterine during menstruation was limited. Periodic contractions of the spiral artery walls during the menstrual phase result in disruption of the epithelium and blood vessel rupture, which cause restricted diffusion by three layers of the uterus (6,7). D values within junctional zone were significantly lower than those within the myometrium during every menstrual phase. It is possible that the junctional zone is a structure consisting of compact smooth muscle bundles, which can reduce the water molecule content, the extracellular space, the cytoplasmic nucleus ratio, and the arrangement of myocytes (8).D* is the diffusion coefficient associated with capillary perfusion, which depends on the average blood flow velocity of the capillary (4,9). However, there was no significant difference in D* values in the structure of each layer of uterus during the menstrual cycle. Signal attenuation measured by DWI with low b value mainly reflects perfusion effect (10,11). However, lower b values may result in sensitivity to noise, which will lead to the reduction of SNR of the D* maps (12,13).
In the present study, f values of myometrium were significantly higher than junctional zone and endometrium during ovulatory phase and luteal phase. Meanwhile, f values of junctional zone were also higher than endometrium during luteal phase. We assume that because the circumferential arcuate arteries are developed when the bilateral uterine arteries enter the myometrium, these arteries sequentially branch to form the radial arteries and perforate the endometrium as small-caliber conductance vessels (14).
IVIM, a non-invasive quantitative imaging method, can be used to obtain the changes in the blood microcirculation in each layer of the uterus during the menstrual cycle. The study of the parameters related to normal uterine IVIM is helpful to analyze the indicators under abnormal conditions.
Acknowledgements
We would like to thank all the volunteers for their contributions to this study.
References
1. Demas B, Hricak H, Jaffe R. Uterine MR Imaging - Effects of Hormonal-Stimulation. Radiology. Easton: Radiological Soc North Amer; 1986;159(1):123–126. doi: 10.1148/radiology.159.1.3952297.
2. Xiao S, Coppeta JR, Rogers HB, et al. A microfluidic culture model of the human reproductive tract and 28-day menstrual cycle. Nat Commun. Nature Publishing Group; 2017;8(1):14584. doi: 10.1038/ncomms14584.
3. Lebihan D, Breton E, Lallemand D, Aubin M, Vignaud J, Lavaljeantet M. Separation of Diffusion and Perfusion in Intravoxel Incoherent Motion MR Imaging. Radiology. Easton: Radiological Soc North Amer; 1988;168(2):497–505. doi: 10.1148/radiology.168.2.3393671.
4. Le Bihan D. What can we see with IVIM MRI? NeuroImage. 2019; 187:56–67. doi: 10.1016/j.neuroimage.2017.12.062.
5. Federau C. Intravoxel incoherent motion MRI as a means to measure in vivo perfusion: A review of the evidence. NMR Biomed. 2017;30(11): e3780. doi: 10.1002/nbm.3780.
6. Tsili AC, Argyropoulou MI, Tzarouchi L, et al. Apparent diffusion coefficient values of the normal uterus: Interindividual variations during menstrual cycle. Eur J Radiol. Clare: Elsevier Ireland Ltd; 2012;81(8):1951–1956. doi: 10.1016/j.ejrad.2011.04.057.
7. He Y, Ding N, Li Y, et al. 3-T diffusion tensor imaging (DTI) of normal uterus in young and middle-aged females during the menstrual cycle: evaluation of the cyclic changes of fractional anisotropy (FA) and apparent diffusion coefficient (ADC) values. Br J Radiol. London: British Inst Radiology; 2015;88(1049):20150043. doi: 10.1259/bjr.20150043.
8. Scoutt L, Flynn S, Luthringer D, Mccauley T, Mccarthy S. Junctional Zone of the Uterus - Correlation of Mr Imaging and Histologic Examination of Hysterectomy Specimens. Radiology. Easton: Radiological Soc North Amer; 1991;179(2):403–407. doi: 10.1148/radiology.179.2.2014282.
9. Lee EYP, Yu X, Chu MMY, et al. Perfusion and diffusion characteristics of cervical cancer based on intraxovel incoherent motion MR imaging-a pilot study. Eur Radiol. 2014;24(7):1506–1513. doi: 10.1007/s00330-014-3160-7.
10. Iima M, Le Bihan D. Clinical Intravoxel Incoherent Motion and Diffusion MR Imaging: Past, Present, and Future. Radiology. Radiological Society of North America; 2016;278(1):13–32. doi: 10.1148/radiol.2015150244.
11. Xiao B-H, Wáng YXJ. Different tissue types display different signal intensities on b = 0 images and the implications of this for intravoxel incoherent motion analysis: Examples from liver MRI. NMR Biomed. 2021;34(7): e4522. doi: 10.1002/nbm.4522.
12. Marzi S, Piludu F, Vidiri A. Assessment of diffusion parameters by intravoxel incoherent motion MRI in head and neck squamous cell carcinoma. Nmr Biomed. Hoboken: Wiley; 2013;26(12):1806–1814. doi: 10.1002/nbm.3020.
13. Koh D-M, Collins DJ, Orton MR. Intravoxel Incoherent Motion in Body Diffusion-Weighted MRI: Reality and Challenges. Am J Roentgenol. American Roentgen Ray Society; 2011;196(6):1351–1361. doi: 10.2214/AJR.10.5515.
14. Thomassin-Naggara I, Balvay D, Cuenod CA, Daraï E, Marsault C, Bazot M. Dynamic contrast-enhanced MR imaging to assess physiologic variations of myometrial perfusion. Eur Radiol. 2010;20(4):984–994. doi: 10.1007/s00330-009-1621-1.
Figures