0443
Can 3D APTw Imaging improve the differential diagnosis ability of traditional MRI in Ovarian Cystadenoma and Cystadenocarcinoma?1Radiology department, Beijing Tsinghua Changgung Hospital, School of Clinical Medicine, Tsinghua University, Beijing, China, 2Center for Biomedical Imaging Research, School of Medicine, Tsinghua University, Beijing, China, 3Clinical& Technical Support, Philips Healthcare, Beijing, China
Synopsis
Keywords: Pelvis, CEST & MT
The therapies for ovarian cystadenoma and cystadenocarcinoma are different, thus the differential diagnosis of ovarian lesions is critical. The diagnostic efficacy increased with the use of DWI and DCE-MRI, but the differential diagnosis of cystic ovarian lesions is still a challenge. This study evaluates the diagnostic efficacy of 3D APTw MRI in the differentiation between cystadenoma and cystadenocarcinoma based on the analysis of the cystic regions. The results showed that APTw SIs had better diagnostic performance than ADC values and may be used as a noninvasive tool for differential diagnosis and therapy guidance.
Introduction
The therapies for ovarian cystadenoma and cystadenocarcinoma are different, thus the differential diagnosis of ovarian lesions is critical.1 Magnetic resonance imaging (MRI) has been widely used in differentiating between cystadenoma and cystadenocarcinoma, mainly based on the analysis of solid components of the tumors. The diagnostic efficacy increased with the use of diffusion-weighted imaging (DWI) and dynamic contrast-enhanced (DCE) MRI, but the differential diagnosis of cystic ovarian lesions is still challenging.2 Amide Proton Transfer weighted (APTw) MRI is a noninvasive molecular imaging technique that gives contrast at the cellular protein level. The measured APT effect comes from the contributions of mobile proteins and peptides3 and can be used in the quantitative analysis of both solid and cystic components of tumors4-6. Therefore, the purpose of the present study is to evaluate the diagnostic efficacy of 3D APTw MRI in the differentiation between cystadenoma and cystadenocarcinoma based on the analysis of the cystic regions.Material and Methods
This is a prospective study including 20 patients with histopathological-confirmed ovarian epithelial tumors (cystadenoma: n=11; cystadenocarcinoma: n=9). MRI scanning was performed at a 3.0 T system (Ingenia 3.0 CX; Philips Healthcare, Best, The Netherlands) using a 16-channel Torso coil, including T2WI, T1WI, DWI, and APTw MRI sequences. The APT imaging parameters were as follows: mDIXON 3D-APT for fast spin echo method; TSE factor, 244; repetition time, 6413 milliseconds; echo time, 8.3 milliseconds; matrix, 96 × 96; field of view, 240× 240 mm2; thickness, 5 mm; and scan time, 1 minute 4 seconds. Apparent diffusion coefficient (ADC) values were obtained using conventional DWI with the same slice sickness (b = 0, 1000 s/mm2). The APT effect was described using the MTR asymmetry at an offset of 3.5 ppm, and the MTRasym (3.5ppm) was presented as APTw SI = MTRasym (3.5 ppm) (%). APTw images and ADC maps were co-registered and fused with T2WI images using a rigid registration method on the Philips workstation (IntelliSpace Portal, version 9, Philips Healthcare, Best, the Netherlands), which helped in providing precise anatomical information. APTw SIs and ADC values within the cystic regions of tumors were measured by two radiologists blinded to the clinical and pathological data. The ROIs were drawn within the cystic part of the lesion with 1-2 mm to its edge (Figure 1). APTw SIs and ADC values were compared between the two groups using the independent samples t-test. Receiver operating characteristic (ROC) curve was used to evaluate the diagnostic performance of APTw SIs and ADC values for differentiation between cystadenoma and cystadenocarcinoma. The cut-off value, sensitivity, specificity, and area under the curve (AUC) were calculated. All statistical analyses were performed with Prism 5.0 software (GraphPad Software, La Jolla, CA) and MedCalc version 15.6.1 for Windows (MedCalc Software, Mariakerke, Belgium), and p-values < 0.05 were considered significant.Results
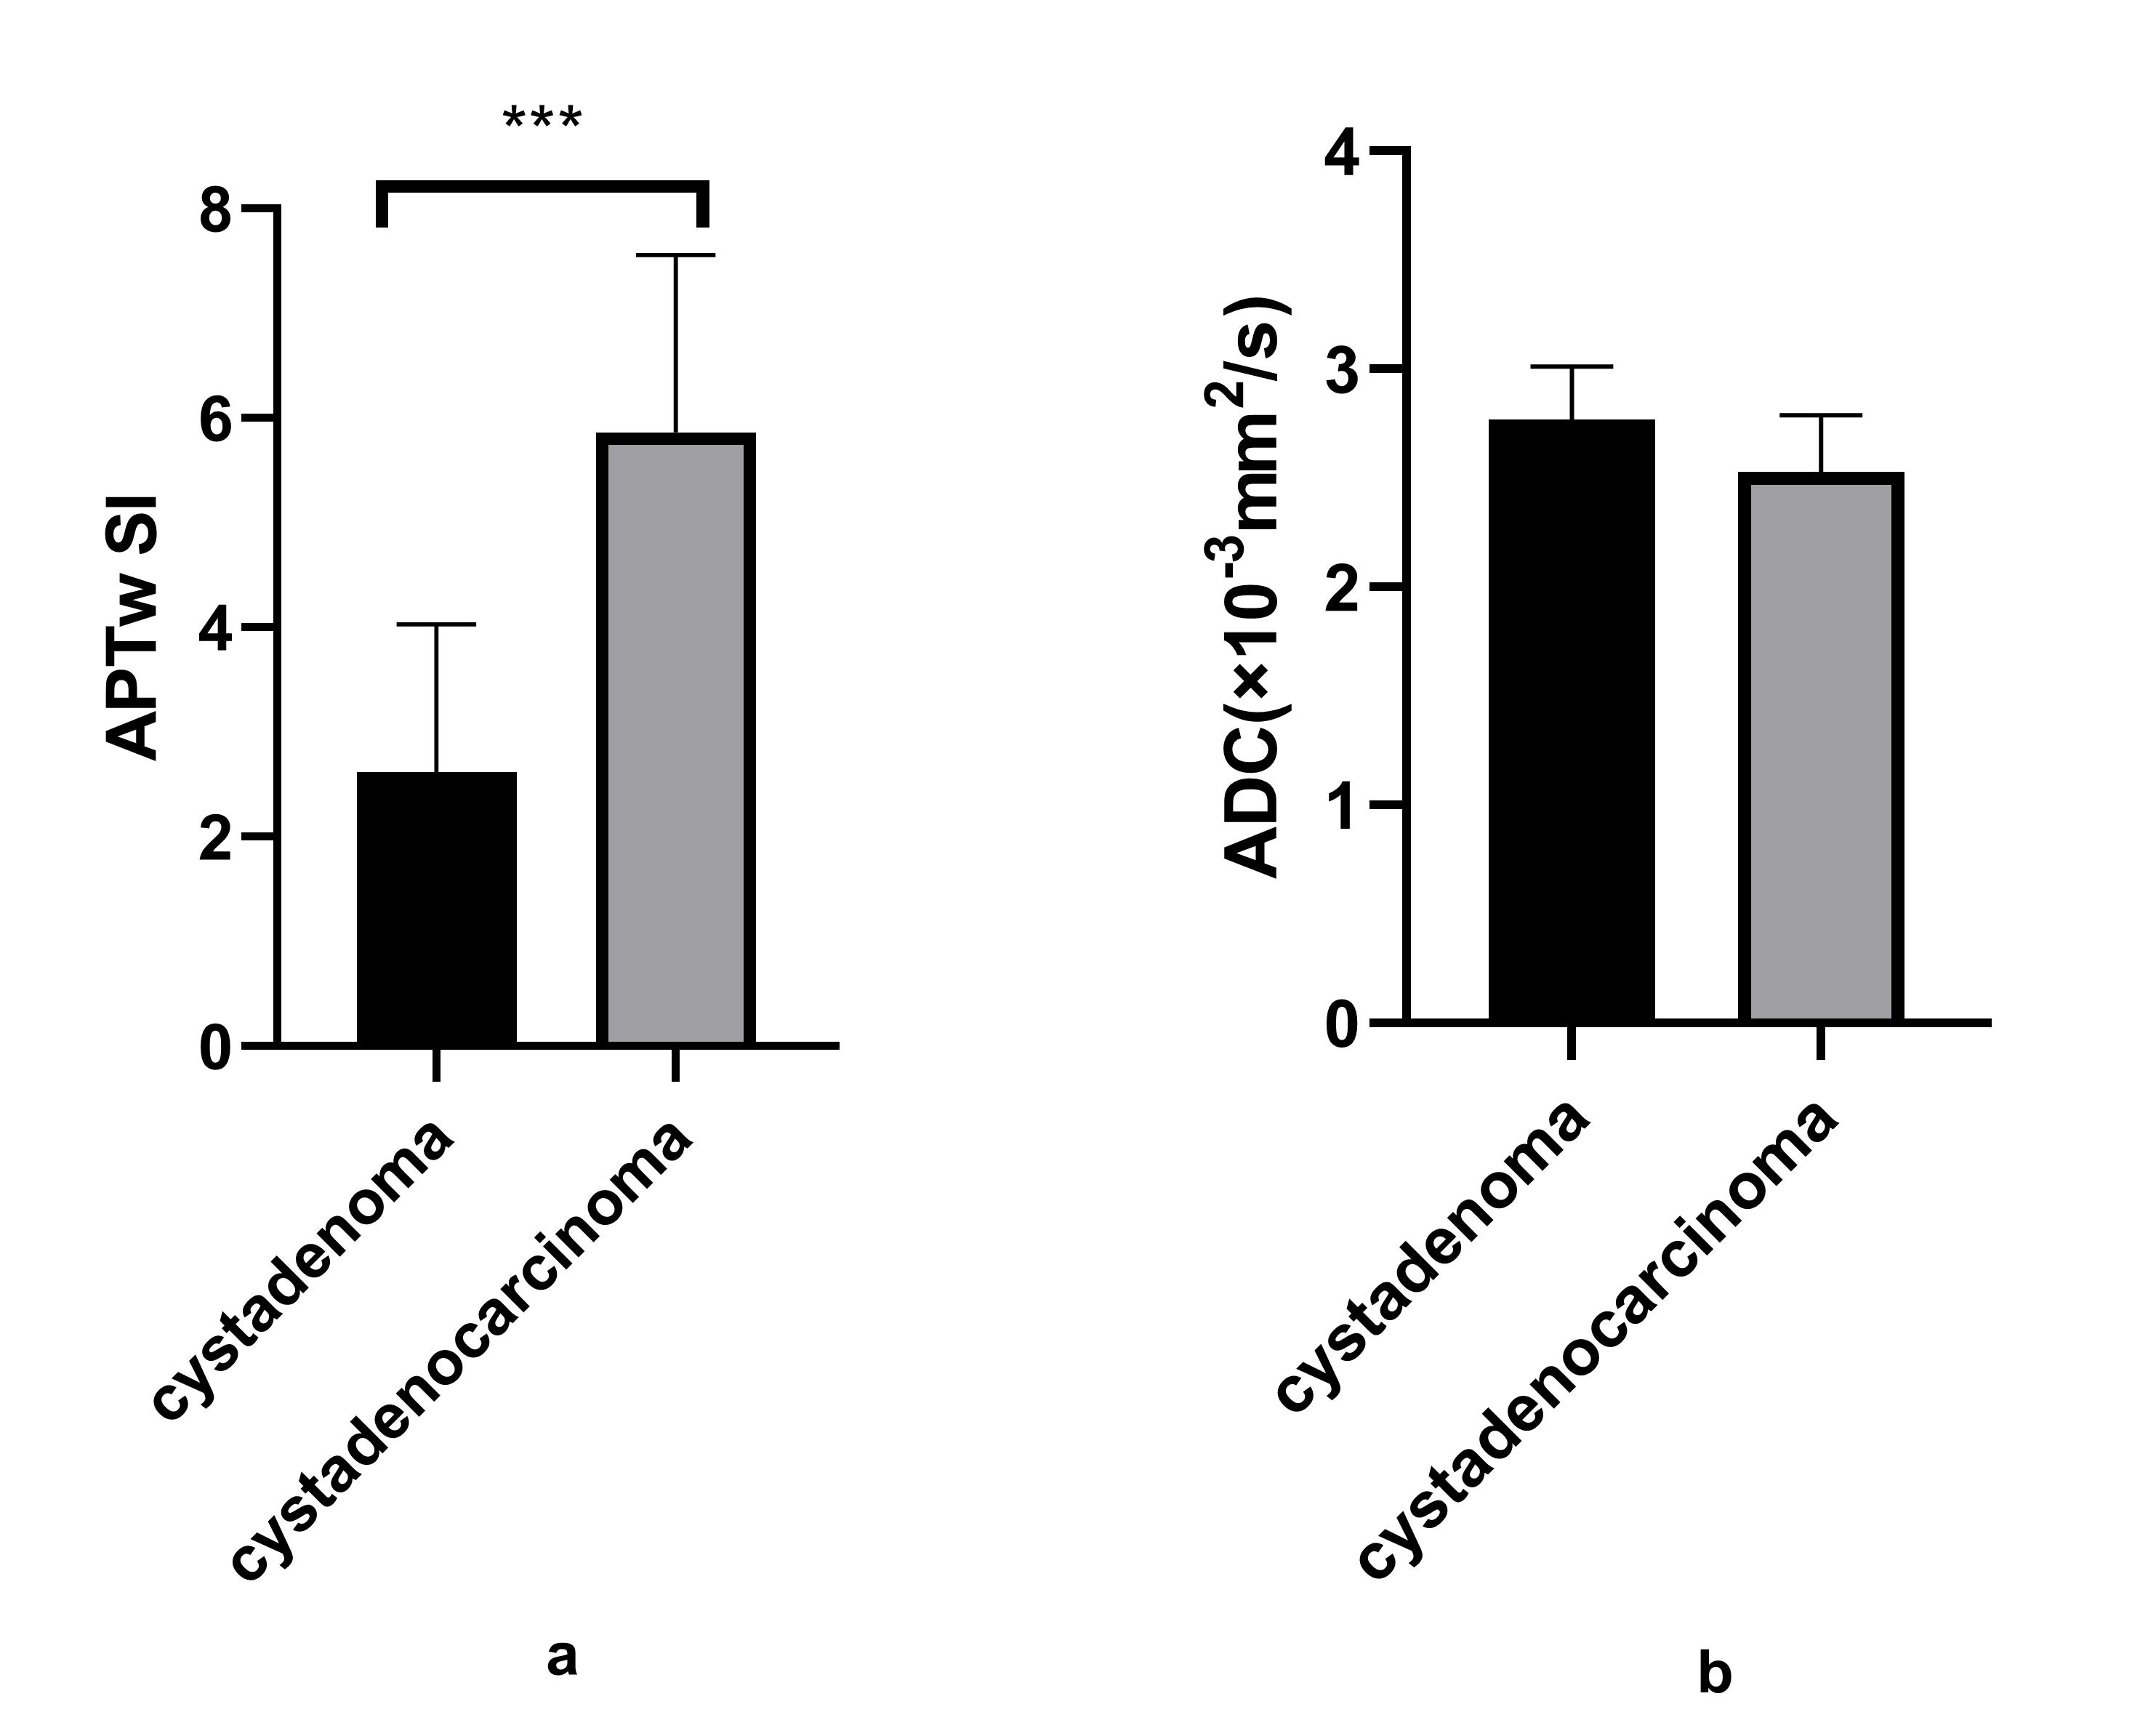
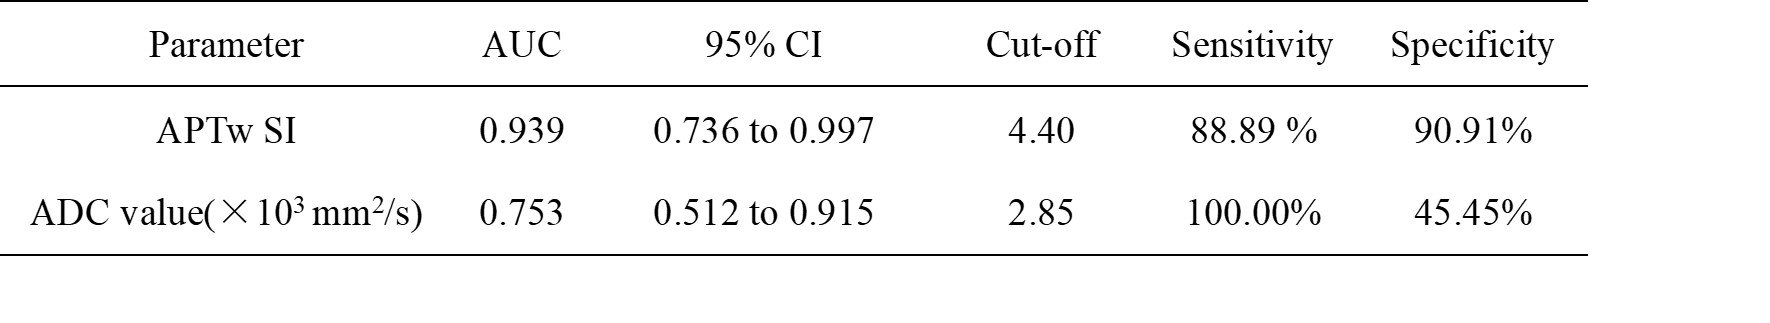
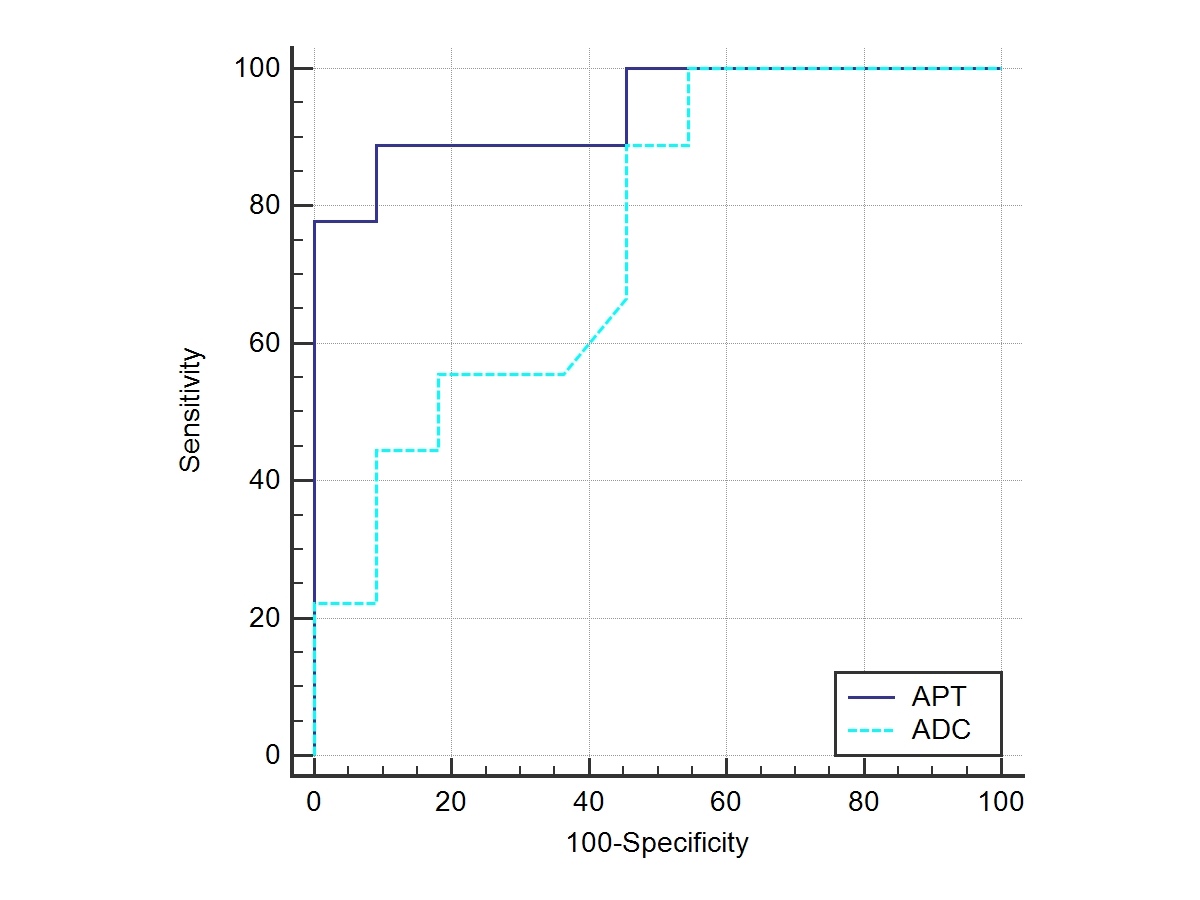
APTw SIs of cystadenoma and cystadenocarcinoma were 2.61±1.13 and 5.95±1.61, respectively, with a significant difference (P<0.001) (Table 1, Figure 2). Whereas there was no significant difference in ADC values (×103 mm2/s) of the two groups (2.77±0.11 and 2.53±0.25, respectively) (Table 1, Figure 2). APTw SIs exhibited better diagnostic performance than ADC values for the differentiation of cystadenoma and cystadenocarcinoma, and the AUCs of APTw SI and ADC values were 0.939 (sensitivity: 88.89%; specificity: 90.91%) and 0.753 (sensitivity: 100.00 %; specificity: 45.45%), respectively (Table 2, Figure 3).Discussion and Conclusion
In this study, the APTw SI of cystadenocarcinoma was significantly higher than that of cystadenoma, while such difference was not found in ADC values. ROC analysis also revealed that APTw SIs had a better diagnostic efficacy compared with ADC values. Our results are partially consistent with previous studies of APT imaging on gliomas, which found that APTw SIs of cystic cavities of gliomas were higher than those of the surrounding normal white matter.4-5 A meta-analysis revealed no statistically significant difference in ADC values between benign and malignant ovarian masses, although the mean ADC value of malignant ovarian masses may be lower than that of benign ovarian masses.7 Our preliminary experiments have reached a similar conclusion. Component analysis shows an increase in the cystic fluid of malignant ovarian tumors8-9 and APTw MRI can reflect the content of mobile proteins and peptides in tissues.10 Therefore, APTw MRI might have a potential in the differential diagnosis between cystadenoma and cystadenocarcinoma. APTw SIs may be used as a noninvasive tool for differential diagnosis and therapy guidance. In the future, a prospective cohort study with a large sample size is needed to provide more reliable findings.Acknowledgements
We acknowledge the support from the National Natural Science Foundation of China [grant numbers 82071914].References
1. Carvalho JP, Moretti-Marques R, Filho A. Adnexal mass: diagnosis and management. Rev Bras Ginecol Obstet. 2020;42(7):438-43.
2. Vargas HA, Barrett T, Sala E. MRI of ovarian masses. J Magn Reson Imaging. 2013;37(2):265-81.
3. Zhou J, Yan K, Zhu H. A simple model for understanding the origin of the amide proton transfer MRI signal in tissue. Appl Magn Reson. 2012 Apr;42(3):393-402.
4. Wen Z, Hu S, Huang F, Wang X, Guo L, Quan X, et al. MR imaging of high-grade brain tumors using endogenous protein and peptide-based contrast. Neuroimage. 2010;51(2):616-22.
5. Zhou J, Zhu H, Lim M, Blair L, Quinones-Hinojosa A, Messina SA, et al. Three-dimensional amide proton transfer MR imaging of gliomas: Initial experience and comparison with gadolinium enhancement. J Magn Reson Imaging. 2013;38(5):1119-28.
6. Ishimatsu K, Nishie A, Takayama Y, Asayama Y, Ushijima Y, Kakihara D, et al. Amide proton transfer imaging for differentiating benign ovarian cystic lesions: Potential of first time right. Eur J Radiol. 2019;120:108656.
7. Kim HJ, Lee SY, Shin YR, Park CS, Kim K. The Value of Diffusion-Weighted Imaging in the Differential Diagnosis of Ovarian Lesions: A Meta-Analysis. PLoS One. 2016 Feb 23;11(2): e0149465.
8. Kyriakides M, Rama N, Sidhu J, Gabra H, Keun HC, El-Bahrawy M. Metabonomic analysis of ovarian tumour cyst fluid by proton nuclear magnetic resonance spectroscopy. Oncotarget. 2016;7(6):7216-26.
9. Perumal J, Mahyuddin AP, Balasundaram G, Goh D, Fu CY, Kazakeviciute A, et al. SERS-based detection of haptoglobin in ovarian cyst fluid as a point-of-care diagnostic assay for epithelial ovarian cancer. Cancer Manag Res. 2019;11:1115-24.
10. Zhou J, Heo HY, Knutsson L, van Zijl PCM, Jiang S. APT-weighted MRI: Techniques, current neuro applications, and challenging issues. J Magn Reson Imaging. 2019;50(2):347-64.
Figures
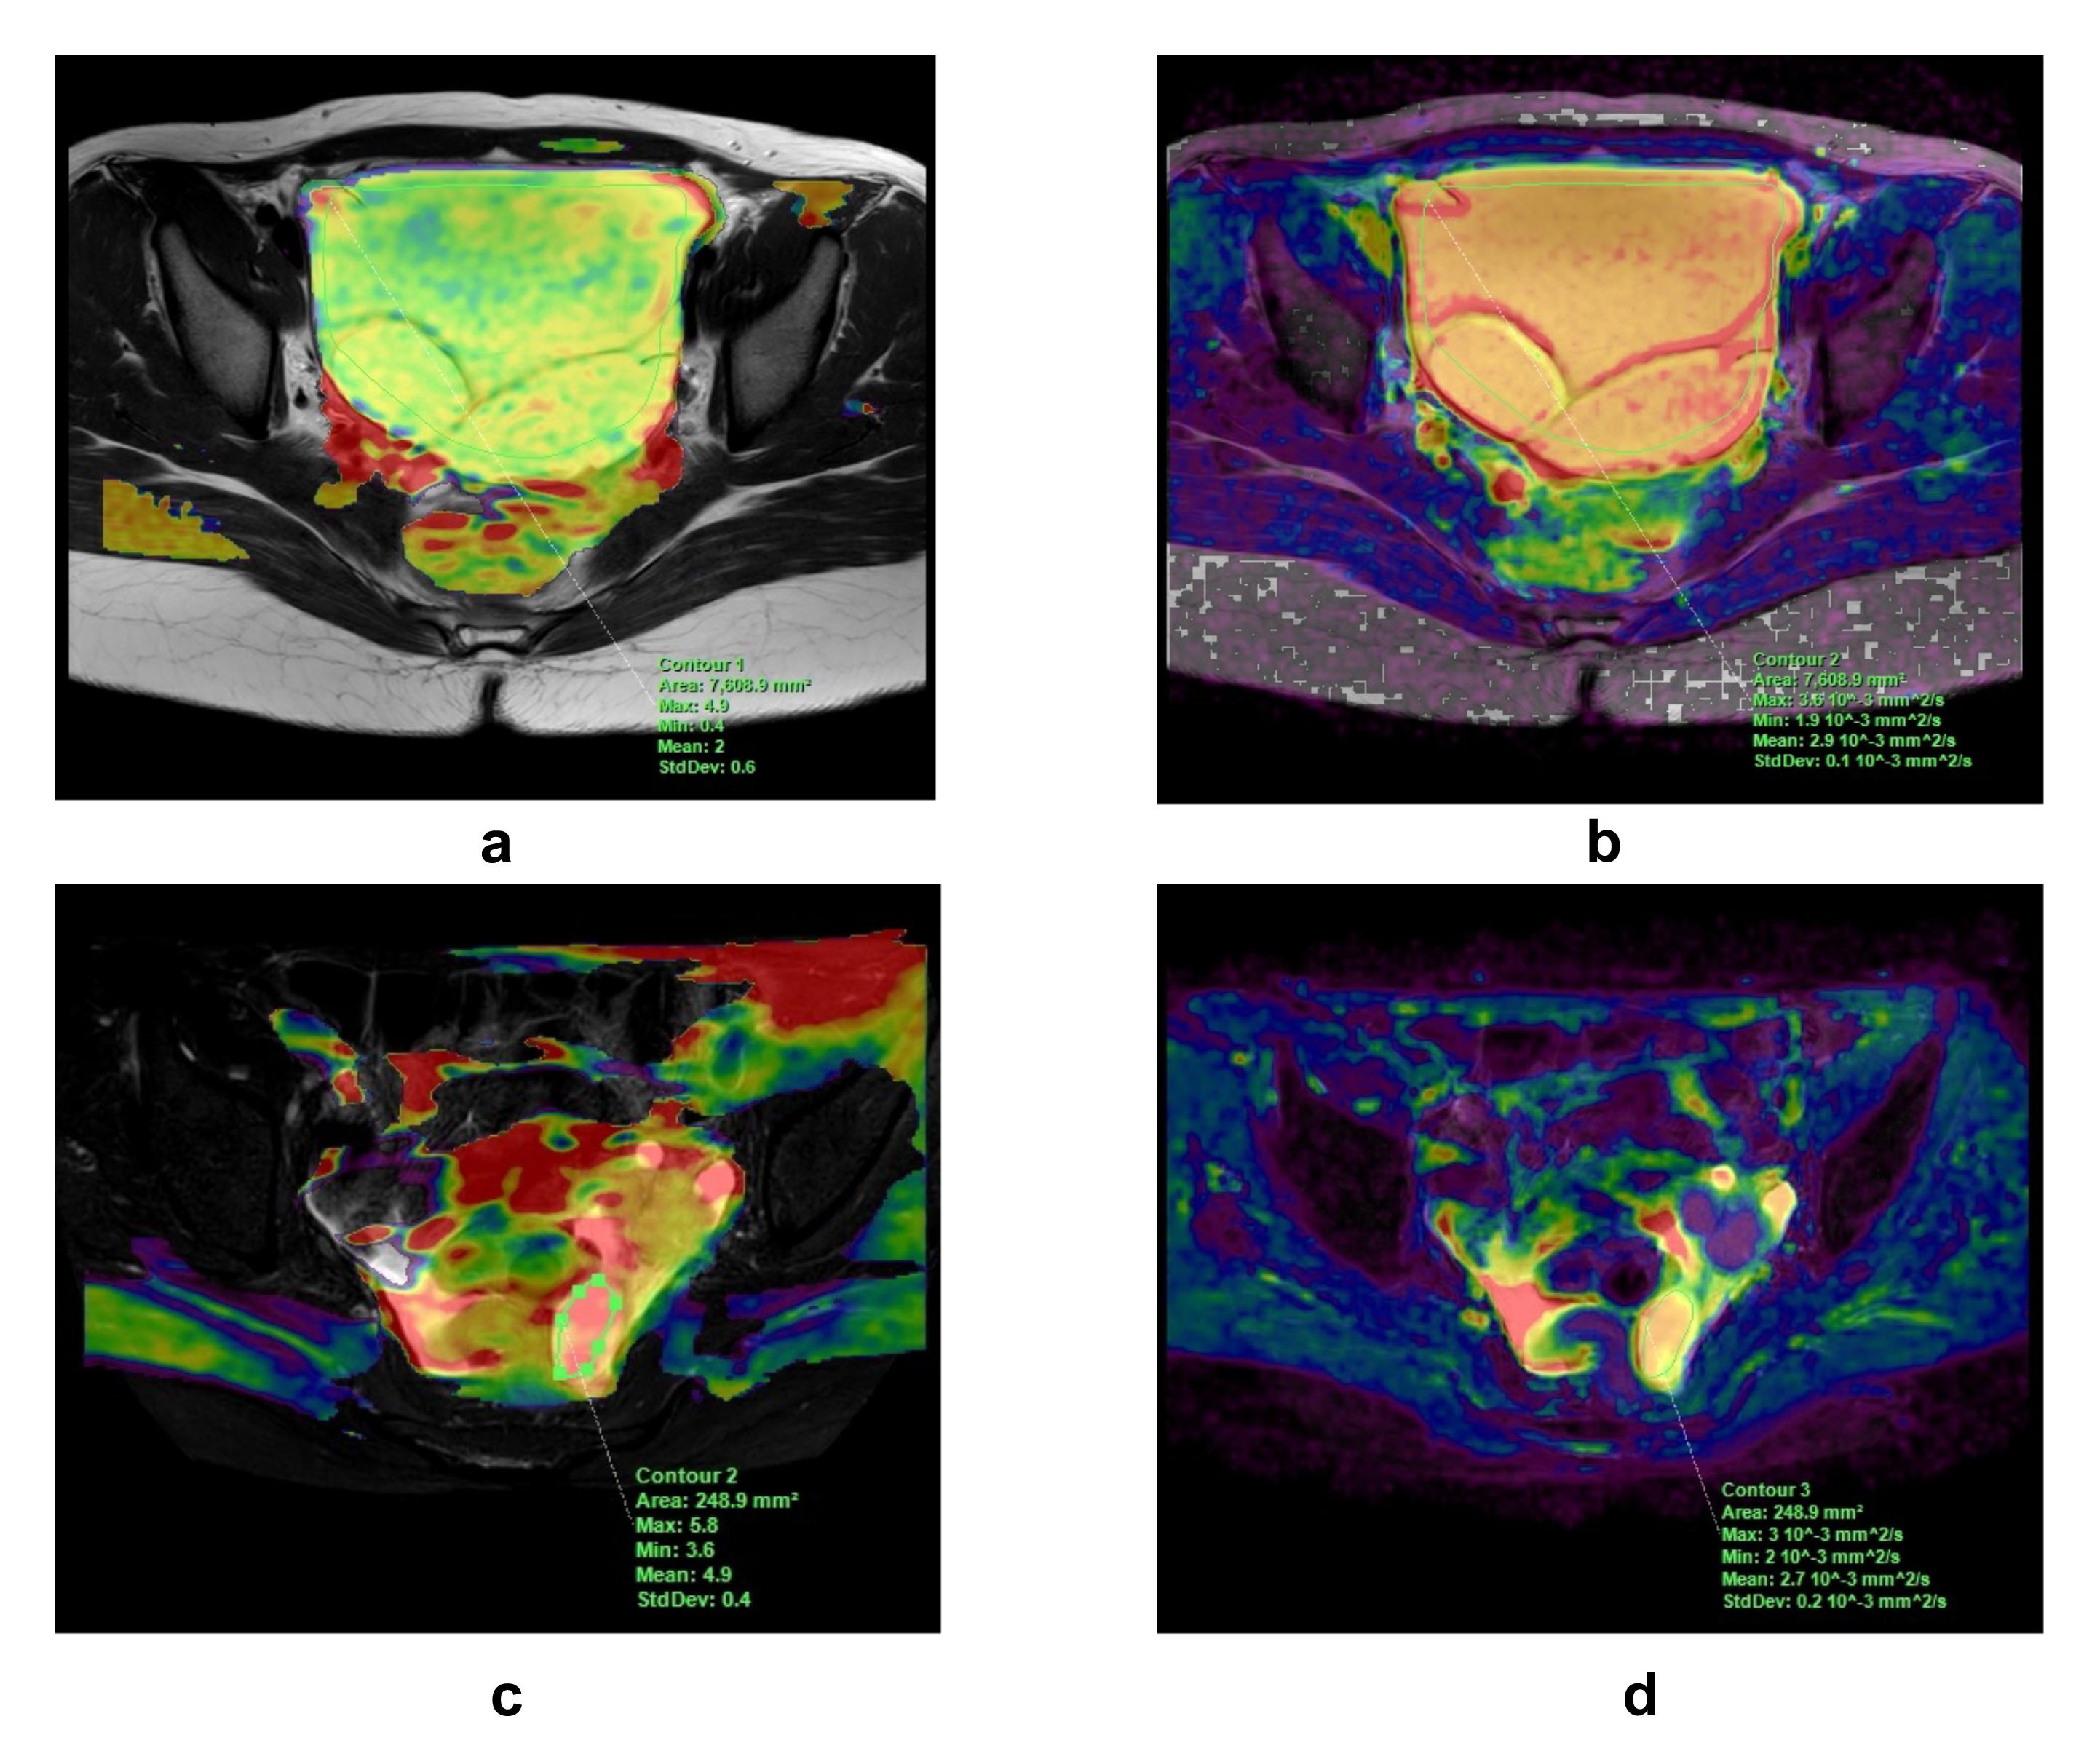
Figure 1. ROI delineation scheme.
(a, b) An 18-year-old woman with mucinous cystadenoma. (a) Fused image of APTw MRI and T2WI shows a low-signal-intensity lesion of the left ovary (APTw SI = 2.0); the ROI was delineated with 1-2 mm to the edge of the lesion. (b) Fused image of ADC map and T2WI on the same slice (ADC value = 2.9×103mm2/s).
(c, d) A 57-year-old woman with serous cystadenocarcinoma. (c) Fused image of APTw MRI and T2WI shows a heterogeneously high signal intensity of the lesion (APTw SI = 4.9). (d) Fused image of ADC map and T2WI on the same slice (ADC value = 2.7×103mm2/s).
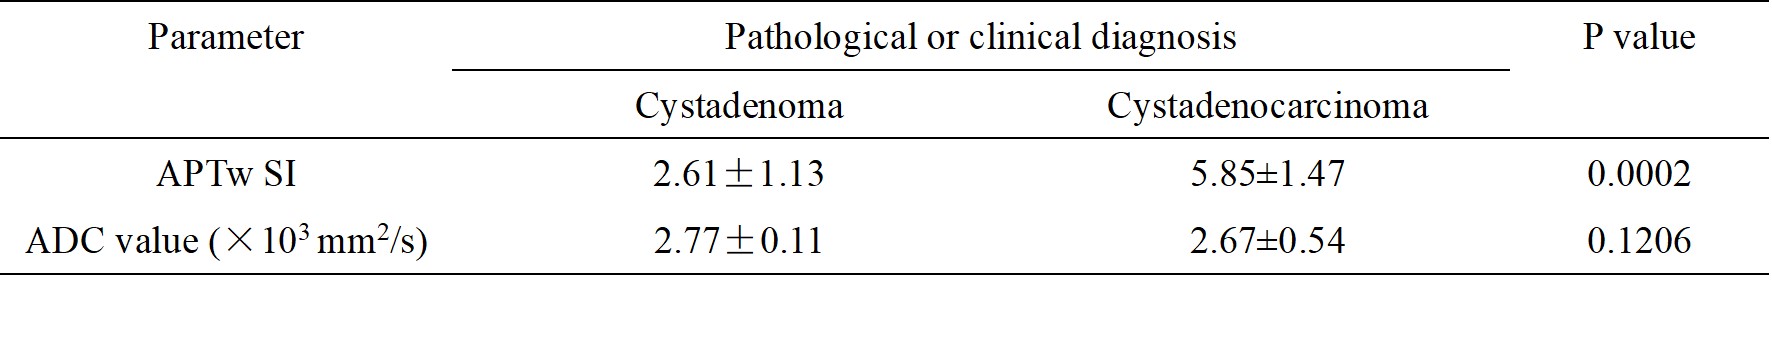
Table 1. Imaging parameters of cystadenoma and cystadenocarcinoma