0435
Water Suppression of T1 map and Synthetic Inversion Recovery images in T2-based Water Suppression Synthetic MRI (T2wsup-synMRI)1Radiokogical engineering, Shizuoka College of Medical care Science, Hamamatsu, Japan
Synopsis
Keywords: MR Fingerprinting/Synthetic MR, Brain
The purpose of this study was to propose a new technique to provide water suppression (wsup) T1 maps by modifying our already proposed T2wsup technique, then to assess the effects of wsup-T1 on longitudinal magnetization (Mz) in synthetic MRI images of FLAIR and DIR by a simulation and an in-vivo MR study. The errors in DIR at CSF-tissue mixed portions were non-negligible with std-T1 but could be reduced with wsup-T1. The T2wsup-SynMRI technique can provide 3 kinds of water suppressed quantitative maps and the same contrasts synthetically as the acquired IR sequences of FLAIR and DIR.Introduction
A standard synthetic MRI technique (synMRI) 1 can provide synthetic contrast weighted images of proton, T1 and T2 from the quantitative maps of PD, T1, and T2. However, high-signal intensity artifacts induced by CSF partial volume effects (PVE) are problematic in the obtained synthetic FLAIR images. 2-5A new synthetic MRI technique combined with T2-based water suppression (T2wsup-synMRI) can solve the problem by using the water suppressed (wsup) T2 maps obtained from long TE images of heavy T2 weighted (T2W).6, 7
However, the effects of T1 maps of std and wsup were not so clear especially in inversion recovery (IR) synMRI images of single IR (SIR) including FLAIR and double IR (DIR).
The purpose of this study was to propose a new technique to provide wsup-T1 maps by modifying T2wsup technique, then to assess the effects of wsup-T1 on longitudinal magnetization (Mz) in synMRI images of FLAIR and DIR by a simulation and an in-vivo MR study.
Methods
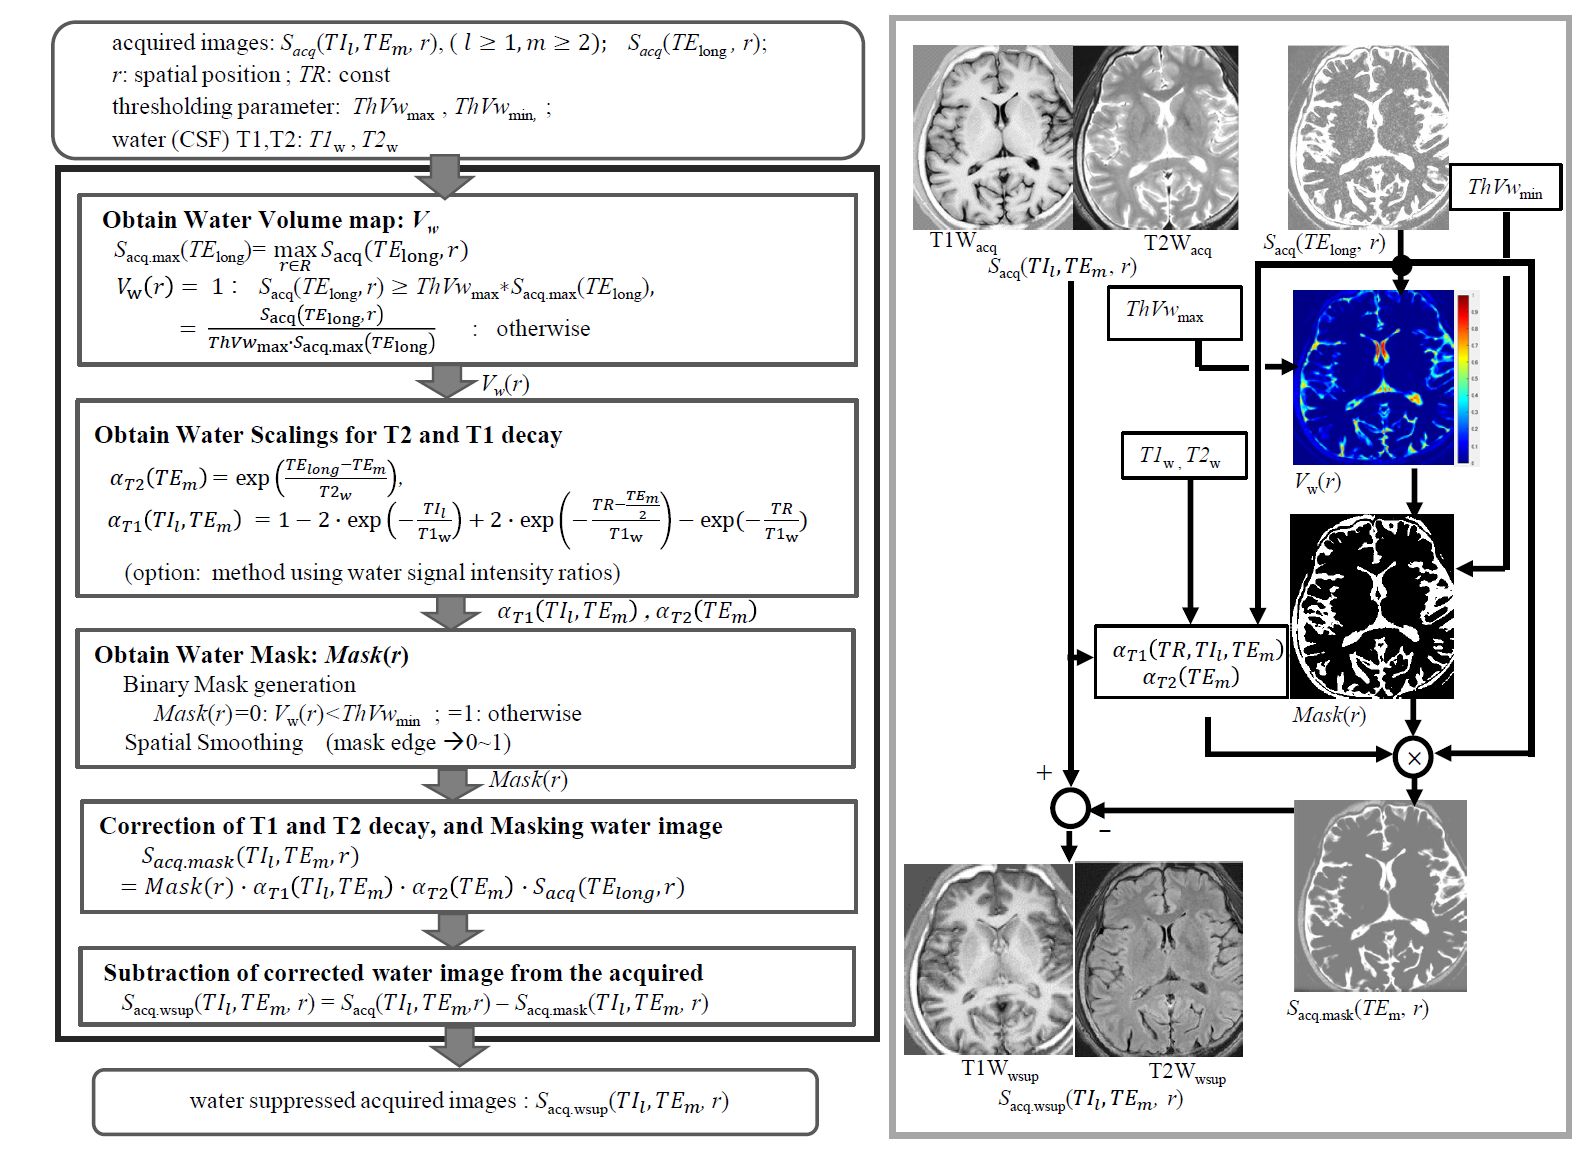
a. Water suppression of T1 mapThe wsup-T1 maps were obtained, similarly as the wsup- PD and T2 maps, by suppressing water signals in the acquired images to calculate T1, where the water suppression was performed by subtracting the optimally scaled and masked water images obtained from heavy T2W images (Fig. 1).After water suppression of the acquired images of PDW, T2W and IR-T1W, wsup-T1, T2, and PD maps were calculated based on the spin echo (SE) signal models. When 3 points of SPDW(TE1), ST2W(TE2) and ST1W(TI1, TE1), (TE2>TE1) with the same TR are used, the wsup-T2, T1, PD maps were calculated in the same way as the standard as:
$$T2=-\frac{TE_{2}-TE_{1}}{ln[\frac{S_{T2W(TE_{2})}}{S_{PDW(TE_{1})}}]}$$,
$$T1=-\frac{TI_{1}}{ln\left[0.5\left\{1-\frac{S_{T1W(TI_1,TE_1)}}{S_{PDW(TE_1)}}\right\}\right]}$$,
$$PD=\frac{{S_{PDW}(TE_{1})}}{{[1-2exp(-\frac{TR-\frac{TE_{1}}{2}}{T_{1}})+exp(-\frac{TR}{T_{1}})]\cdot}exp(-\frac{TE_{1}}{T_{2}})}$$.
.
b. Experiments
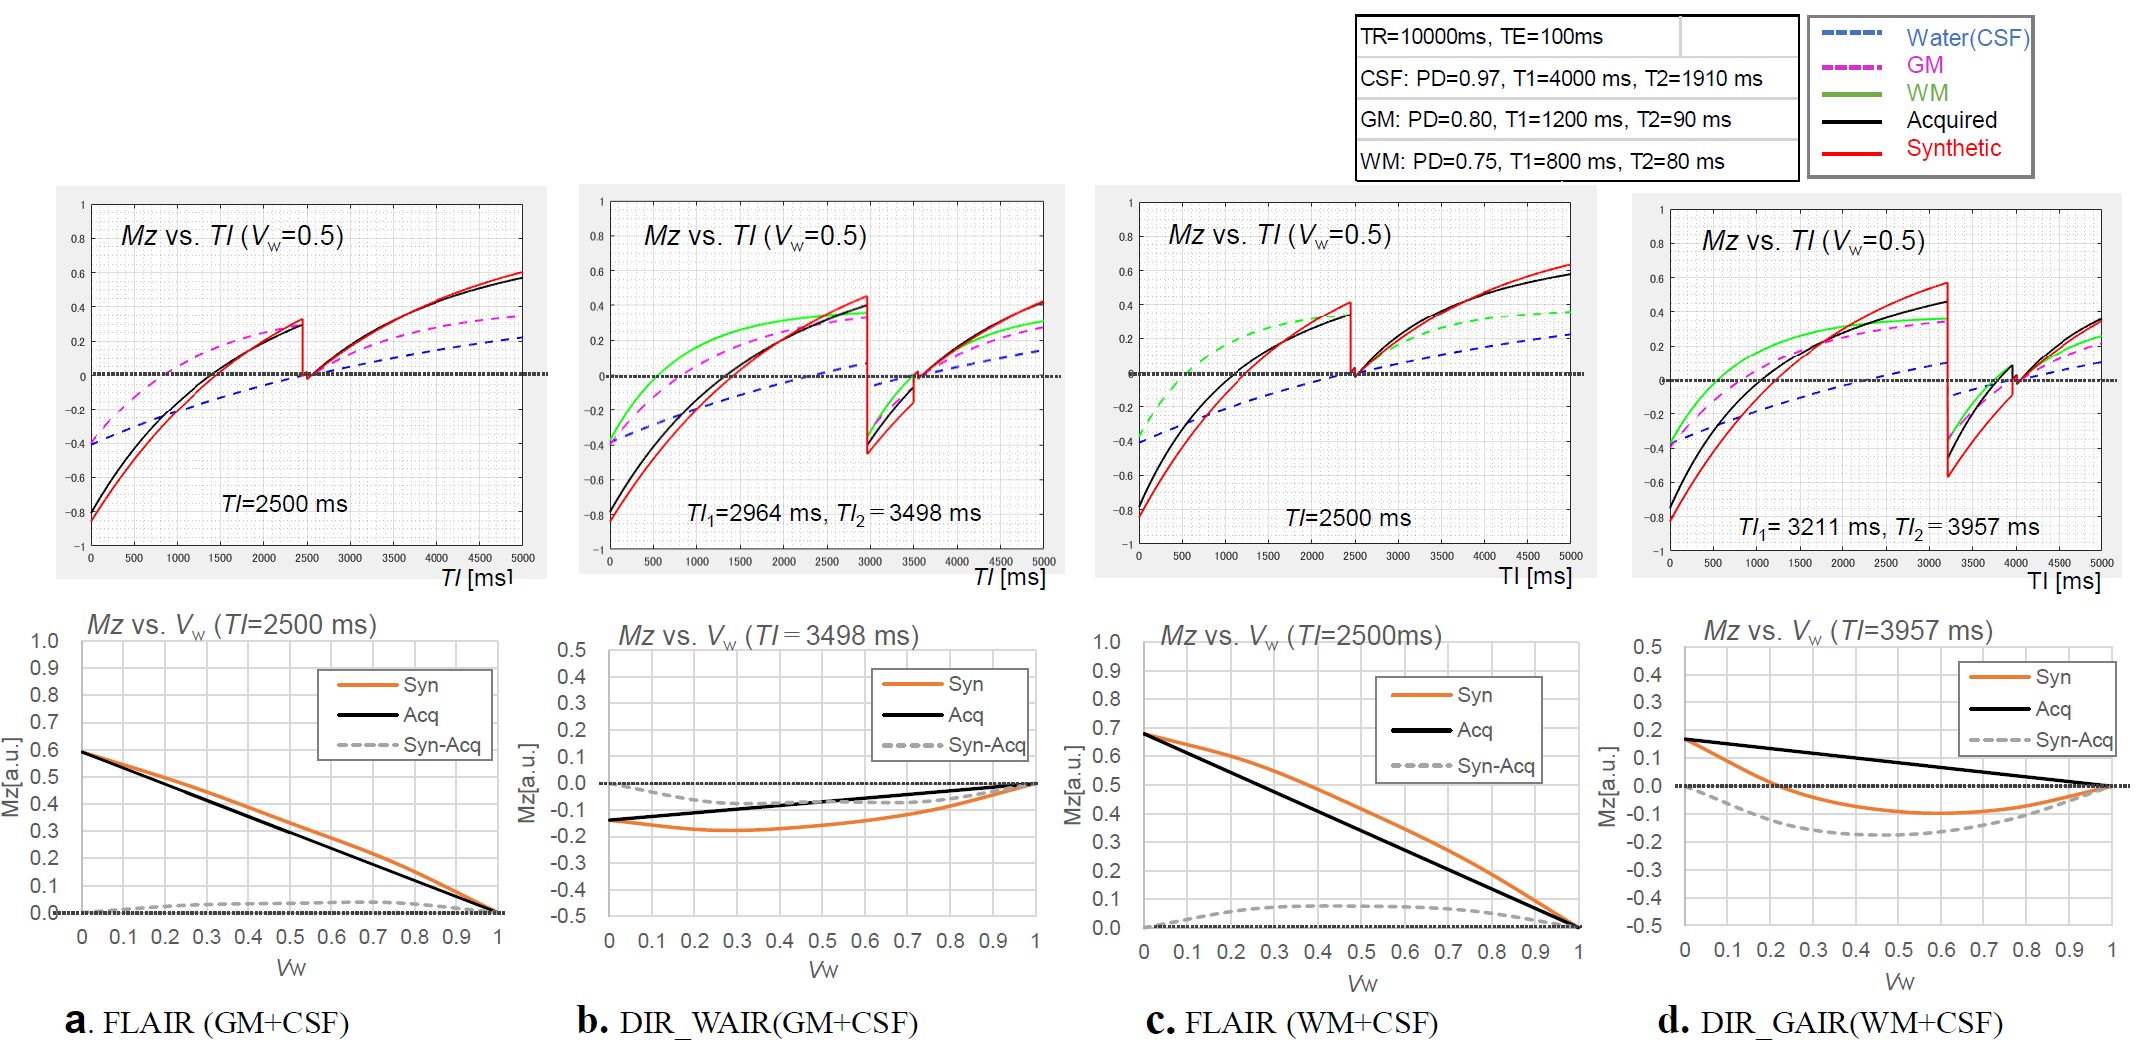
In this study, it was assumed that (T1, T2) [ms] of gray matter (GM), white matter (WM), and water, are (1200, 90), (800,80), and (4000, 1900) for simulation, and water for in-vivo MRI was (3000, 1000). Data was assumed to be minimum 4 points of spin echo (SE) different contrasts (PDW, T1W, T2W, and heavy T2W).
In simulation study, the errors between Mz (TE=0) values of synthetic IR with std-T1 and those of acquired were assessed. For IR sequence, SIR (FLAIR), DIRs of a WM suppression (WAIR) and GM suppression (GAIR) were compared with each the acquired Mz as a parameter of water volume (Vw).
In in-vivo MRI study, head volunteer 4 contrast images with the same parameters as the simulation were acquired on Galan 3T[ZGO] (Canon medical systems, Otawara, Japan) after obtaining written informed consent. A FSE sequence was used, and the acquisition parameters were the following: parallel imaging (SPEEDER) of speed-up factor 2; acquisition matrix of 256 × 256; display matrix of 512 × 512 after sinc interpolation; FOV = 23 cm; slice thickness = 5 mm; number of slices was commonly selected at maximum for TElong = 500 ms; number of average, 1; ThVwmax=0.8; and ThVwmin =0.05.
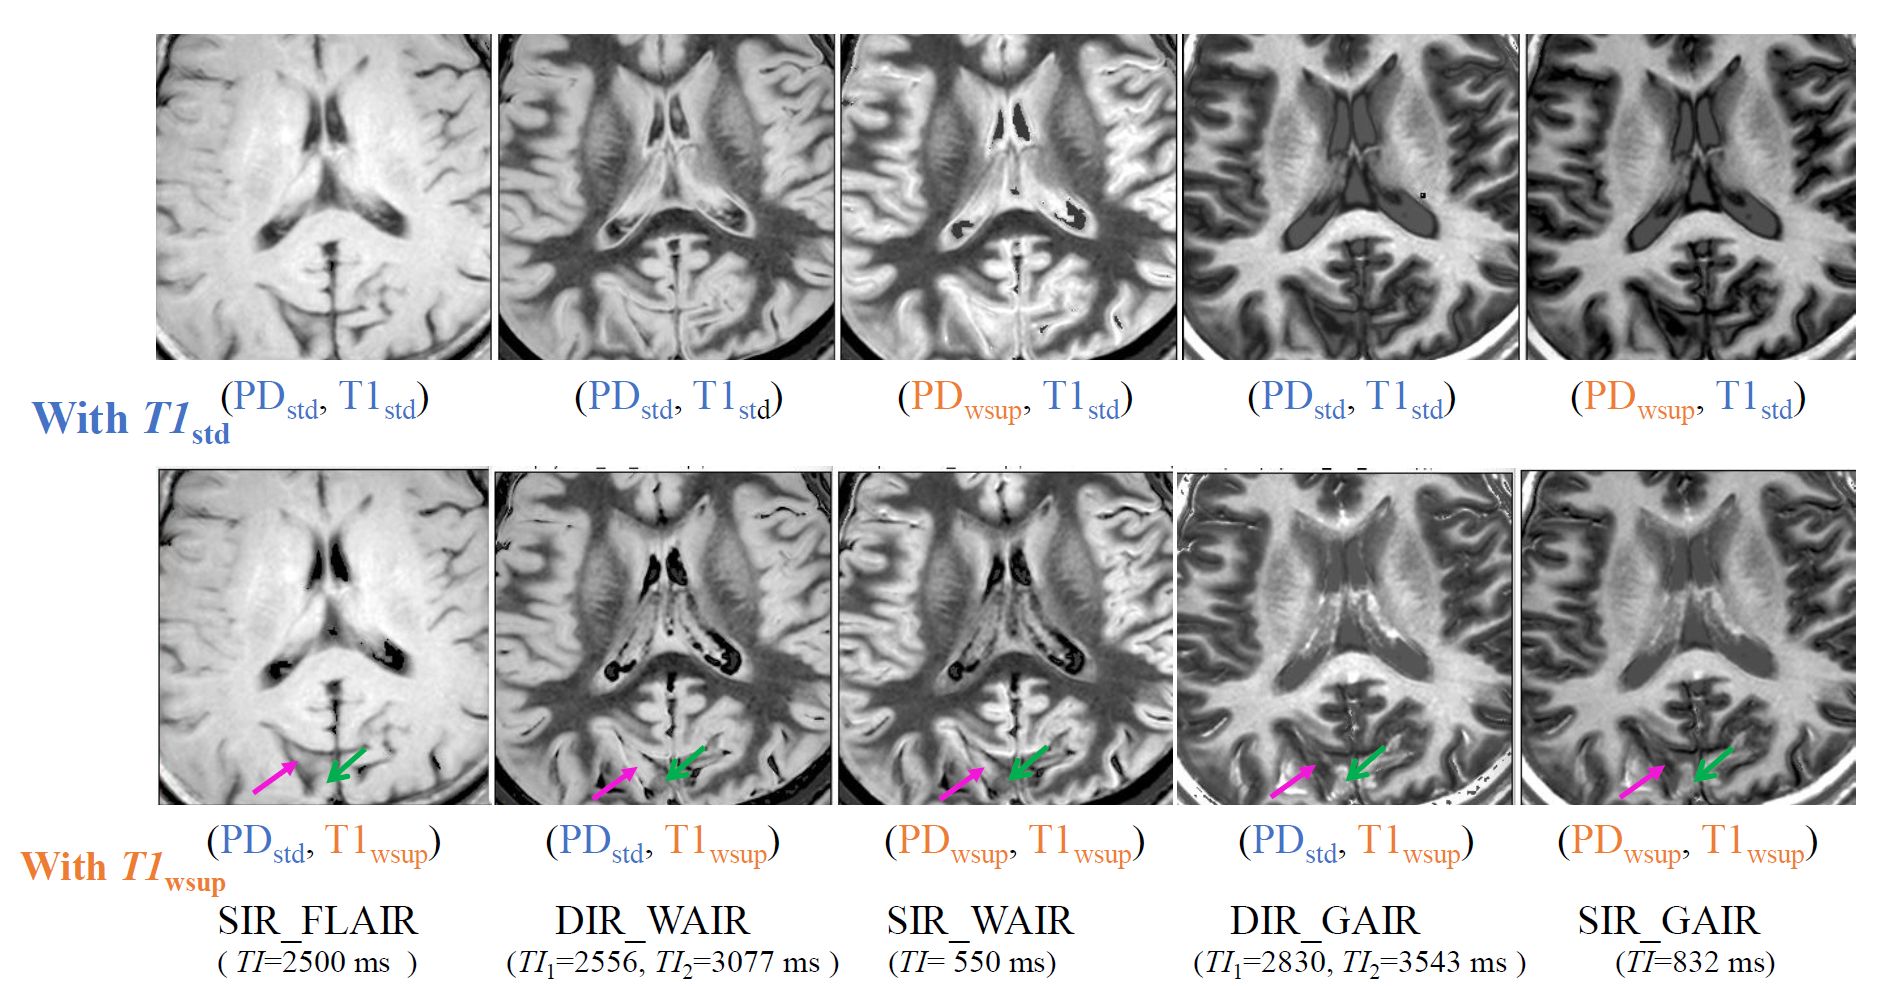
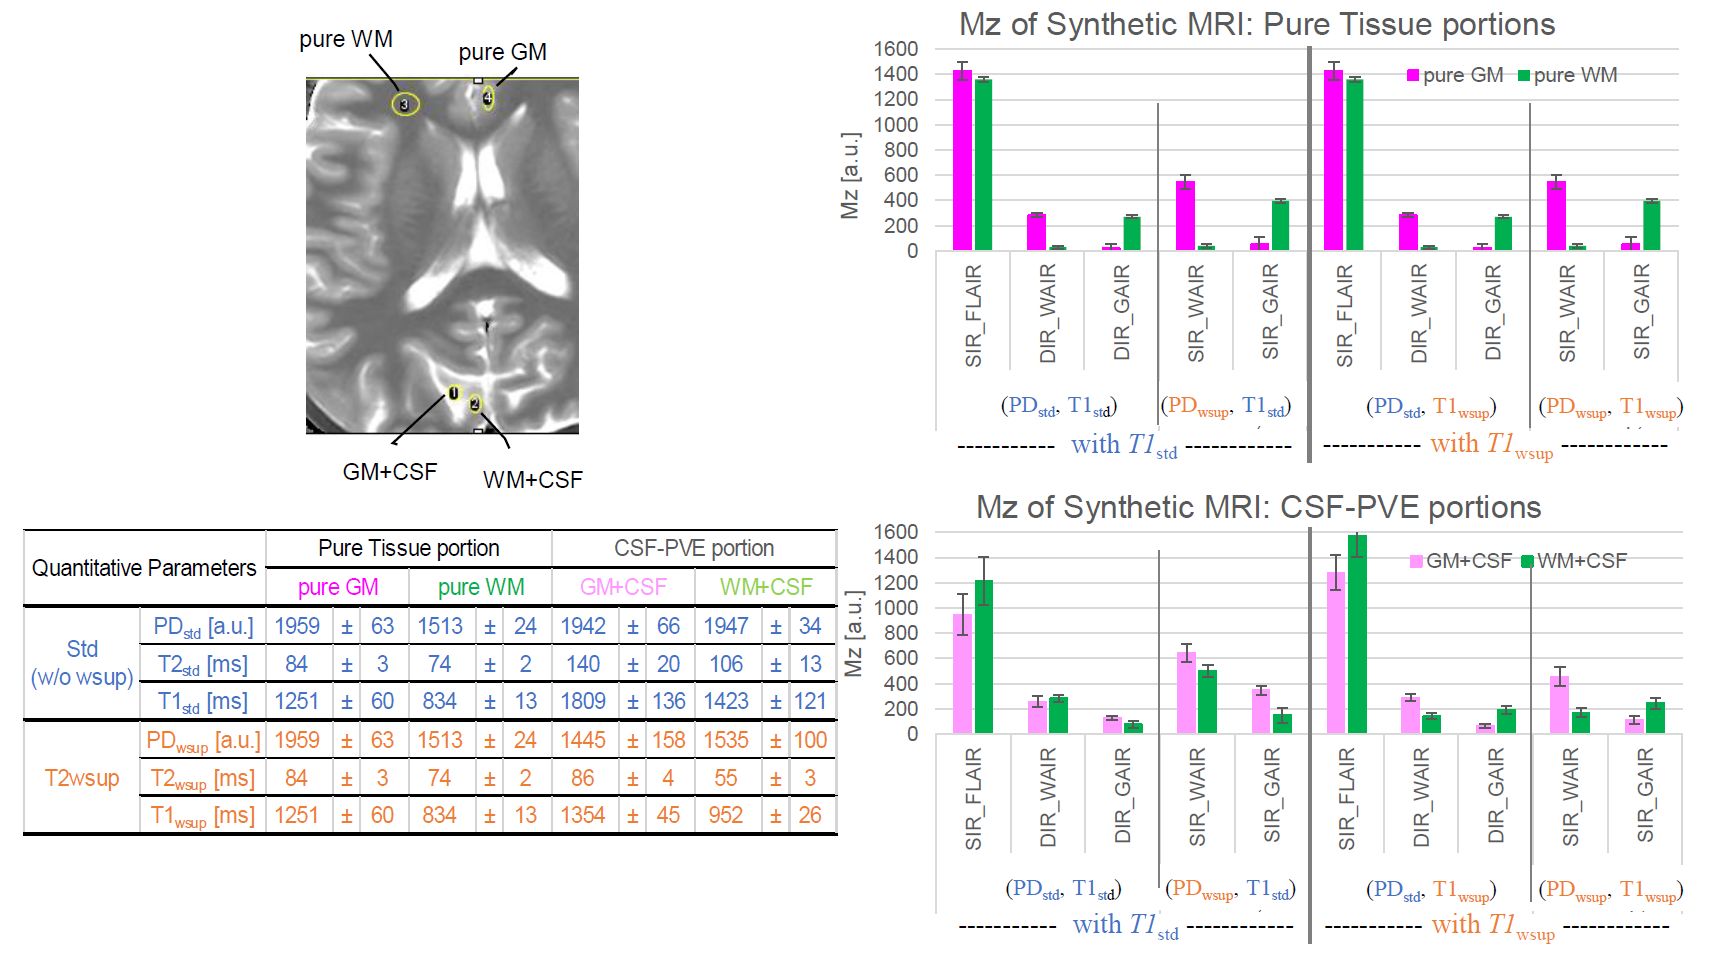
Synthetic Mz images obtained by SIR and DIR each with (PDstd, T1std) and (PDstd, T1wsup) were compared on the CSF-PVE and pure tissue portions.
In addition, Mz images of Synthetic DIR like SIR (SIR_WAIR, SIR_GAIR) images in each combination with (PDwsup, T1std) and (PDwsup, T1wsup) were also compared. Parameters of TI in SIR (FLAIR) and (TI1, TI2) in DIR shown in figures were calculated as nulling the target Mz of tissue or CSF, where the TI1 and TI2 were respectively duration times of 1st IR pulse - 2nd IR pulse and 1st IR pulse - flip pulse.
Results
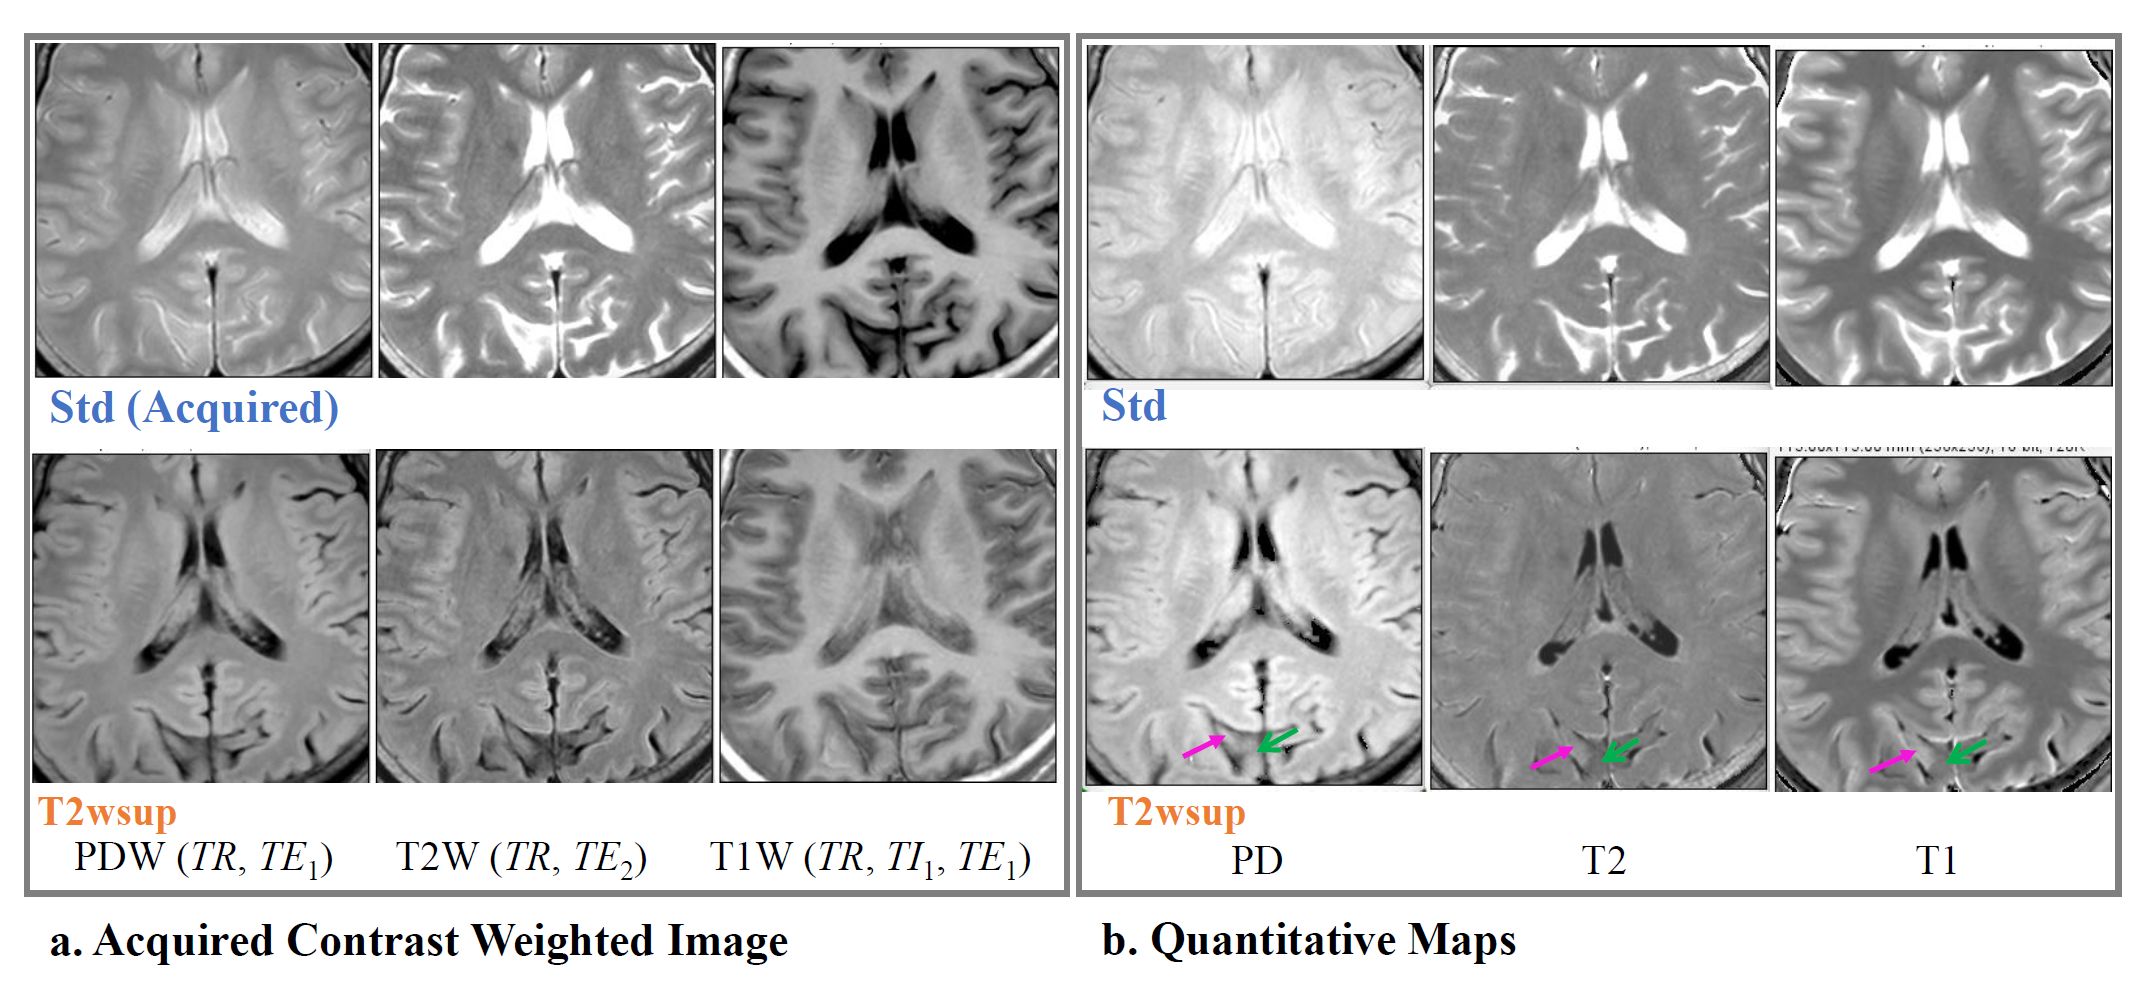
In our simulation, the errors in Mz at Vw=0.5 of FLAIR between the synthetic with T1std and the acquired were 5~10 % of PD; however, the errors in those of DIR were 10~23 % of PD. (Fig. 2)In in-vivo MRI study, the CSF components at CSF-PVE portions in the acquired (Std) contrast weighted images and quantitative maps including T1 were well suppressed by the T2wsup method (Fig. 3).
In synthetic MRI images of Mz obtained with different combinations of quantitative parameters of std and/or wsup, in CSF-PVE portions, the FLAIR with T1std and T1wsup were almost the same, but the DIR and the DIR like SIR were quite different between the case with T1std and with T1wsup, i.e., the portions of GM and WM were well separated each with T1wsup, resulting in becoming almost the same contrast as each of the pure tissues (Fig.4, 5).
Discussion
The wsup-T1 map was useful to provide the same contrast as the acquired even at CSF-PVE portions especially for the DIR sequences. When it requires synthetic T2W contrast, wsup-T2 map should be combined. The synthetic DIR like SIR technique can easily provide DIR like contrast by setting a single TI because of substituting wsup-PD for std-PD, in contrast to the syn-DIR requiring 2 TIs.In conclusion, through this study and the former studies,5, 6 the T2wsup-SynMRI technique is useful to provide 3 kinds of water suppressed quantitative maps and the same contrast weighhted images as the acquired IR sequences synthetically just by adding the heavy T2W images. It is expecting a clinical application although there is a room for optimizing the pulse sequences.
Acknowledgements
This study was supported by Policy-based medical services foundation in Japan, and MRI data acquisition was supported by Canon medical systems corp. , Oatawara, Japan.References
1. Tanenbaum LN, Tsiouris AJ, Johnson AN, et al. Synthetic MRI for clinical neuroimaging: results of the Magnetic Resonance Image Compilation (MAGiC) prospective, multicenter, multireader trial. AJNR Am J Neuroradiol 2017;38:1103–1110.
2. Hagiwara A, Warntjes M, Hori M, et al. SyMRI of the brain: rapid quantification of relaxation rates and proton density, with synthetic MRI, automatic brain segmentation, and myelin measurement. Invest Radiol 2017; 52:647–657.
3. Hagiwara A, Hori M, Yokoyama K, et al. Synthetic MRI in the detection of multiple sclerosis plaques. AJNR Am J Neuroradiol 2017; 38:257–263.
4. Granberg T, Uppman M, Hashim F, et al. Clinical feasibility of synthetic MRI in multiple sclerosis: a diagnostic and volumetric validation study. AJNR Am J Neuroradiol 2016; 37:1023–1029.
5. Hagiwara A, Hori M, Yokoyama K, et al. Utility of a multiparametric quantitative MRI model that assesses myelin and edema for evaluating plaques, periplaque white matter, and normal-appearing white matter in patients with multiple sclerosis: a feasibility study. AJNR Am J Neuroradiol 2017; 38:237–242.
6. Kimura T, Yamashita K, Fukatsu K. Synthetic MRI with T2-based Water Suppression to Reduce Hyperintense Artifacts due to CSF. Magn Reson Med Sci 2021; 20:325-337.
7. Kimura T, Yamashita K, Fukatsu K. Diffuson MR Imaging with T2-based Water Suppression (T2wsup-dMRI). Magn Reson Med Sci 2022; 21; 499–51.
Figures