0433
MRF-derived T1 and T2 map alterations in four different brain atrophy patterns in a cohort of MCI subjects1IRCCS Stella Maris Foundation, Pisa, Italy, 2Institute of Neuroscience of the CNR, Pisa, Italy, 3Azienda Ospedaliero Universitaria Pisana, Pisa, Italy, 4the Train the Brain Consortium, Pisa, Italy
Synopsis
Keywords: MR Fingerprinting/Synthetic MR, Alzheimer's Disease
Brain atrophy evaluation is crucial in the assessment of neurodegenerative diseases. However, the most common MRI measures (mostly T1-weighted derived) cannot be considered as quantitative. In this study we use T1-weighted images to identify homogeneous groups of MCI subjects in terms of brain atrophy and we assessed the capability of T1 and T2 quantification through MRF technique to elucidate at voxel level the brain alterations with respect to an age-matched healthy population. Indeed, atrophy patterns can be identified in both T1 and T2 maps paving the way to innovative brain atrophy assessment in a quantitative fashion.Introduction
Neurodegenerative disorders during aging are among the most impactful diseases in societies. The lack of understanding of the underpinning neurophysiological processes has led so far to substantial failures in their treatment. One of the main challenges is the heterogeneity of subjects at risk of dementia, whose clinical symptoms can be the result of different biological processes. Discovery of effective treatments can thus be hindered by this heterogeneity, which potentially determines beneficial effects for small subgroups but ineffectiveness when trials are conducted on the overall population. In this study, starting from a ROI-based subjects clustering on gray matter volume data, we aimed to explore the potentiality of quantitative mapping of T1 and T2 relaxation times in a population of Mild Cognitive Impaired subjects (MCI) at risk of dementia. Indeed, a quantitative assessment may play a pivotal role in longitudinal studies such as follow-up evaluation as well in the response assessment of innovative treatments.Methods
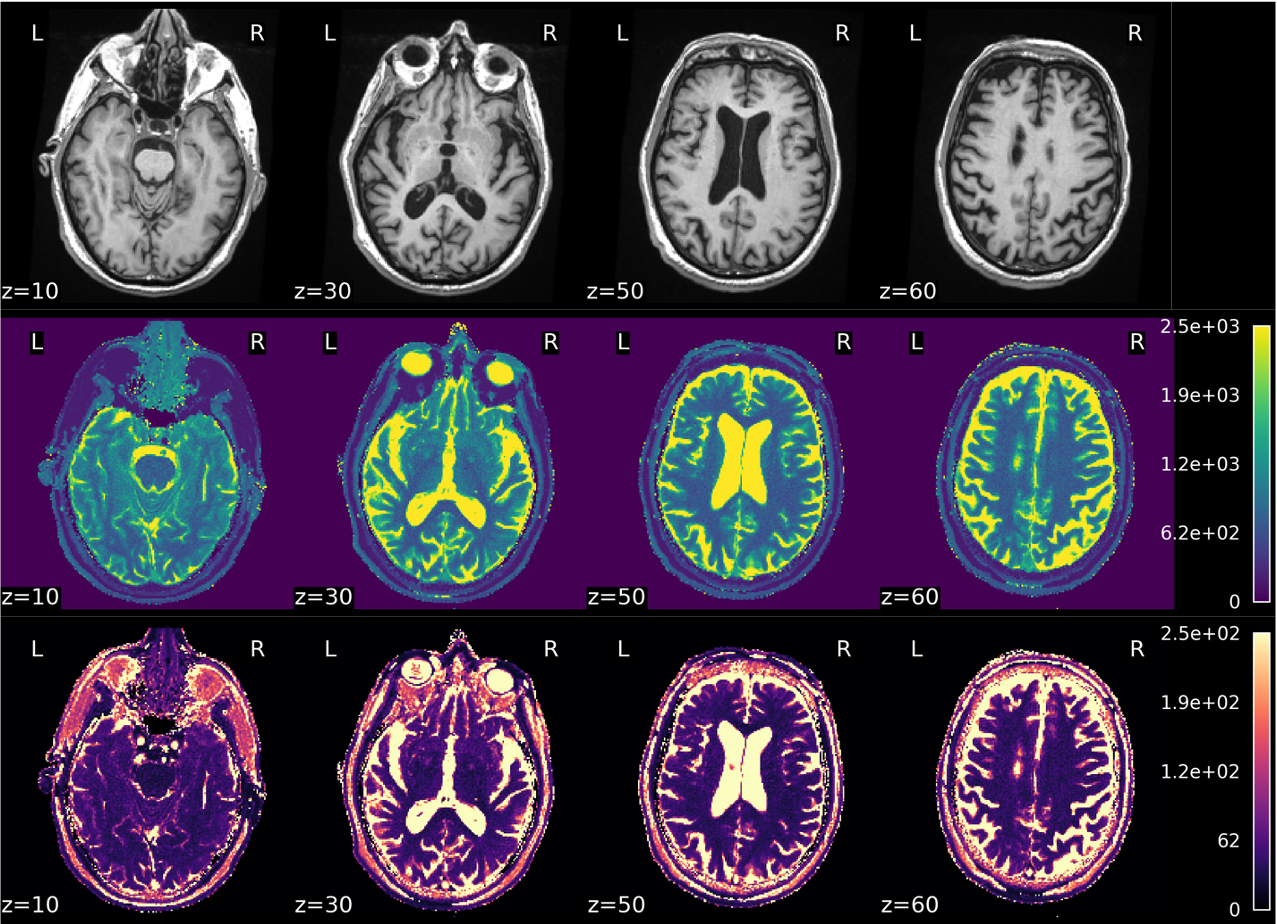
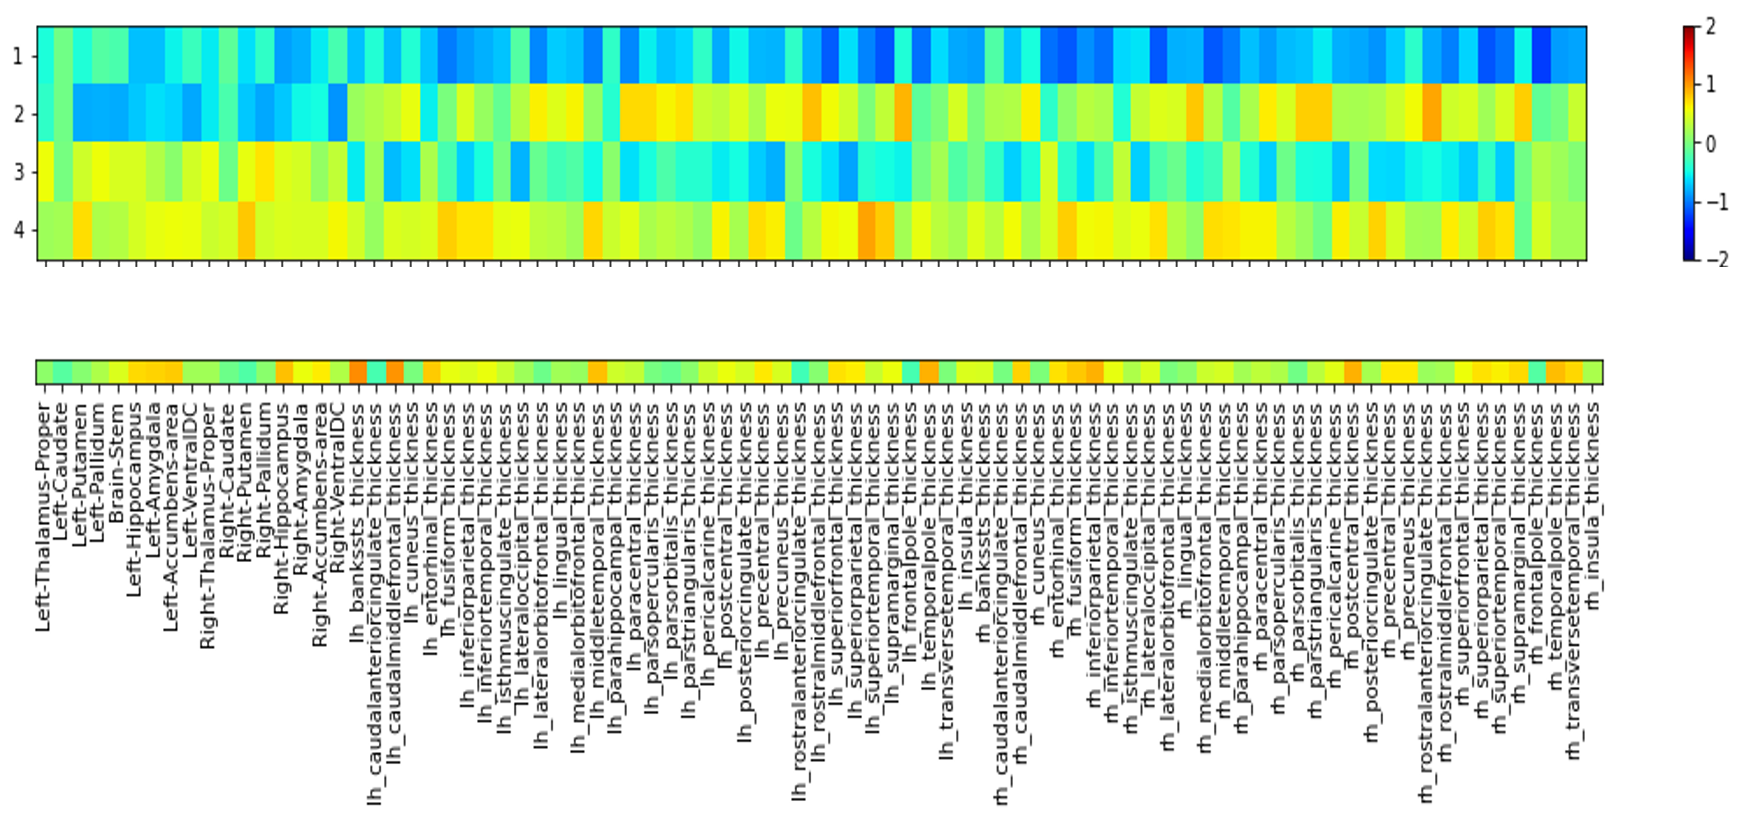
A cohort of 62 MCI subjects (65÷89 years old, mean 74.7±5.2) and a cohort of 9 age-matched healthy controls were recruited.Besides clinical evaluation, all subjects underwent an MR exam of the brain at a 1.5T scanner (GE healthcare, HDx). MRI protocol included a T1-weighted 3D FSPGR sequence (TR/TE=12650/5300 ms, prep time=700 ms, NEX=1, isotropic voxel=1×1×1 mm3) and a 2D spiral Steady-State Free Precession MRF1 for the measurements of T1 and T2 maps (voxel size:1.17×1.17×5 mm3) (Figure 1).The gray matter (GM) was segmented on T1-weighted (T1w) scans through the FreeSurfer recon-all utility2 and 19 subcortical and 68 cortical ROIs were identified. From each MCI subject, GM volume of subcortical ROIs and cortical thickness of cortical ROIs were processed through an unsupervised clustering method to identify homogeneous subgroups of subjects. The clustering method was based on a consensus clustering approach through a k-means algorithm. Since the k-means algorithm requires a predetermined number of clusters and produces different solutions depending on the starting point, we iterated the clusterization 4000 times, by varying both the number of clusters (from 2 to 10) and the starting points. In order to pick a final clustering solution, a new clusterization was performed on the clusters co-occurrence matrix of the subjects, i.e. the matrix that reports for every pair of subjects the number of times the pair was grouped in the same cluster. The MRF-derived T1 and T2 maps were coregistered to the T1w images by using ANTs3. By using SPM12 and Dartel algorithm4, a VBM analysis was performed on T1-weighted derived gray matter distributions and on T1 and T2 maps to compare the identified subgroups to the healthy subjects.Results
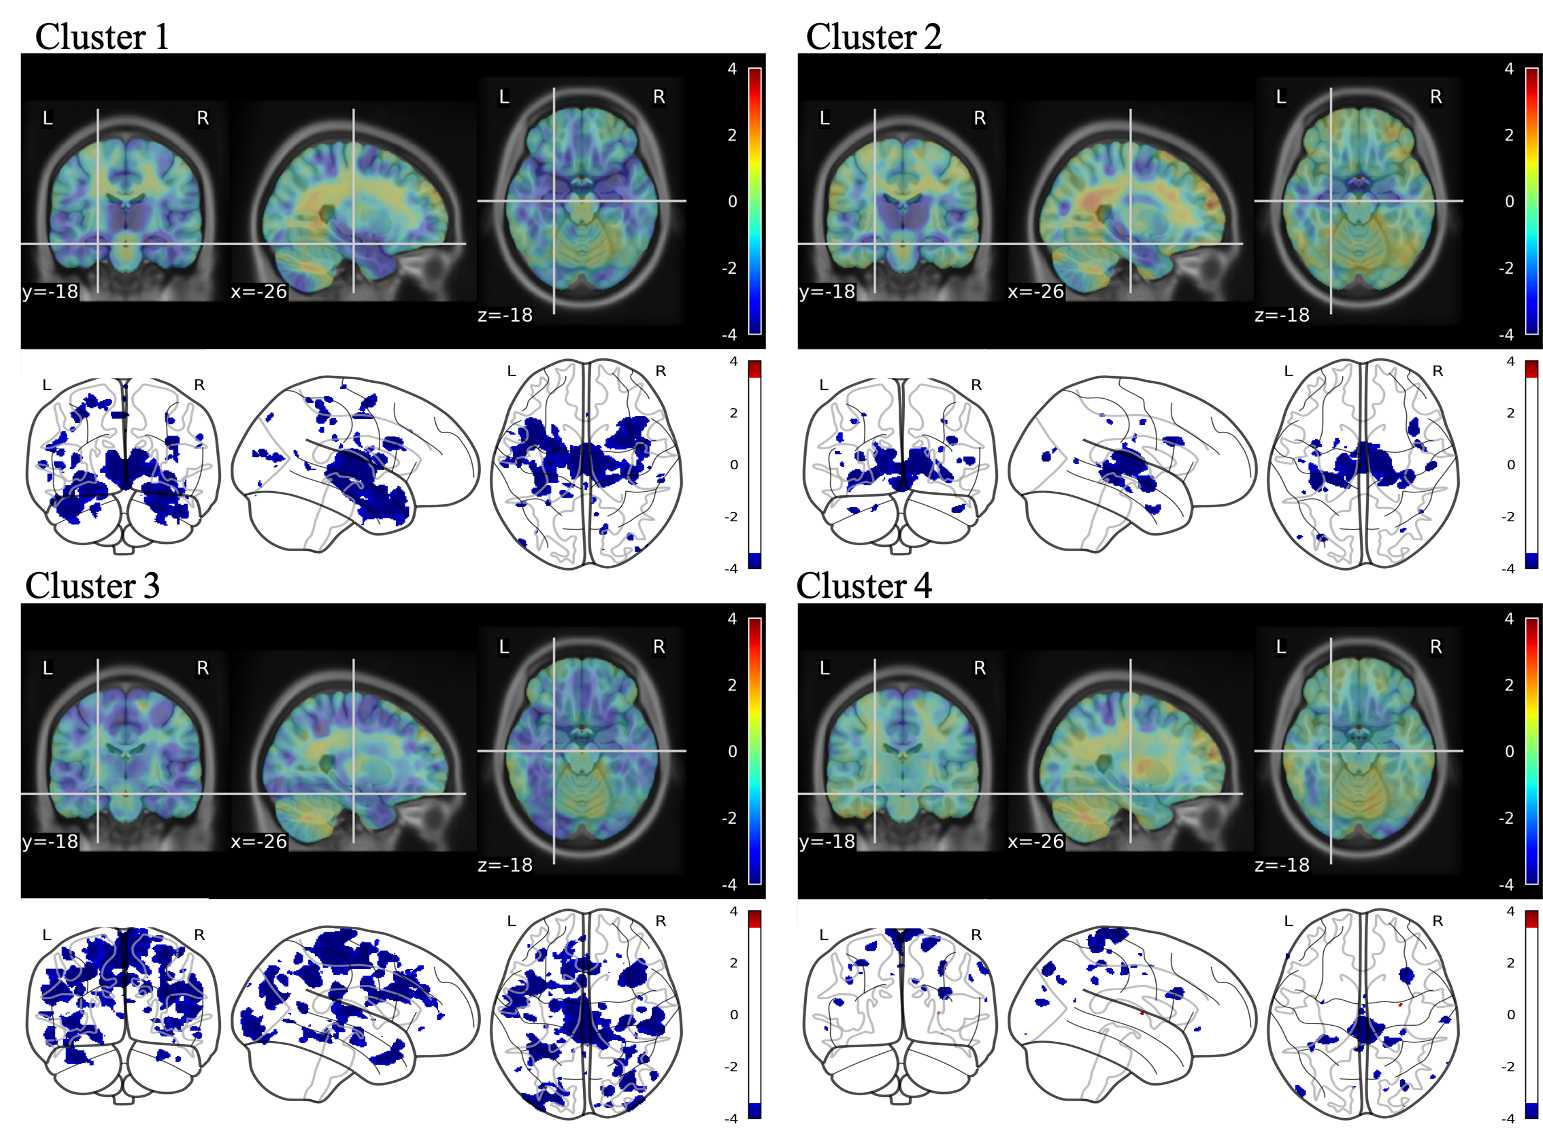
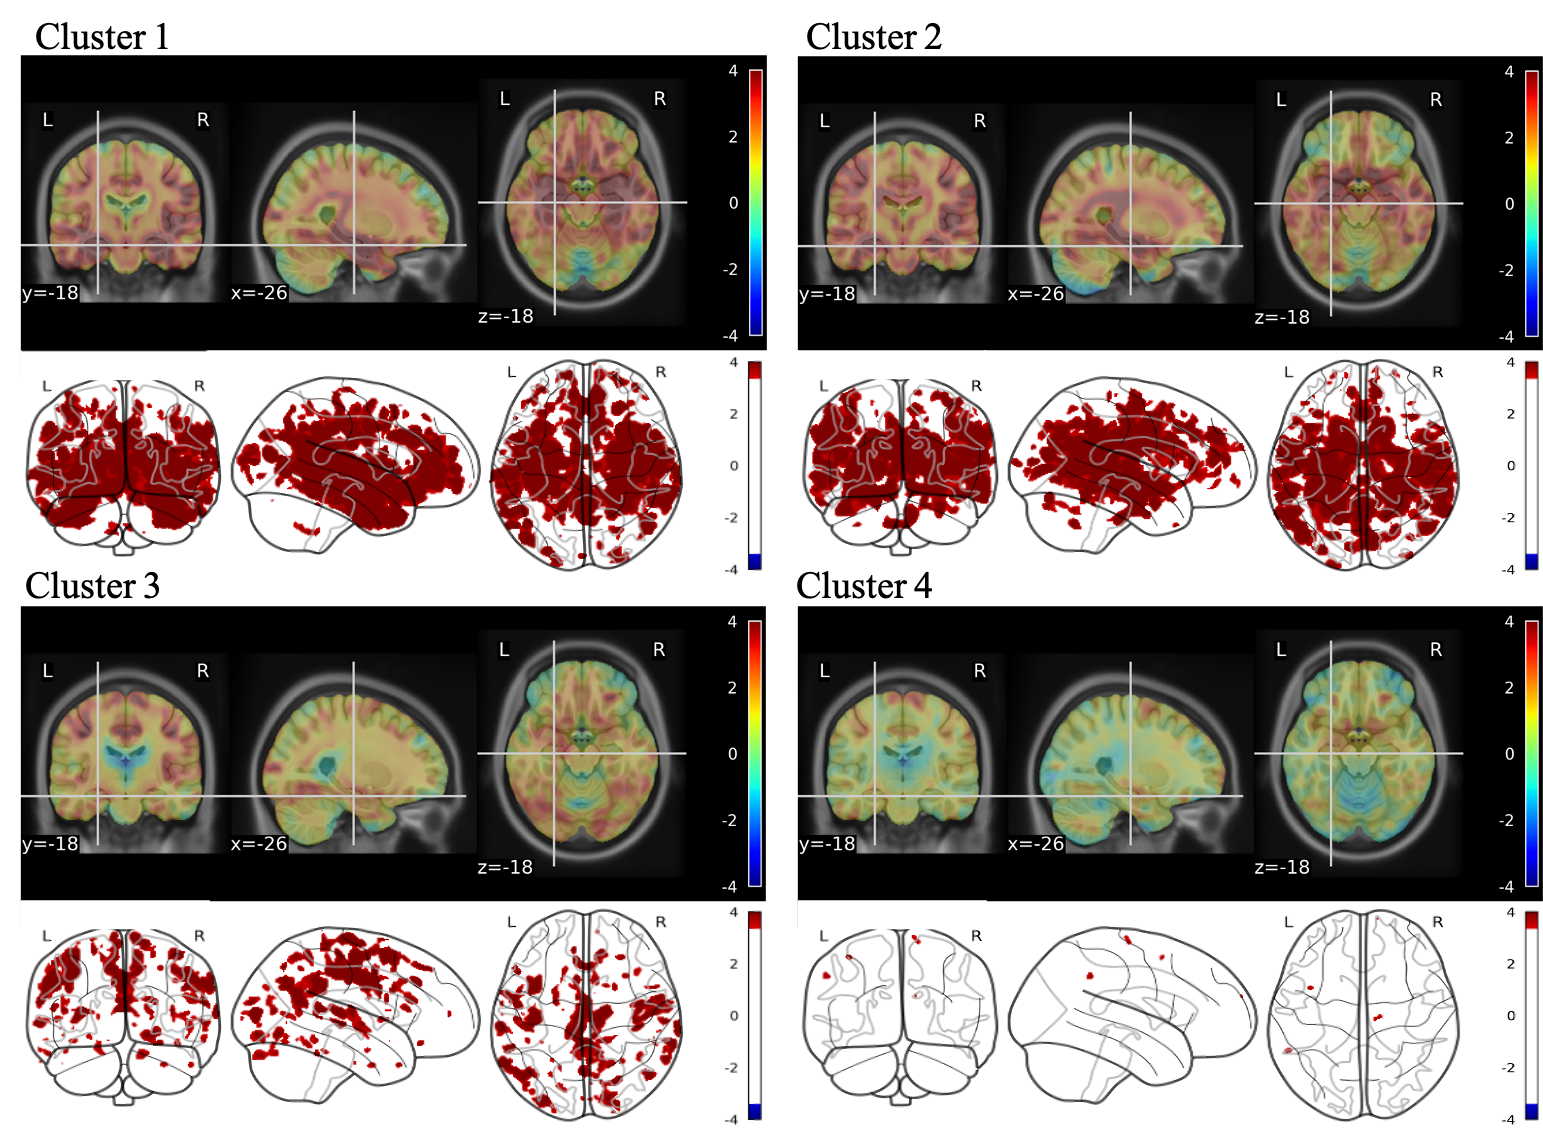
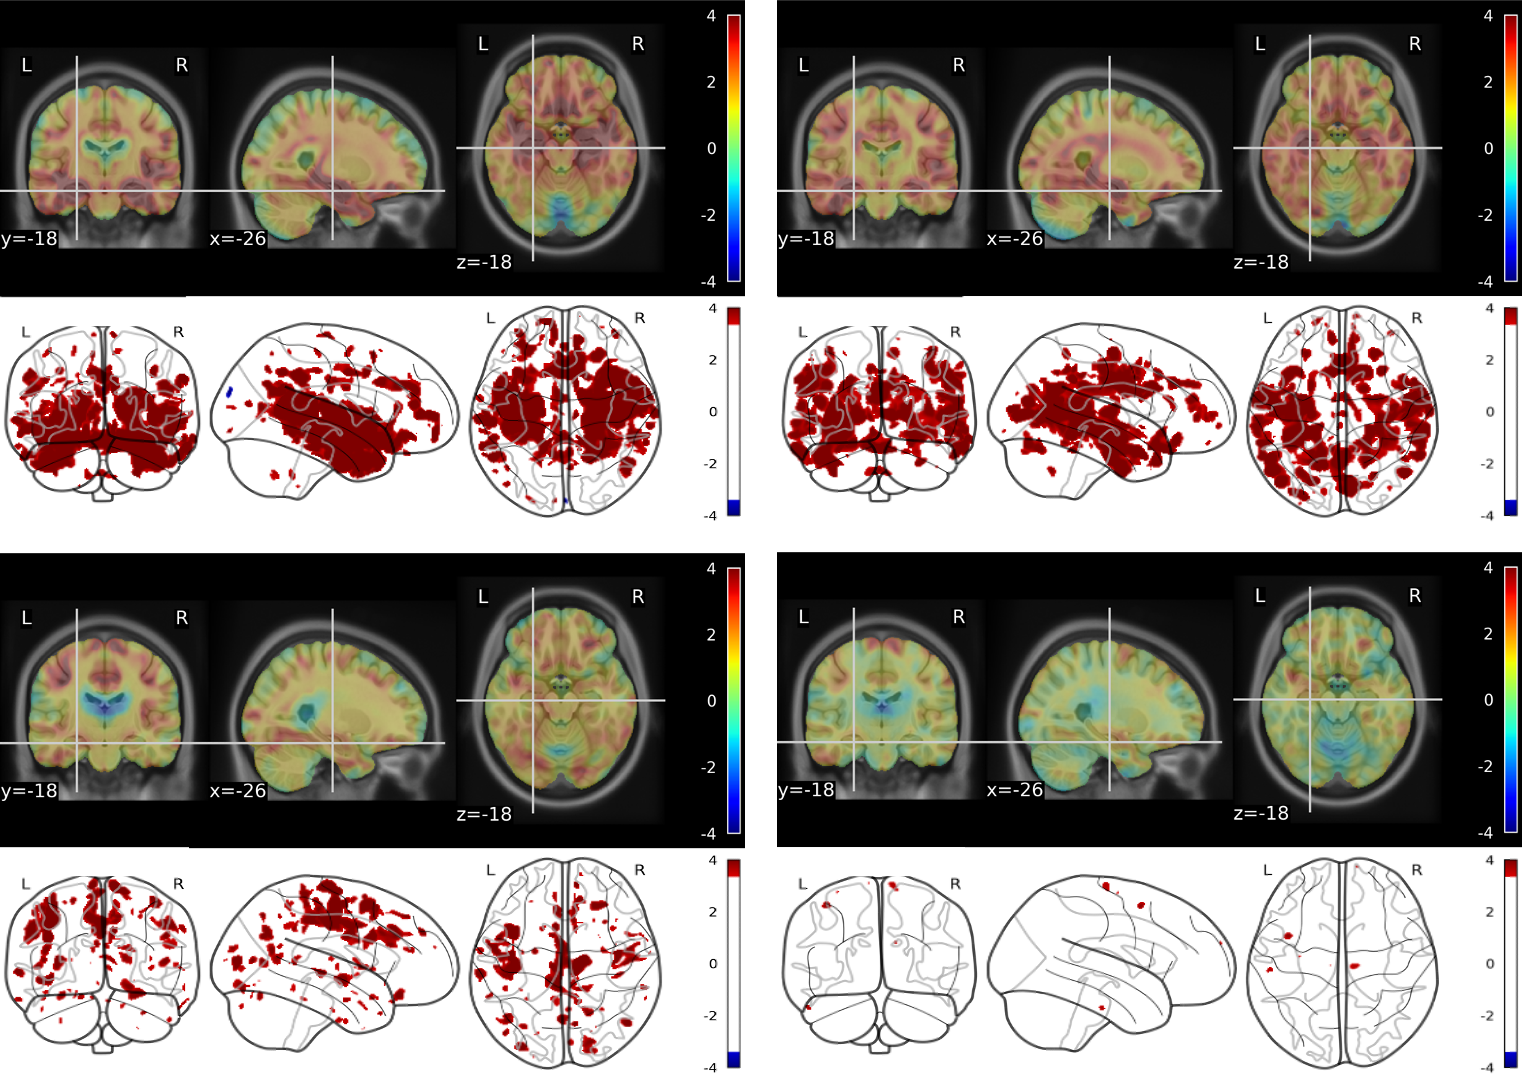
Unsupervised clustering identified 4 different clusters with different GM atrophy patterns. The results of the clusterization procedure applied on the gray matter structural measurements are shown on Figure 2 through the centroids of the obtained clusters: with respect to controls, cluster 1 shows widespread atrophy, cluster 2 atrophy limited to subcortical areas, cluster 3 atrophy limited to cortical areas, and cluster 4 no atrophy. Figure 3 shows the differences obtained by VBM analysis of the GM concentration between each cluster and the cohort of age-matched healthy subjects. In the glass brain representation a threshold of p-value< 0.001 (uncorrected) was applied. As expected from the ROI-based analysis, cluster 1 shows a significant decrease in GM concentration at subcortical and cortical level. Cluster 2 shows a decrease at subcortical level only, Cluster 3 shows a decrease at cortical level only, while cluster 4 shows very small scattered areas with diminished GM concentration.Figure 4 presents the comparisons in MRF-derived T1 quantification obtained by VBM between the same cohorts. The same applies for Figure 5 regarding MRF-derived T2 quantification.Both T1 and T2 MRF-derived maps showed statistically significant augmented values in the atrophic regions typically related to neurodegenerative patterns of MCI subjects.In general, provided the same level of atrophy with respect to an age-matched healthy population, T1 quantification shows more extended alterations in the brain with respect to T2 quantification even though the localization of the altered regions appears to be very similar. Further work will be focused on the study in this population of synthetic MRF-derived images as T1/T2-weighted ratio or directly the ratio T1/T2-quantitative ratio, considering its potential role as biomarker for myelin content and brain tissue integrity5,6.Conclusion
MRF-derived T1 and T2 maps are promising for the assessment of neurodegeneration in MCI condition and can show different levels of atrophy in a quantitative way.Acknowledgements
This work has been partially supported by the following fundings:CARIPLO 2015-0594 "A systematic molecular study of neuroimmune dysregulation in aging" Fondazione Pisa, 2016 “A translational study on inflammation and aging”Support from the Italian Ministry of Health via the RC 2022 and “5 per mille” to IRCCS Fondazione Stella Maris.References
1-Jiang Y, Ma D, Seiberlich N, Gulani V, Griswold MA. MR fingerprinting using fast imaging with steady state precession (FISP) with spiral readout. Magn Reson Med. 2015
2-Fischl B. FreeSurfer. Neuroimage. 2012
3-Avants BB, Tustison NJ, Stauffer M, Song G, Wu B, Gee JC. The Insight ToolKit image registration framework. Front Neuroinform. 2014
4-Ashburner J. A fast diffeomorphic image registration algorithm. Neuroimage. 2007
5-Pelkmans W, Dicks E, Barkhof F, Vrenken H, Scheltens P, van der Flier WM, Tijms BM. Gray matter T1-w/T2-w ratios are higher in Alzheimer's disease. Hum Brain Mapp. 2019
6-Lou B, Jiang Y, Li C, Wu PY, Li S, Qin B, Chen H, Wang R, Wu B, Chen M. Quantitative Analysis of Synthetic Magnetic Resonance Imaging in Alzheimer's Disease. Front Aging Neurosci. 2021
Figures