0429
Generating Synthetic MR Spectroscopic Imaging using MRI and Single-voxel MR Spectroscopy1Imaging Modality Group, Advanced Technology Research Department, Research and Development Center, Canon Medical Systems Corporation, Tochigi, Japan, 2Imaging Modality Group, Advanced Technology Research Department, Research and Development Center, Canon Medical Systems Corporation, Kanagawa, Japan
Synopsis
Keywords: Machine Learning/Artificial Intelligence, Spectroscopy
The authors proposed new methods to generate synthetic proton MR spectroscopic imaging (MRSI) data. The proposed methods were derived from Image-to-Image Translation with Conditional Adversarial Networks (pix2pix), taking MRI data or MRI and single-voxel MR spectroscopy (SVS) data as inputs. To integrate the features of MRI and SVS data, additional encoder and decoder networks were incorporated. The experimental results demonstrated that the proposed methods generated metabolite ratio maps with same resolution as MRI data. The synthetic maps generated from MRI+SVS were more consistent with the reference ones than those generated from MRI alone.Introduction
MR spectroscopic imaging (MRSI) can provide metabolic heterogeneity by mapping the spatial distribution of metabolites using a larger volume of interest than single-voxel MR spectroscopy (SVS)1. Additionally, since it remains challenging to acquire high-resolution MRSI (i.e., $$$≥$$$64$$$\times$$$64 in-plane matrix with a nominal voxel size of 3.4$$$\times$$$3.4 mm2), the acquisition is usually performed with low-resolution in clinical practice2, 3.This study aimed to generate synthetic proton MRSI data with the same spatial resolution as MRI data. To the best of the authors’ knowledge, there are no studies that have generated synthetic MRSI data. A few attempts have been made to generate synthetic training data of SVS for machine learning applications4, 5.
Methods
The proposed methods were derived from Image-to-Image Translation with Conditional Adversarial Networks (pix2pix)6. The pix2pix consists of a generator, an image-to-image network, and a discriminator, which is an image-to-label network. The proposed methods had two types of models, which took either paired MRI and SVS data (Figure 1a, generation from MRI+SVS) or MRI data alone (Figure 1b, generation from MRI). In the generation from MRI+SVS, the model consists of two encoders, a decoder, and a generator. The decoder upsampled the feature maps extracted from the cropped MRI and SVS data to match the size of the MRI data. The generator, which was based on U-Net7, took paired MRI data and outputs of the decoder as inputs in the generation from MRI+SVS, whereas it took MRI data as inputs in the generation from MRI. The generator provided synthetic maps with a matrix of 128$$$\times$$$128. The generated maps were then downsampled using the average pooling to match the size of the 4$$$\times$$$4 low-resolution reference labels. The discriminator took paired MRI data and their corresponding low-resolution reference/synthetic labels as inputs, classifying the inputs as reference or synthetic (Figure 1c). To prevent the discriminator from overfitting, two-sided label smoothing8 was applied.The weighted loss function of total variation loss9, adversarial loss6, and L1 loss6 was used with weightings set to 0.05, 1, and 5, respectively. The total variation loss worked as a regularizing factor to impose spatial smoothness on the generated data. The models were trained with an Adam optimizer for 100 epochs, with learning rates of all networks of 0.0001 and a mini-batch size of 8. A total of 28 volunteers (968 image pairs) were used for training and 8 volunteers (256 image pairs) were used for validation. Data augmentation was performed by flipping the data about the horizontal axes.
A total of 36 healthy volunteers (31 males, 5 females, 22–55 years) were scanned using a 3T MRI scanner (Vantage Galan 3T, Canon Medical Systems Corporation) with a 12-channel receiver head neck coil (Canon Medical Systems Corporation) under the approval of Institutional Review Board (IRB). The T1-weighted, T2-weighted, MRSI, and SVS data were acquired (Figure 2). Specifically, the SVS acquisition was performed 1–6 times in different regions inside the volume of interest of the MRSI. The MR acquisition parameters are listed in Figure 3.
The concentrations of the five major metabolites, i.e., tCho (glycerophosphocholine+phosphocholine), tCr (creatine+phosphocreatine), tNAA (N-acetylaspartate+N-acetylaspartylglutamate), Glx (glutamate+glutamine), and Ins (myo-inositol) were quantified using LCModel version 6.310. The eight metabolite ratios of tCho/tCr, tCho/tNAA, Glx/tCr, Glx/tNAA, Ins/tCr, Ins/tNAA, tNAA/tCr, and tCr/tNAA were calculated. To quantitatively evaluate the synthetic maps, the mean squared error (MSE) of the low-resolution synthetic labels against the reference ones were calculated. The Wilcoxon signed-rank test was performed on MSE. A p value less than 0.001 was considered to indicate statistical significance.
Results
Figure 4 shows a comparison of the synthetic maps of metabolite ratios generated from MRI, generated from MRI+SVS, and low-resolution reference labels. Figure 5 shows a comparison of the median and interquartile range (IQR) of the MSE between the low-resolution synthetic labels generated from MRI and those generated from MRI+SVS. The Wilcoxon signed-rank test revealed a significant difference between the synthetic labels for tCho/tCr, tCho/tNAA, Glx/tCr, Glx/tNAA, and tNAA/tCr generated from MRI and those generated from MRI+SVS (p < 0.001).Discussion
The authors proposed novel methods based on pix2pix to generate synthetic MRSI data. The experimental results demonstrated that the proposed methods successfully generated synthetic maps of metabolite ratios using MRI and SVS data. Qualitatively, the synthetic maps generated from MRI+SVS were more similar to the reference ones than those generated from MRI. The low-resolution synthetic labels generated from MRI+SVS yielded significantly lower MSE than those generated from MRI alone, indicating that the synthetic labels generated from MRI+SVS were more consistent with the reference ones.Conclusion
The proposed methods generated synthetic MRSI data with the same spatial resolution as MRI data.Acknowledgements
No acknowledgments were found.
References
1. Hangel G, Cadrien C, Lazen P, Furtner J, Lipka A, Hečková E, Hingerl L, Motyka S, Gruber S, Strasser B, Kiesel B, Mischkulnig M, Preusser M, Roetzer T, Wöhrer A, Widhalm G, Rössler K, Trattnig S, Bogner W. High-resolution metabolic imaging of high-grade gliomas using 7T-CRT-FID-MRSI. NeuroImage Clin. 2020; 28: 102433.
2. Klauser A, Strasser B, Thapa B, Lazeyras F, Andronesi O. Achieving high-resolution MRSI of the human brain with compressed-sensing and low-rank reconstruction at 7 Tesla. J Magn Reason. 2021; 331: 107048.
3. Hingerl L, Strasser B, Moser P, Hangel G, Motyka S, Heckova E, Gruber S, Trattnig S, Bogner W. Clinical high-resolution 3D-MR spectroscopic imaging of the human brain at 7 T. Invest Radiol. 2020; 55: 239–248.
4. Olliverre NJ, Yang G, Slabaugh G, Reyes-Aldasoro CC, Alonso E. Generating magnetic resonance spectroscopy imaging data of brain tumours from linear, non-linear and deep learning models. In: Proceedings of International Workshop on Simulation and Synthesis in Medical Imaging, Strasbourg, France, 2018. pp 130–138.
5. Jang J, Lee HH, Park JA, Kim H. Unsupervised anomaly detection using generative adversarial networks in 1H-MRS of the brain. J Magn Reason. 2021; 325: 106936.
6. Isola P, Zhu J-Y, Zhou T, Efros AA. Image-to-image translation with conditional adversarial networks. In: Proceedings of IEEE Conference on Computer Vision and Pattern Recognition, Honolulu, USA, 2017. pp 5967–5976.
7. Ronneberger O, Fischer P, Brox T. U-net: convolutional networks for biomedical image segmentation. In: Proceedings of International Conference on Medical Image Computing and Computer-Assisted Intervention, Munich, Germany, 2015. pp 234–241.
8. Salimans, T, Goodfellow I, Zaremba W, Cheung V, Radford A, Chen X. Improved techniques for training GANs. In: Proceedings of In Advances in Neural Information Processing Systems, Barcelona, Spain, 2016. pp 2234–2242.
9. Johnson J, Alahi A, Fei-Fei L. Perceptual losses for real-time style transfer and super-resolution. In: Proceedings of European Conference on Computer Vision, Amsterdam, The Netherlands, 2016. pp 694–711.
10. Provencher SW. Estimation of metabolite concentrations from localized in vivo proton NMR spectra. Magn Reson Med. 1993; 30: 672–679.
Figures
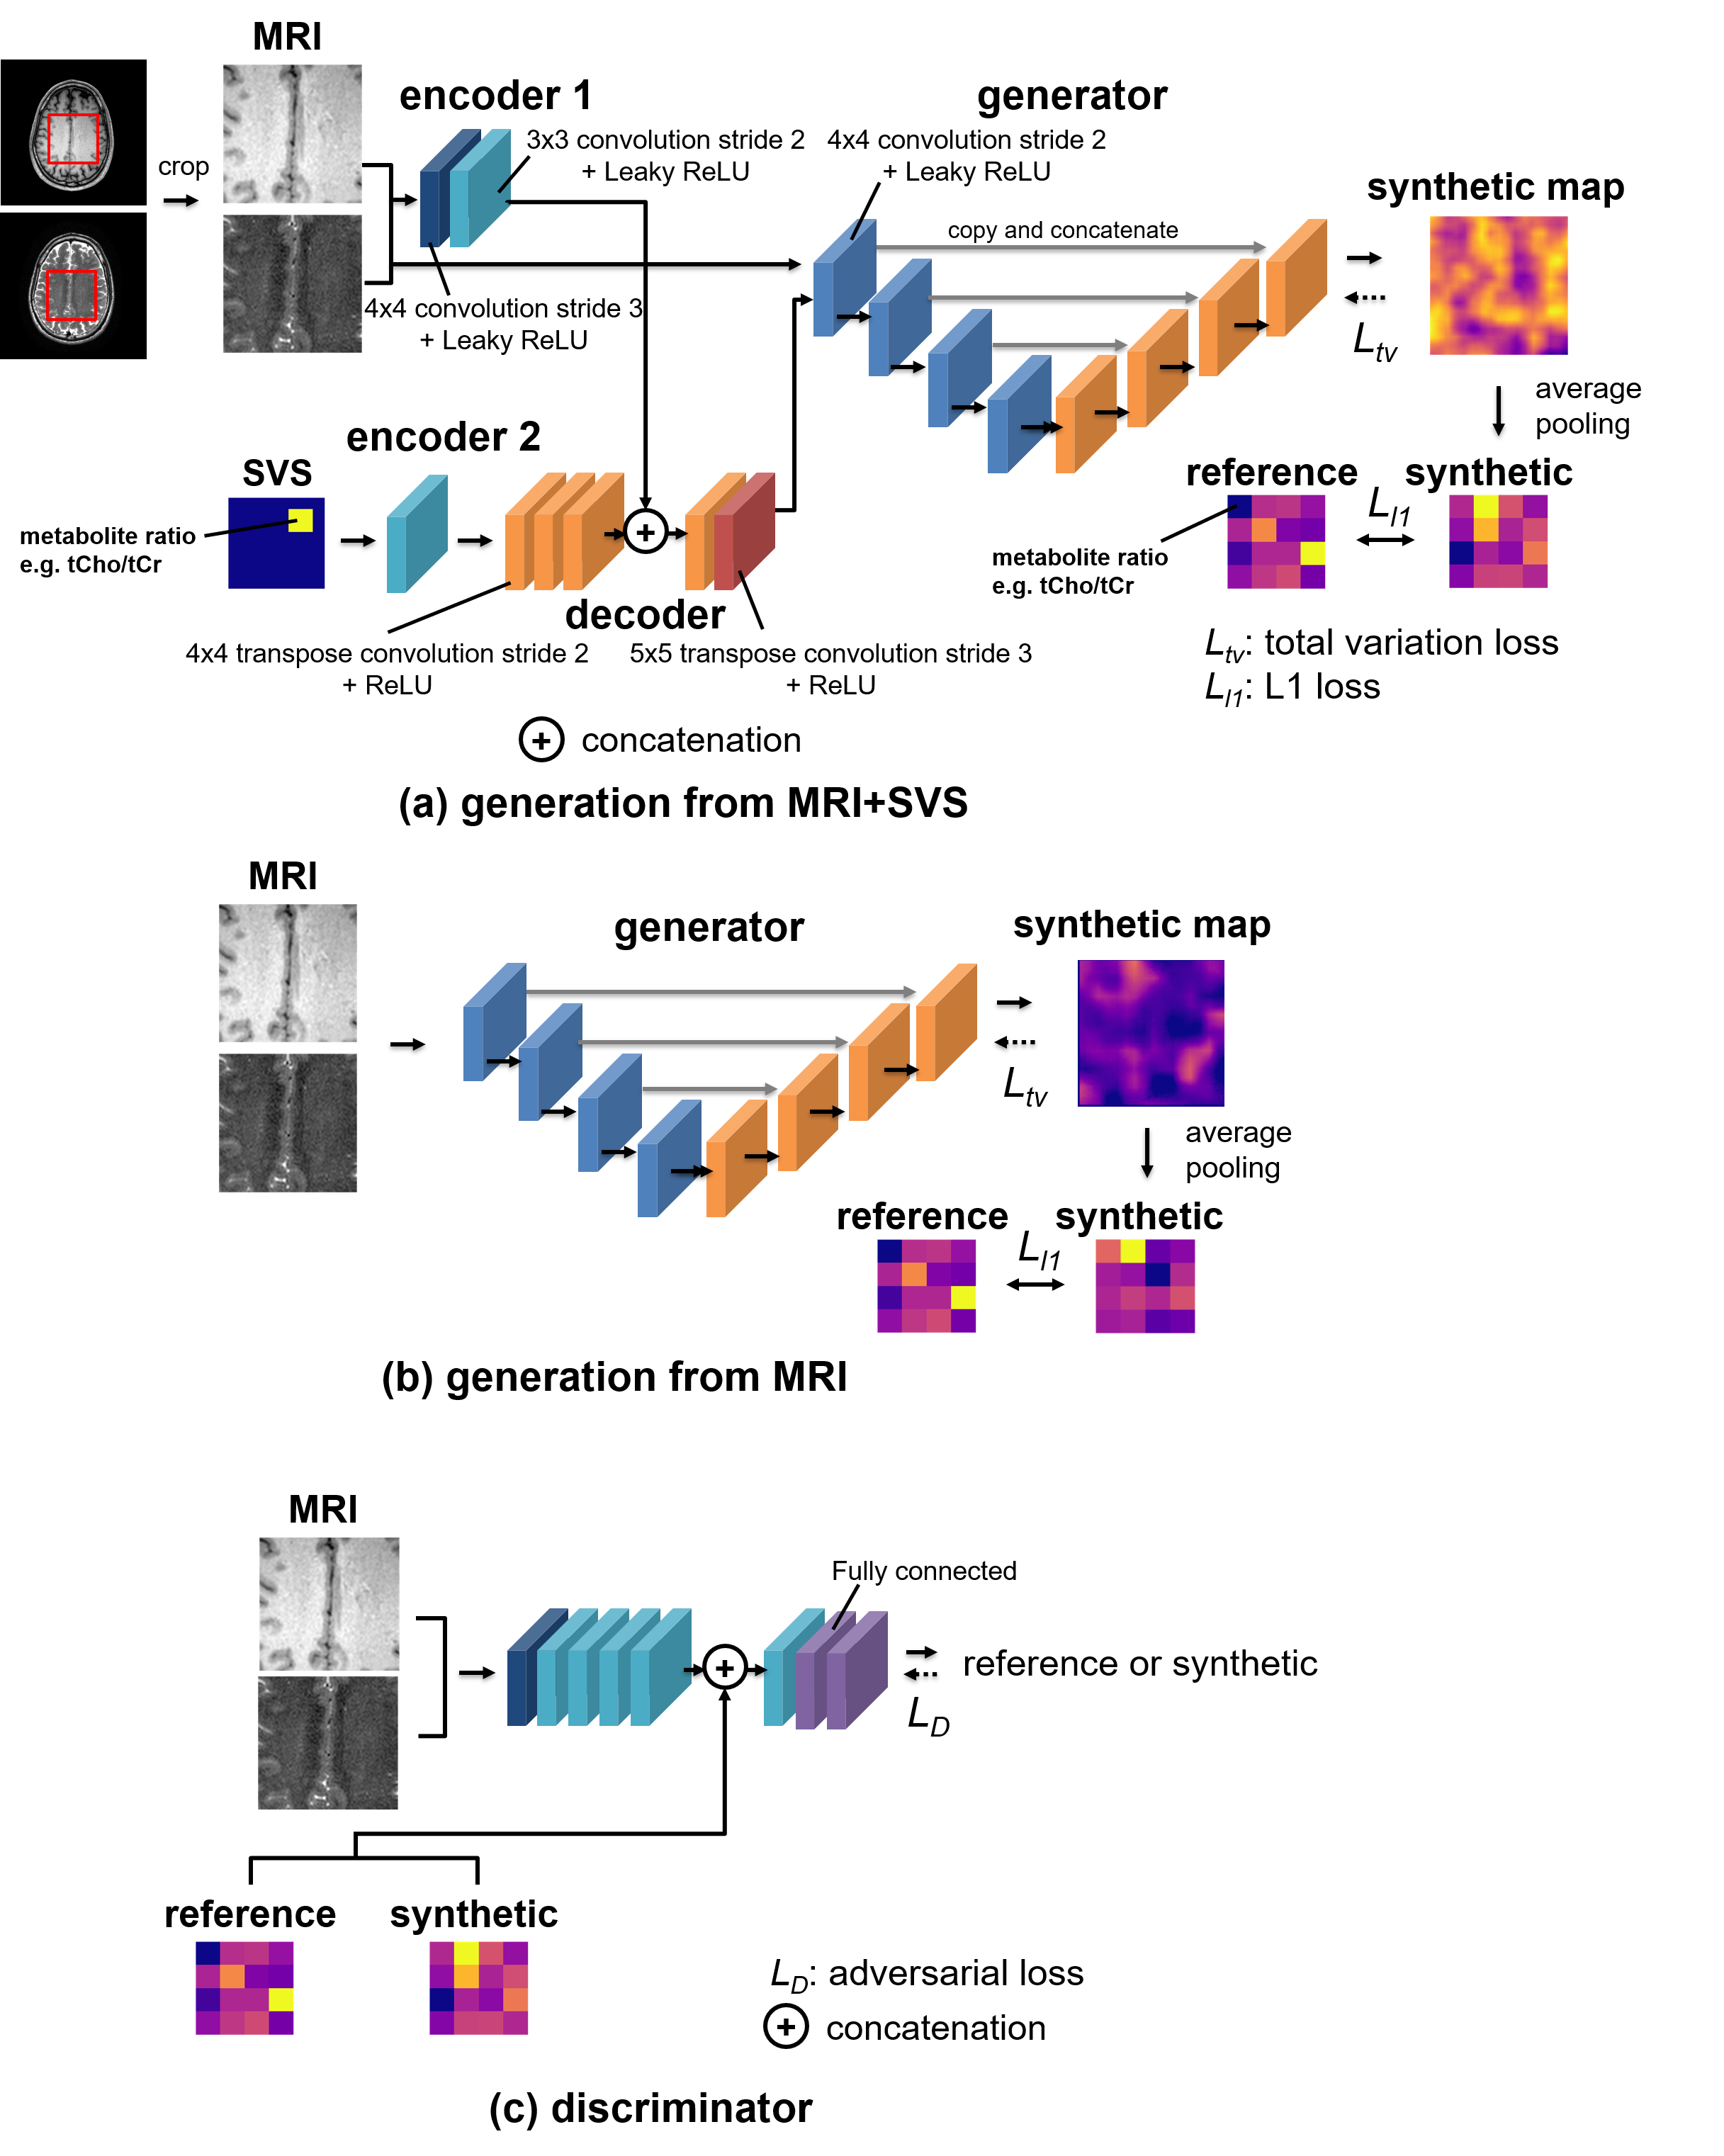
Figure 1. Network designs of the proposed models.
(a) The model consists of two encoders (encoder 1: 428 parameters, encoder 2: 80 parameters), a decoder (66,684 parameters), and a generator (6,231,425 parameters). The generator, which is based on U-Net, took MRI data and outputs of the decoder in the generation from MRI+SVS, providing synthetic maps. (b) The generator took MRI data, providing synthetic maps. (c) The discriminator (24,111,041 params) received MRI data and labels, trying to distinguish the reference labels from the synthetic ones. ReLU, rectified linear unit.
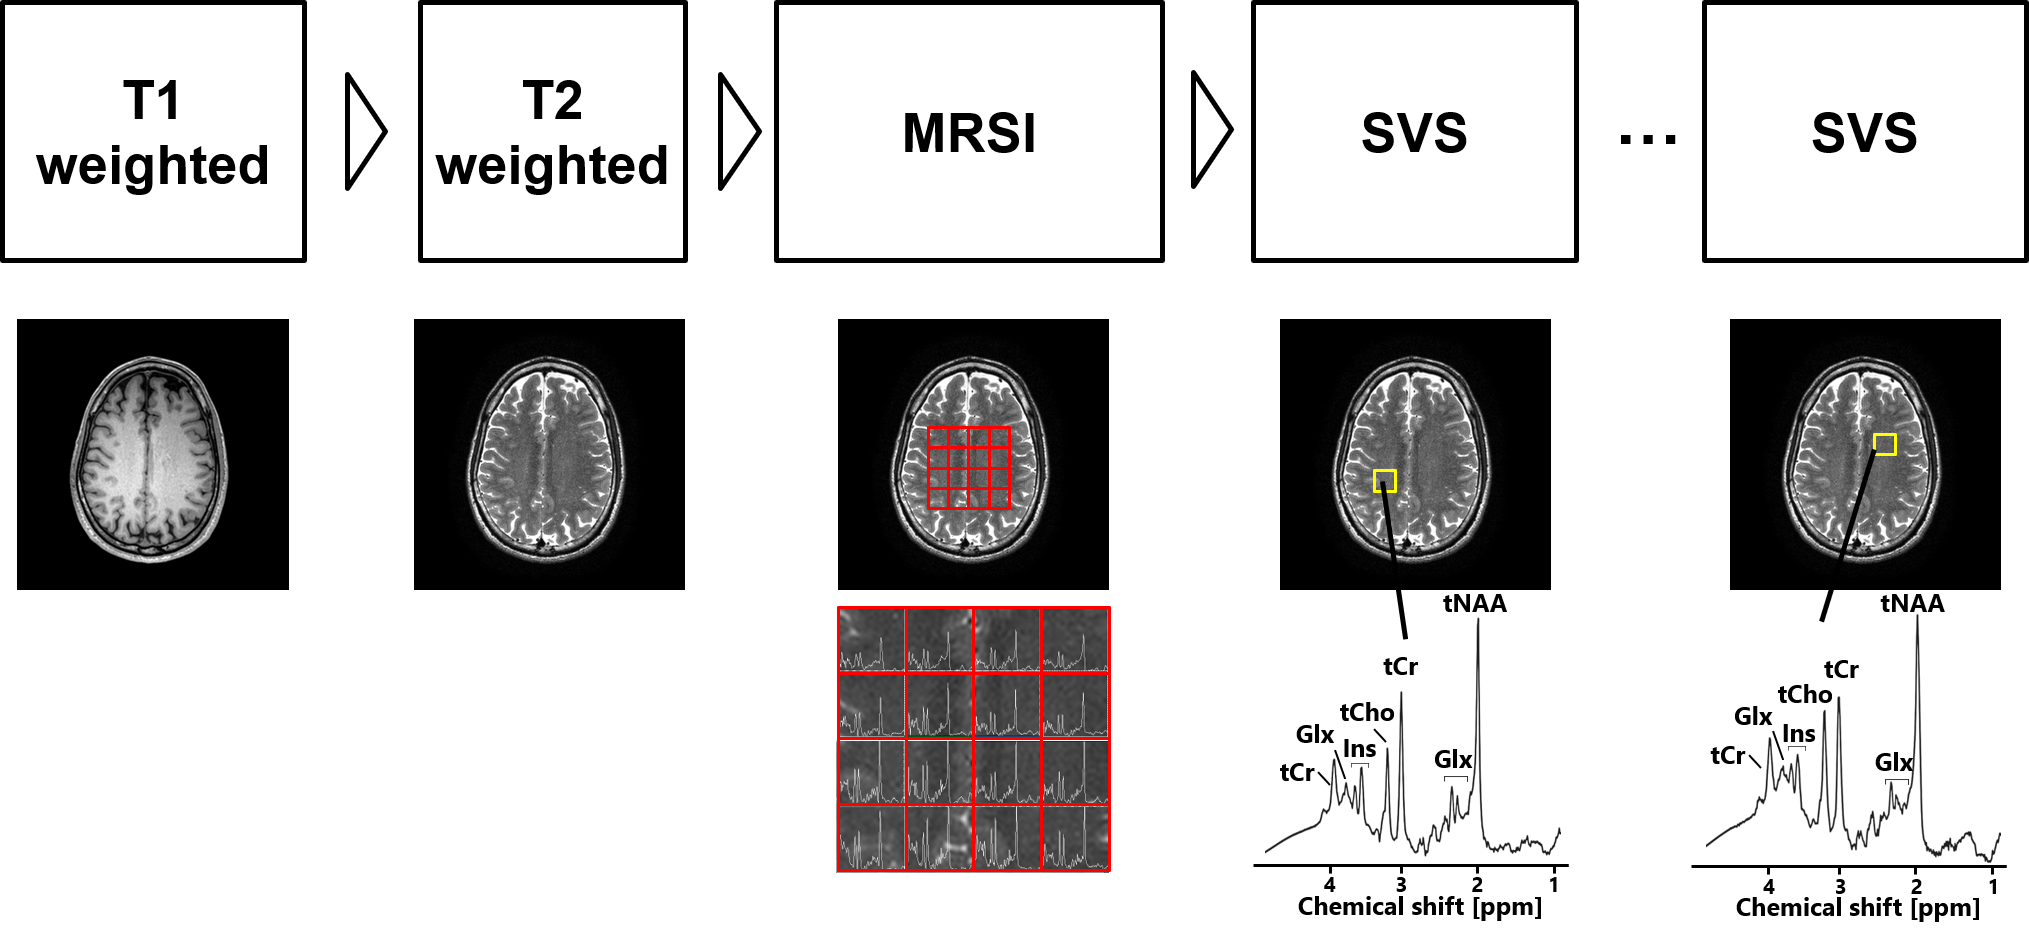
Figure 2. Acquisition protocol of MRI, MR spectroscopic imaging (MRSI), and single-voxel MR spectroscopy (SVS).
The T1-weighted, T2-weighted, MRSI, and SVS data were acquired. Specifically, the SVS acquisition was performed 1–6 times in different regions (yellow) inside the volume of interest of the MRSI (red). The volume of interest is superimposed on the T2 weighted image. tCho, glycerophosphocholine+phosphocholine; tCr, creatine+phosphocreatine; tNAA, N-acetylaspartate+N-acetylaspartylglutamate; Glx, glutamate+glutamine; Ins, myo-inositol.
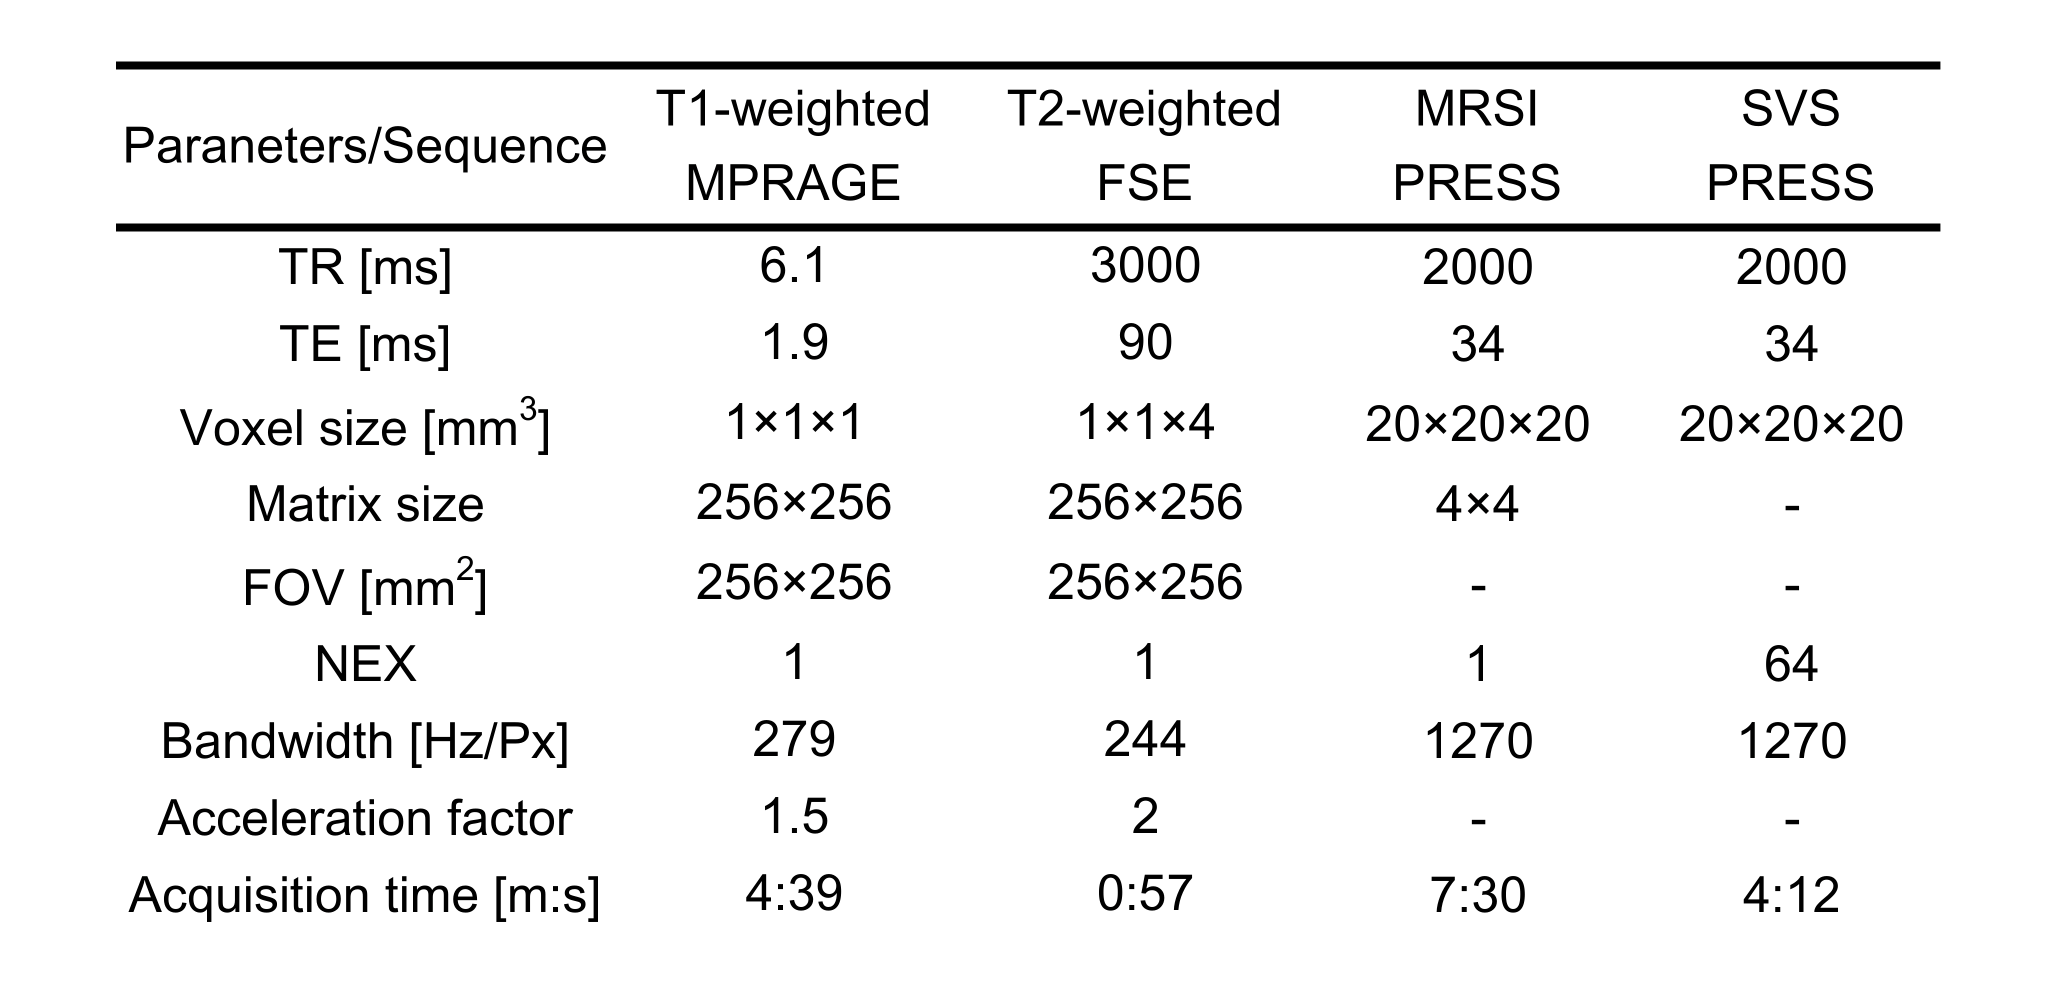
Figure 3. MR acquisition parameters.
TR, repetition time; TE, echo time; FOV, field of view; NEX, number of excitations; MPRAGE, magnetization prepared rapid acquisition gradient echo; FSE, fast spin echo; PRESS, point resolved spectroscopy.
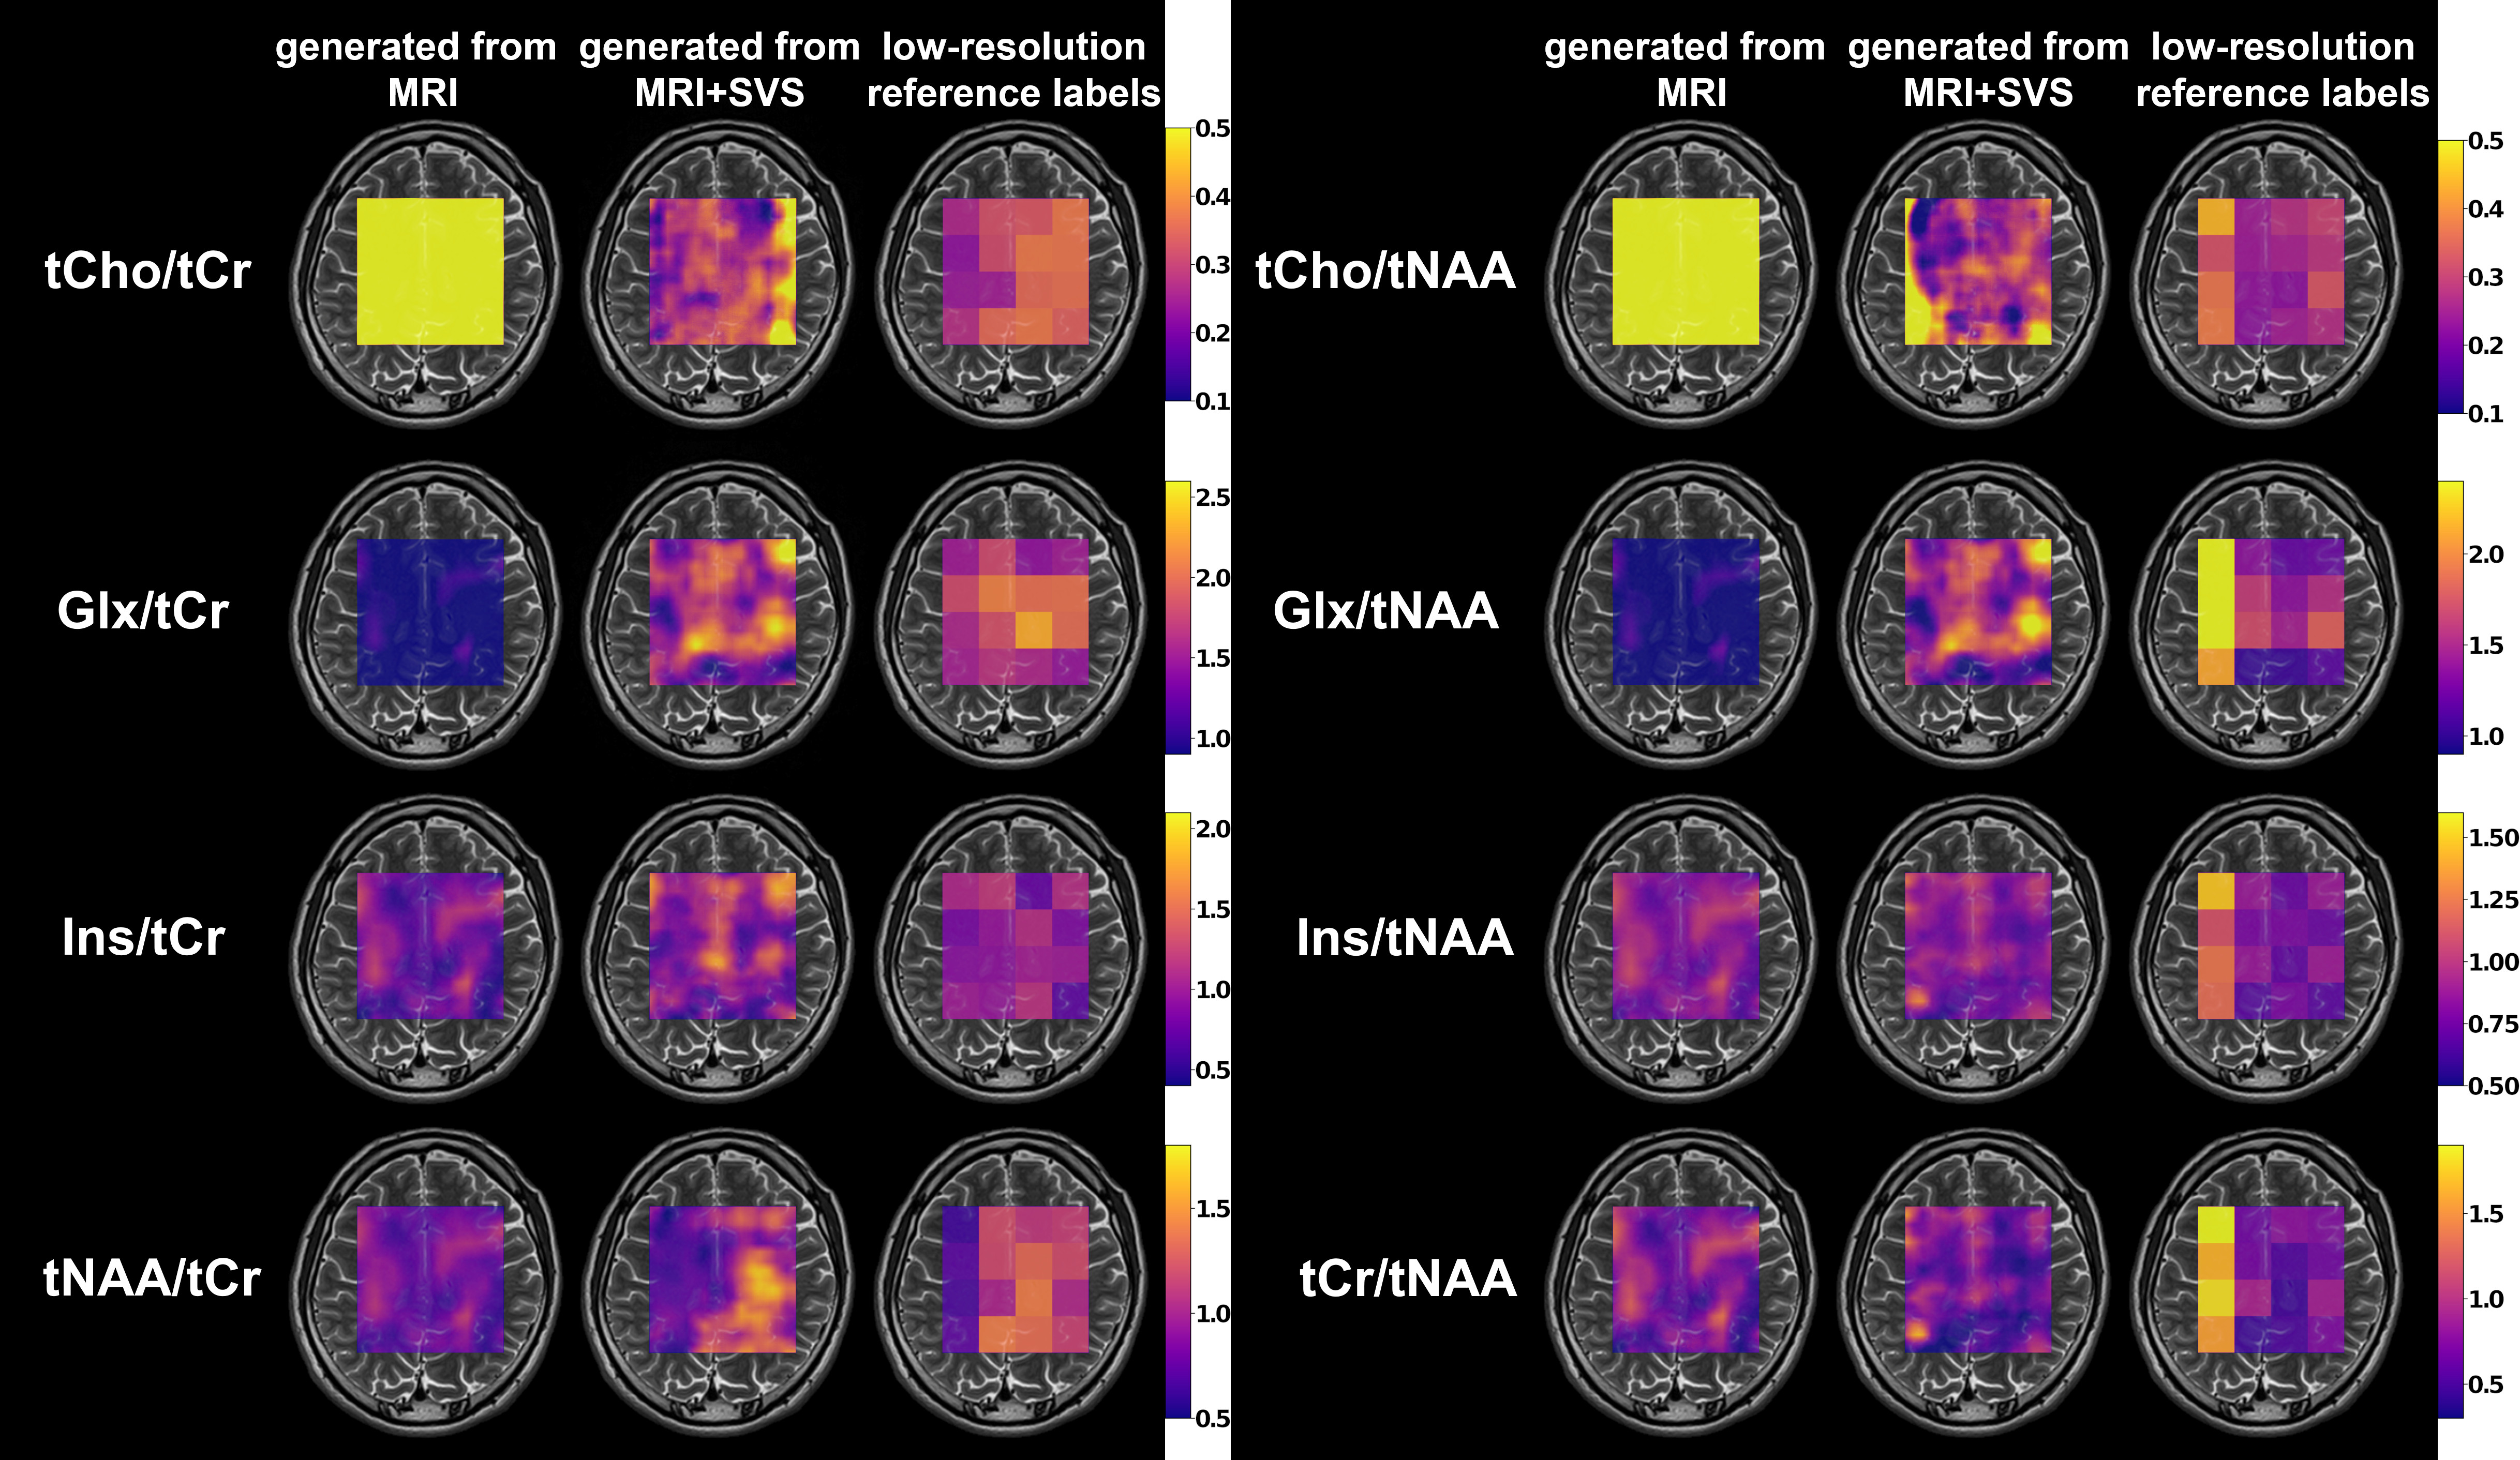
Figure 4. Comparison of the synthetic maps of metabolite ratios generated from MRI, generated from MRI+SVS, and low-resolution reference labels.
The synthetic maps and reference labels with a matrix of 128$$$\times$$$128 were superimposed on the T2 weighted image. The labels were upsampled using zero-order interpolation. The color scale indicates the metabolite ratio value and ranges from blue (lowest signal intensity) to yellow (highest signal intensity).
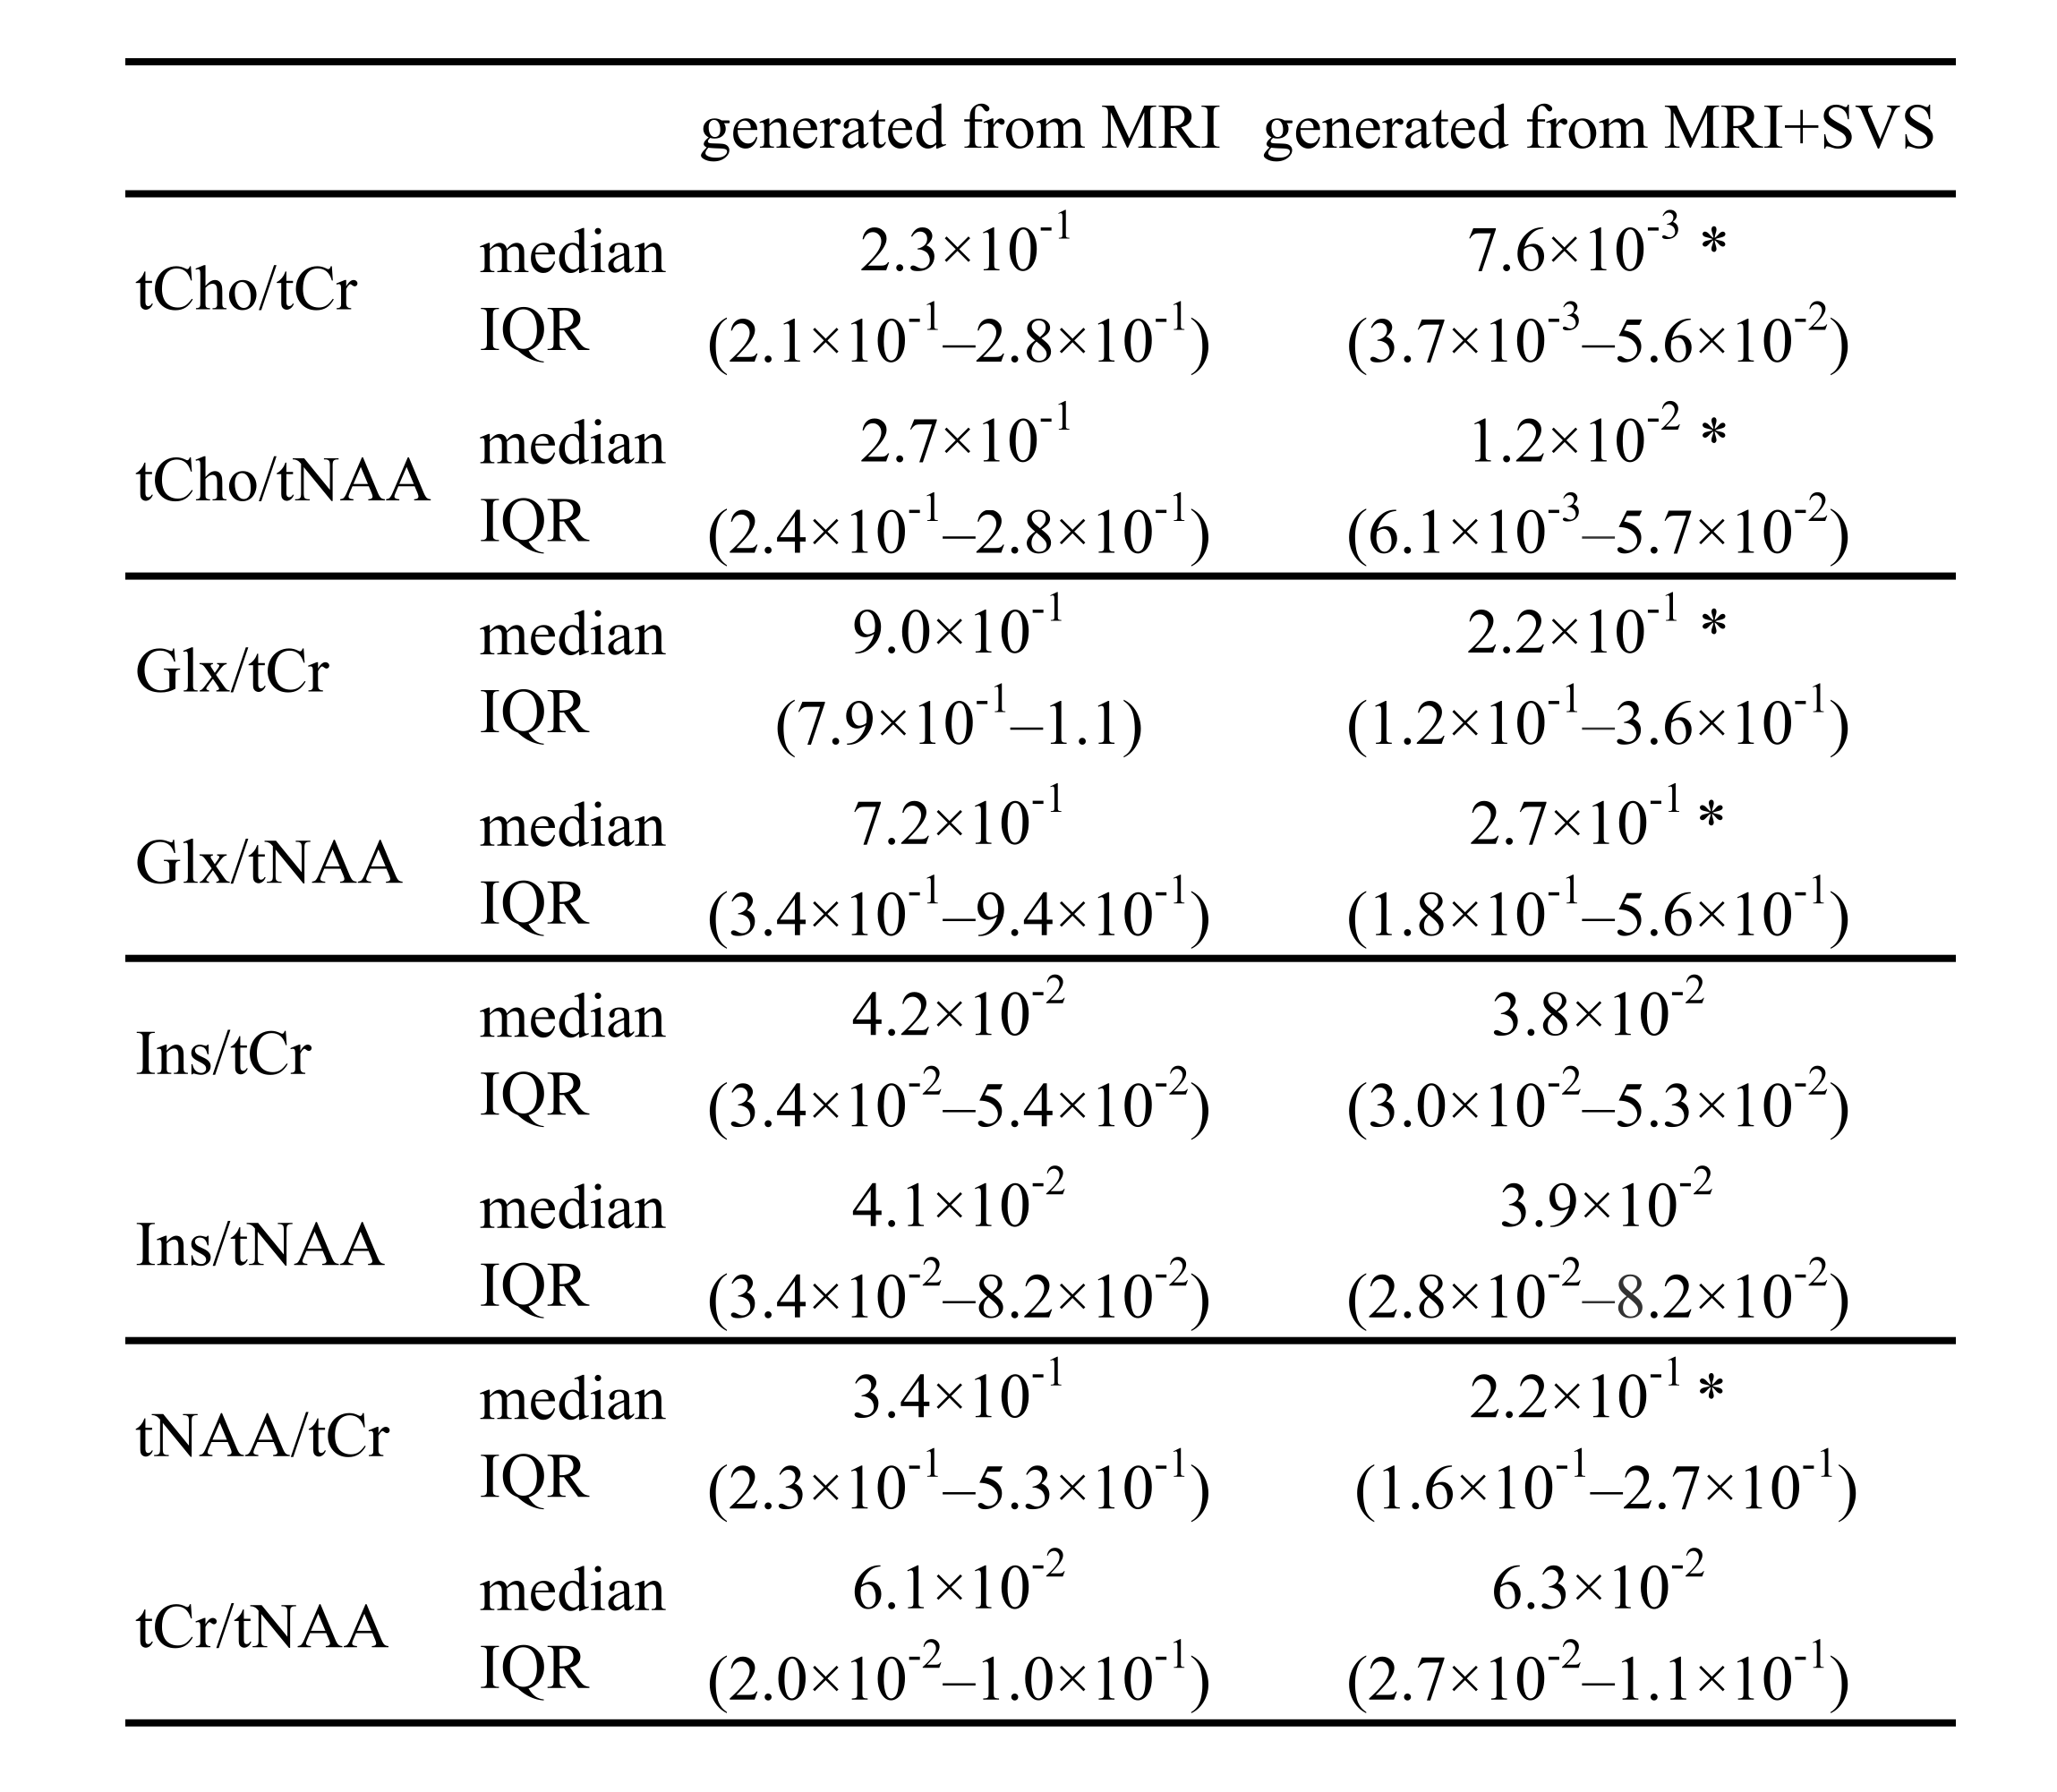
Figure 5. Comparison of the median and interquartile range (IQR) of the mean squared error (MSE) between the low-resolution synthetic labels generated from MRI and those generated from MRI+SVS.
Asterisks indicate significance level of the Wilcoxon signed-rank test (*: p < 0.001). tCho, glycerophosphocholine + phosphocholine; tCr, creatine+phosphocreatine; tNAA, N-acetylaspartate+N-acetylaspartylglutamate; Glx, glutamate+glutamine; Ins, myo-inositol.