0426
Simultaneous Quantification of Relaxation and Diffusion using MR Fingerprinting with Self-Calibrated Subspace Reconstruction1Biomedical Engineering, Case Western Reserve University, Cleveland, OH, United States, 2Imaging Institute, Cleveland Clinic, Cleveland, OH, United States, 3Radiology, Case Western Reserve University, Cleveland, OH, United States, 4Cardiff University Brain Research Imaging Centre (CUBRIC), School of Psychology, Cardiff University, Cardiff, United Kingdom
Synopsis
Keywords: MR Fingerprinting/Synthetic MR, Diffusion/other diffusion imaging techniques
We propose a self-calibrated subspace reconstruction method for multidimensional MR Fingerprinting (mdMRF) scan for simultaneous relaxation and diffusion mapping without pulsation gating. It is distortion-free, unlike EPI-based diffusion MRI. MRF images corrupted by phase errors due to bulk and physiological motions are automatically detected using an outlier detection algorithm and corrected, in order to generate artifact-free relaxation and diffusion maps.Introduction
MR Fingerprinting (MRF) [1] is a fast quantitative imaging technique for simultaneous multi-parameter mapping. Previously, a multidimensional MRF (mdMRF) framework was developed for joint relaxation-diffusion quantification [2], which enables reliable quantification of compartment-specific microstructural properties. Because mdMRF employs diffusion-prepared SSFP readouts [3-5], eddy currents or motion (bulk or physiological) induced phase errors could affect image magnitude and phase, resulting in shading artifacts in the maps. To reduce shading artifacts caused by signal dropouts and phase variations due to brain pulsation during diffusion encodings, peripheral pulsation gating was used. However, the optimal delay time from the pulse peak is subject-dependent, which greatly limits method robustness and result quality. This is further complicated by additional physiologic motions, such as cerebrospinal fluid pulsation and bulk motion, besides cardiac pulsation. There are also scan efficiency reduction due to irregular cardiac cycles, and reconstruction issues when extended to 3D because of shot-to-shot timing inconsistency. Here, we propose to address the shading artifacts in mdMRF without pulsation gating using a self-calibrated subspace reconstruction method. Aliasing-free high-resolution images can be accurately reconstructed, such that the corrupted segments (or images) can be detected by a customized outlier detection algorithm, and finally corrected (excluded) to achieve artifact-free relaxation and diffusion maps.Method
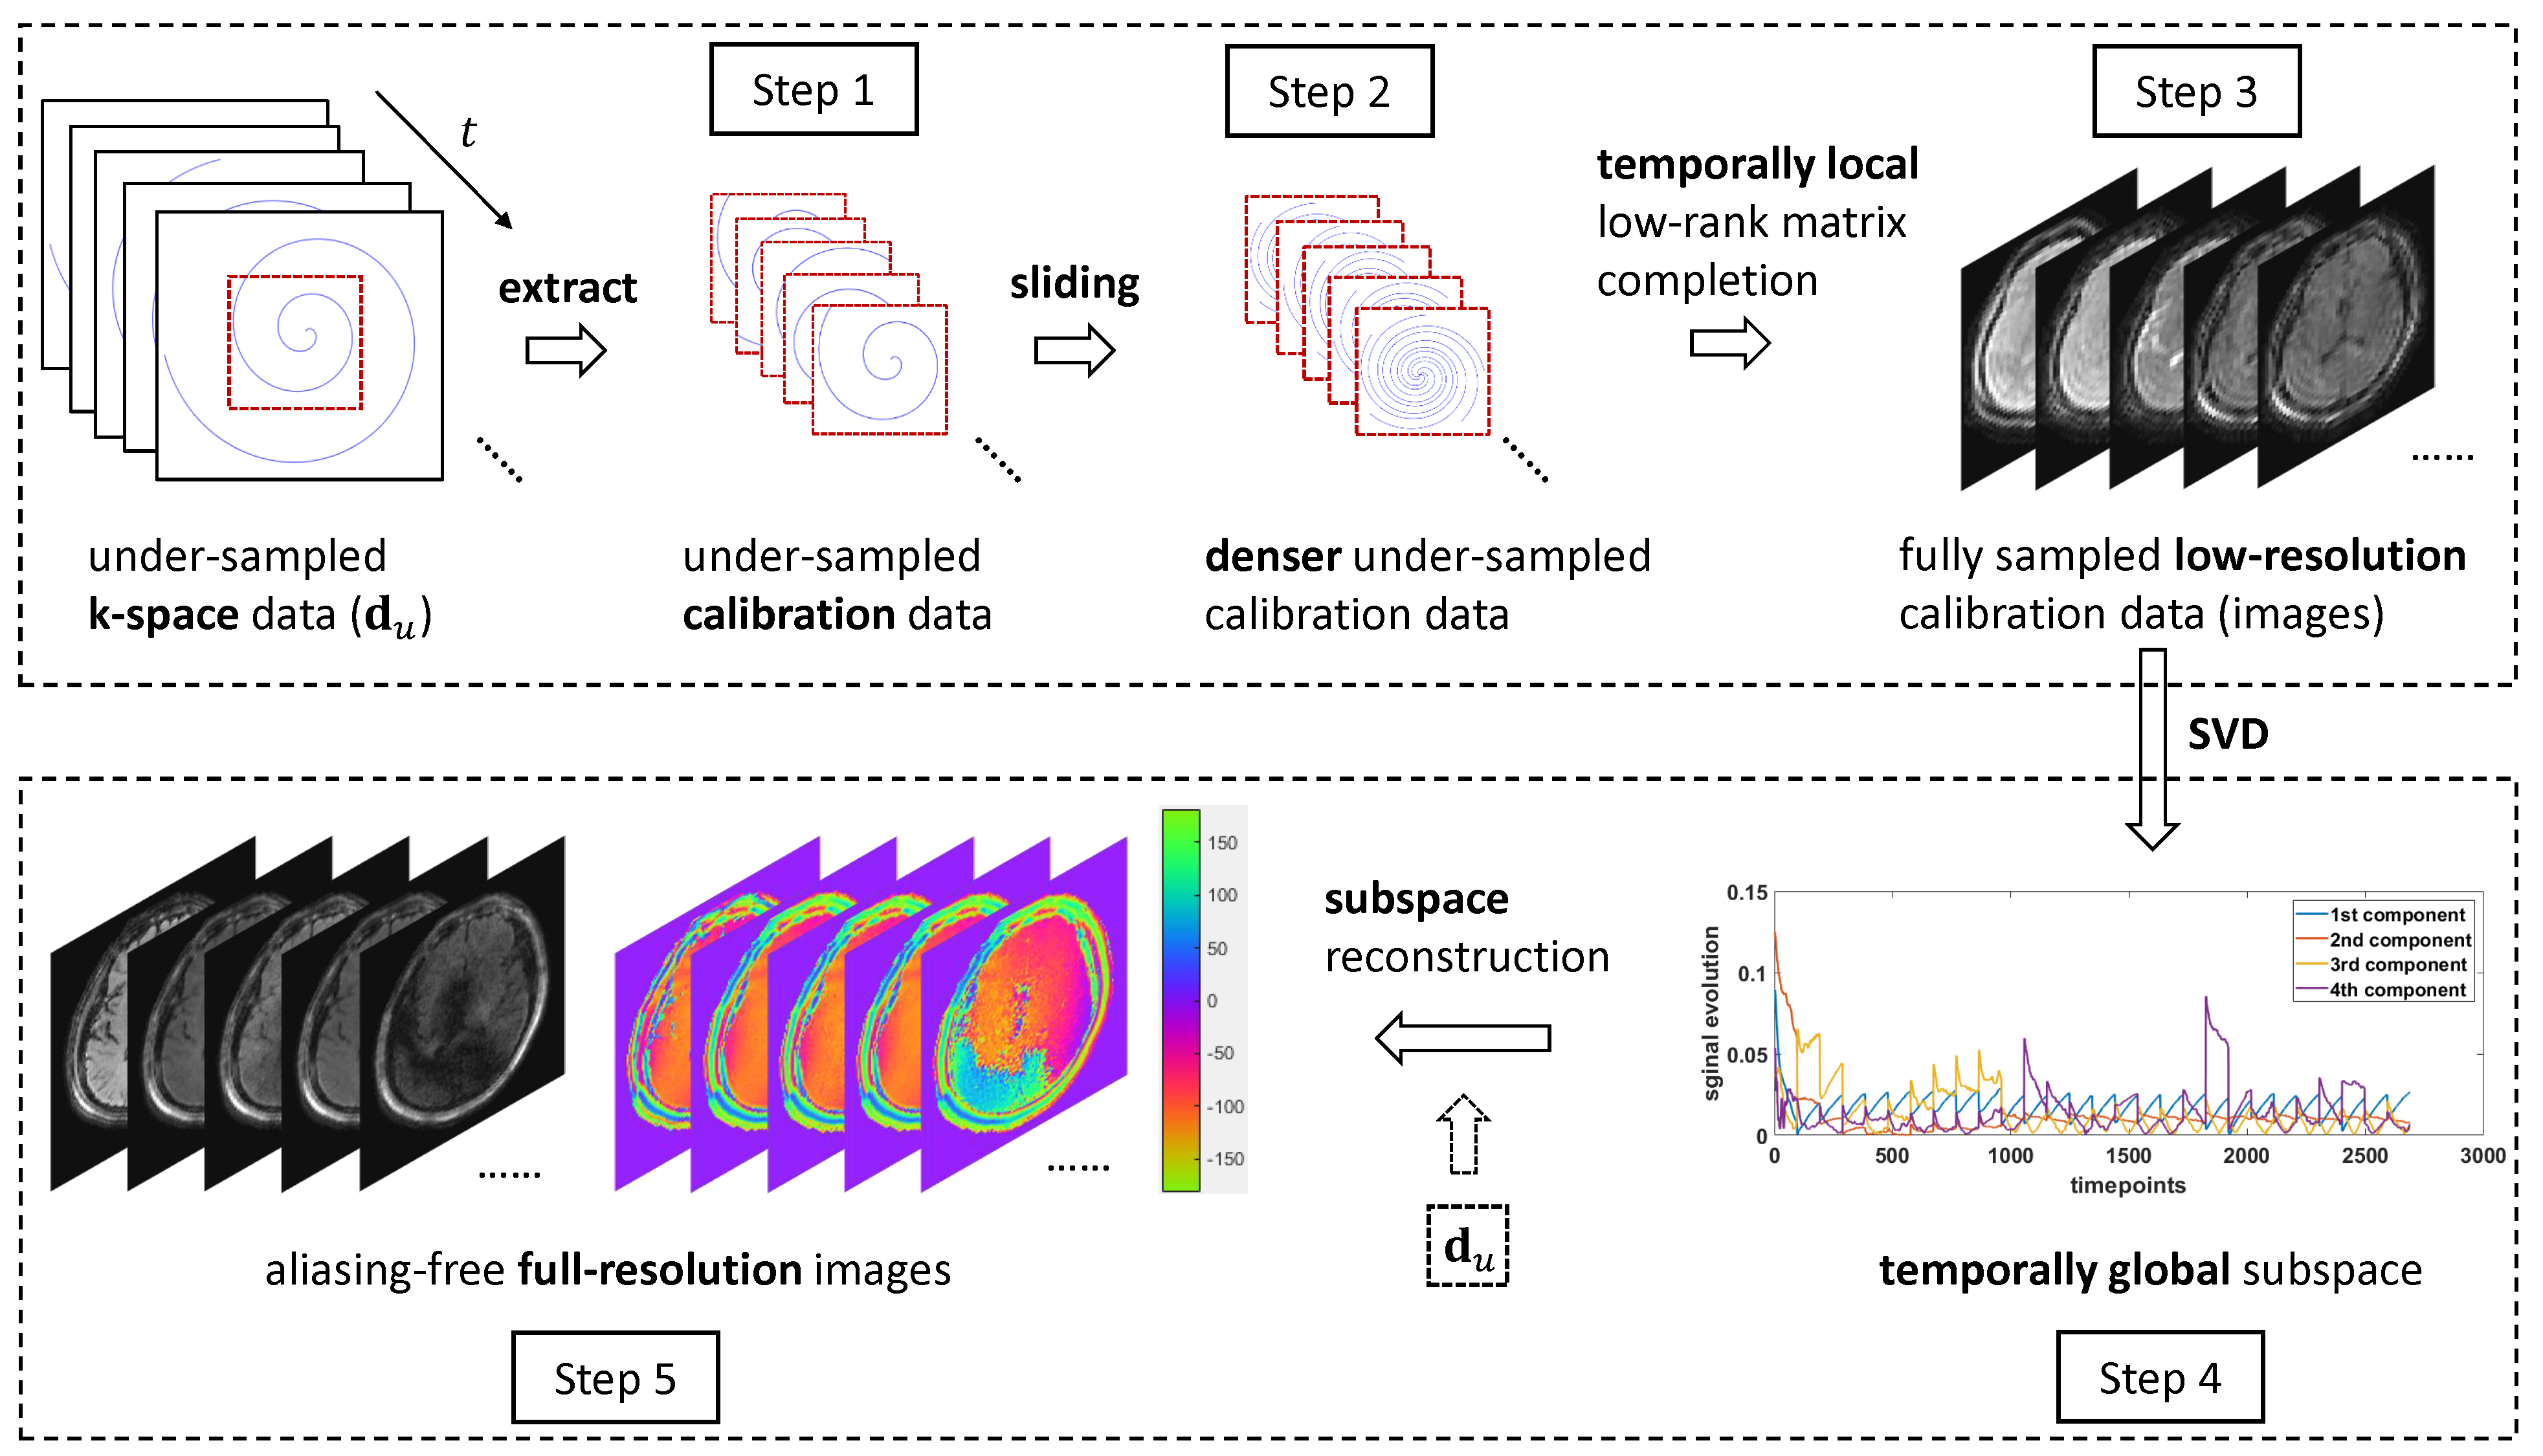
Sequence: As in reference [2], the sequence is composed of multiple acquisition segments, each starting with a preparation module (T1 inversion, T2 preparation, or diffusion preparation). In this work, we used linear encoding (LTE) for diffusion preparation and FISP for MRF readout.Reconstruction: Figure 1 shows the flowchart of the proposed self-calibrated reconstruction consisting of two main procedures. The first one is to obtain fully sampled low-resolution calibration data from under-sampled central k-space using temporally local (segment-wise) low-rank matrix completion, which applies low-rank matrix completion [6, 7] for each segment separately. The second procedure is to obtain the aliasing-free full-resolution images from the under-sampled whole k-space, using subspace reconstruction, where the subspace is estimated from the calibration data obtained in the first procedure. A temporally global subspace was used here because it benefits from global data sharing and provides significantly improved image quality compared to a temporally local subspace.
Correction: Corrupted segments (or images) were detected using a customized outlier detection algorithm and excluded in the mapping step. Briefly, in the detection algorithm, the sum of the phase difference between the first and the last images for each segment is used for detection.
Parameter Mapping: A dictionary was simulated following [2] and corrected by excluding segments corresponding to corrupted images. Pattern matching [1] was performed to generate T1, T2, M0, and ADC maps.
Acquisition: A healthy volunteer was scanned under IRB approval on a 3T Prisma scanner (Siemens Healthineers, Erlangen, Germany) using a 32-channel head coil. Two mdMRF scans (with and without peripheral pulsation gating) were acquired to evaluate the proposed method. In each mdMRF scan, 28 acquisition segments, each with 96 images, were acquired with the following scan parameters: TI (21 ms); TE (30, 50, 65 ms); b values (300, 700, 1000 s/mm2) with three diffusion directions; SSFP with constant flip angles of 10 degrees; FOV 300x300mm2; resolution 1.5x1.5mm2; slice thickness 5mm. The scan time was 26s for both scans. A conventional MRF scan [8] was performed as a reference for T1 and T2 quantifications, and an EPI-based diffusion scan was also acquired for ADC reference.
Results
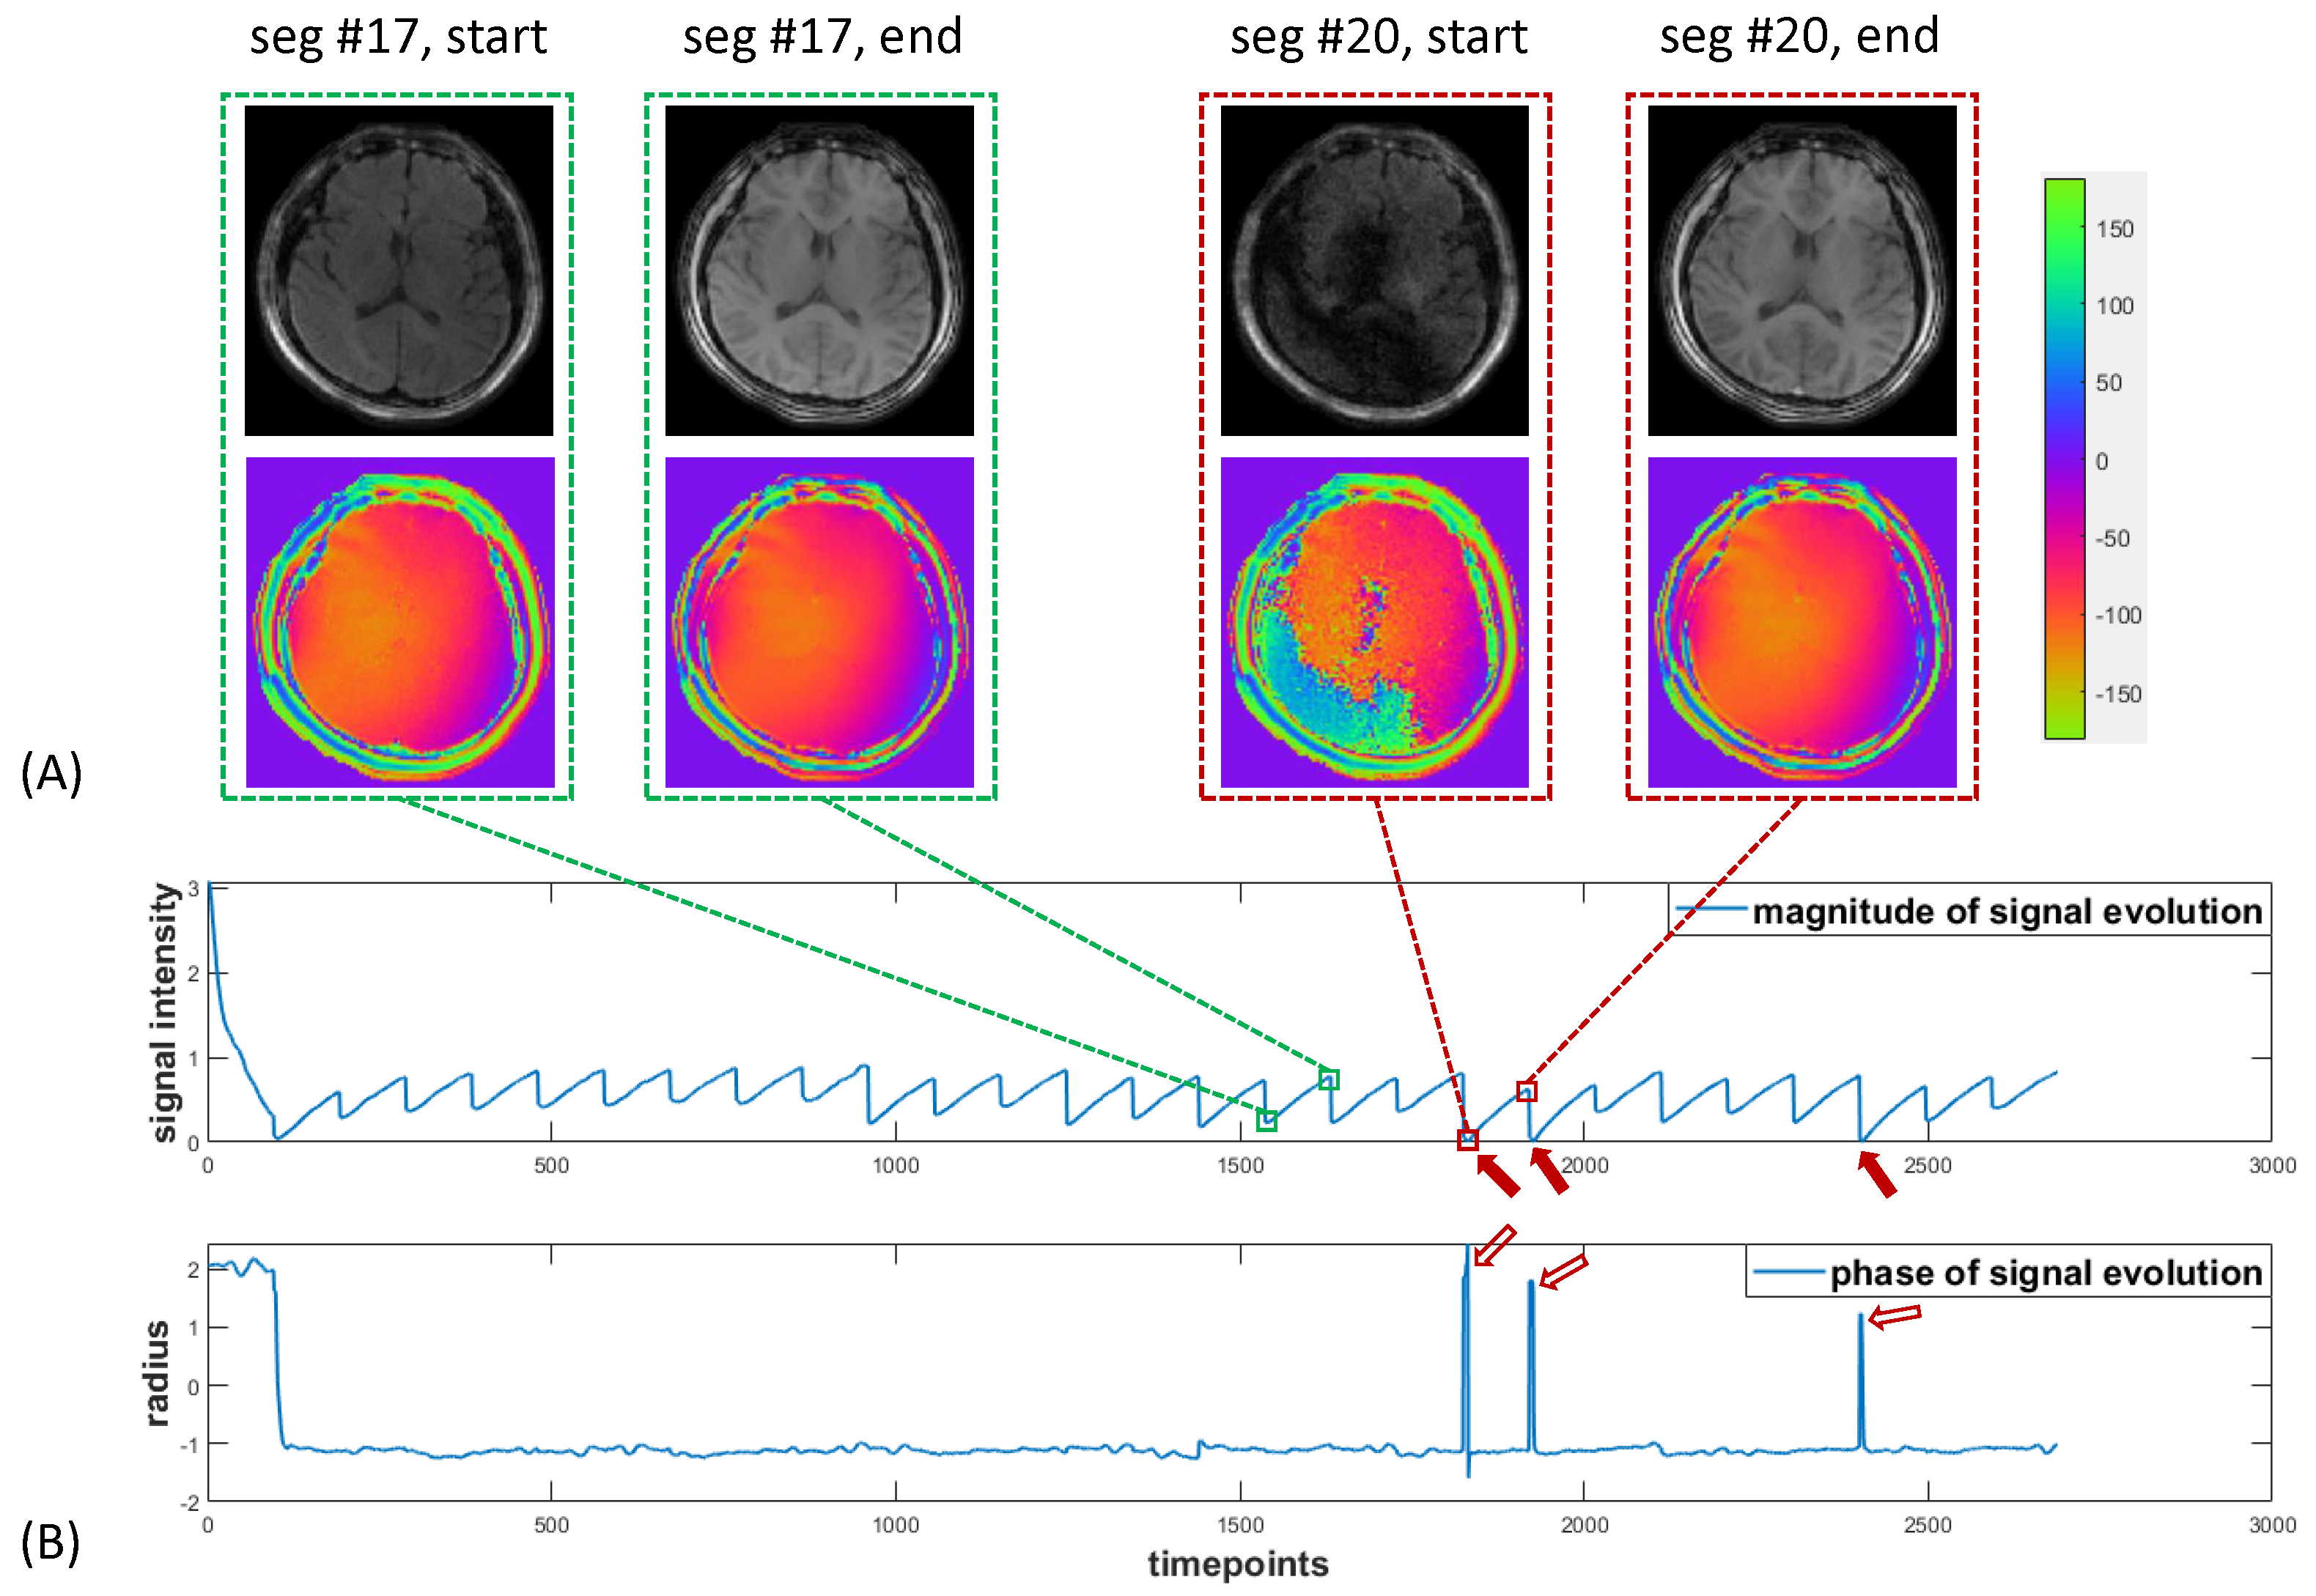
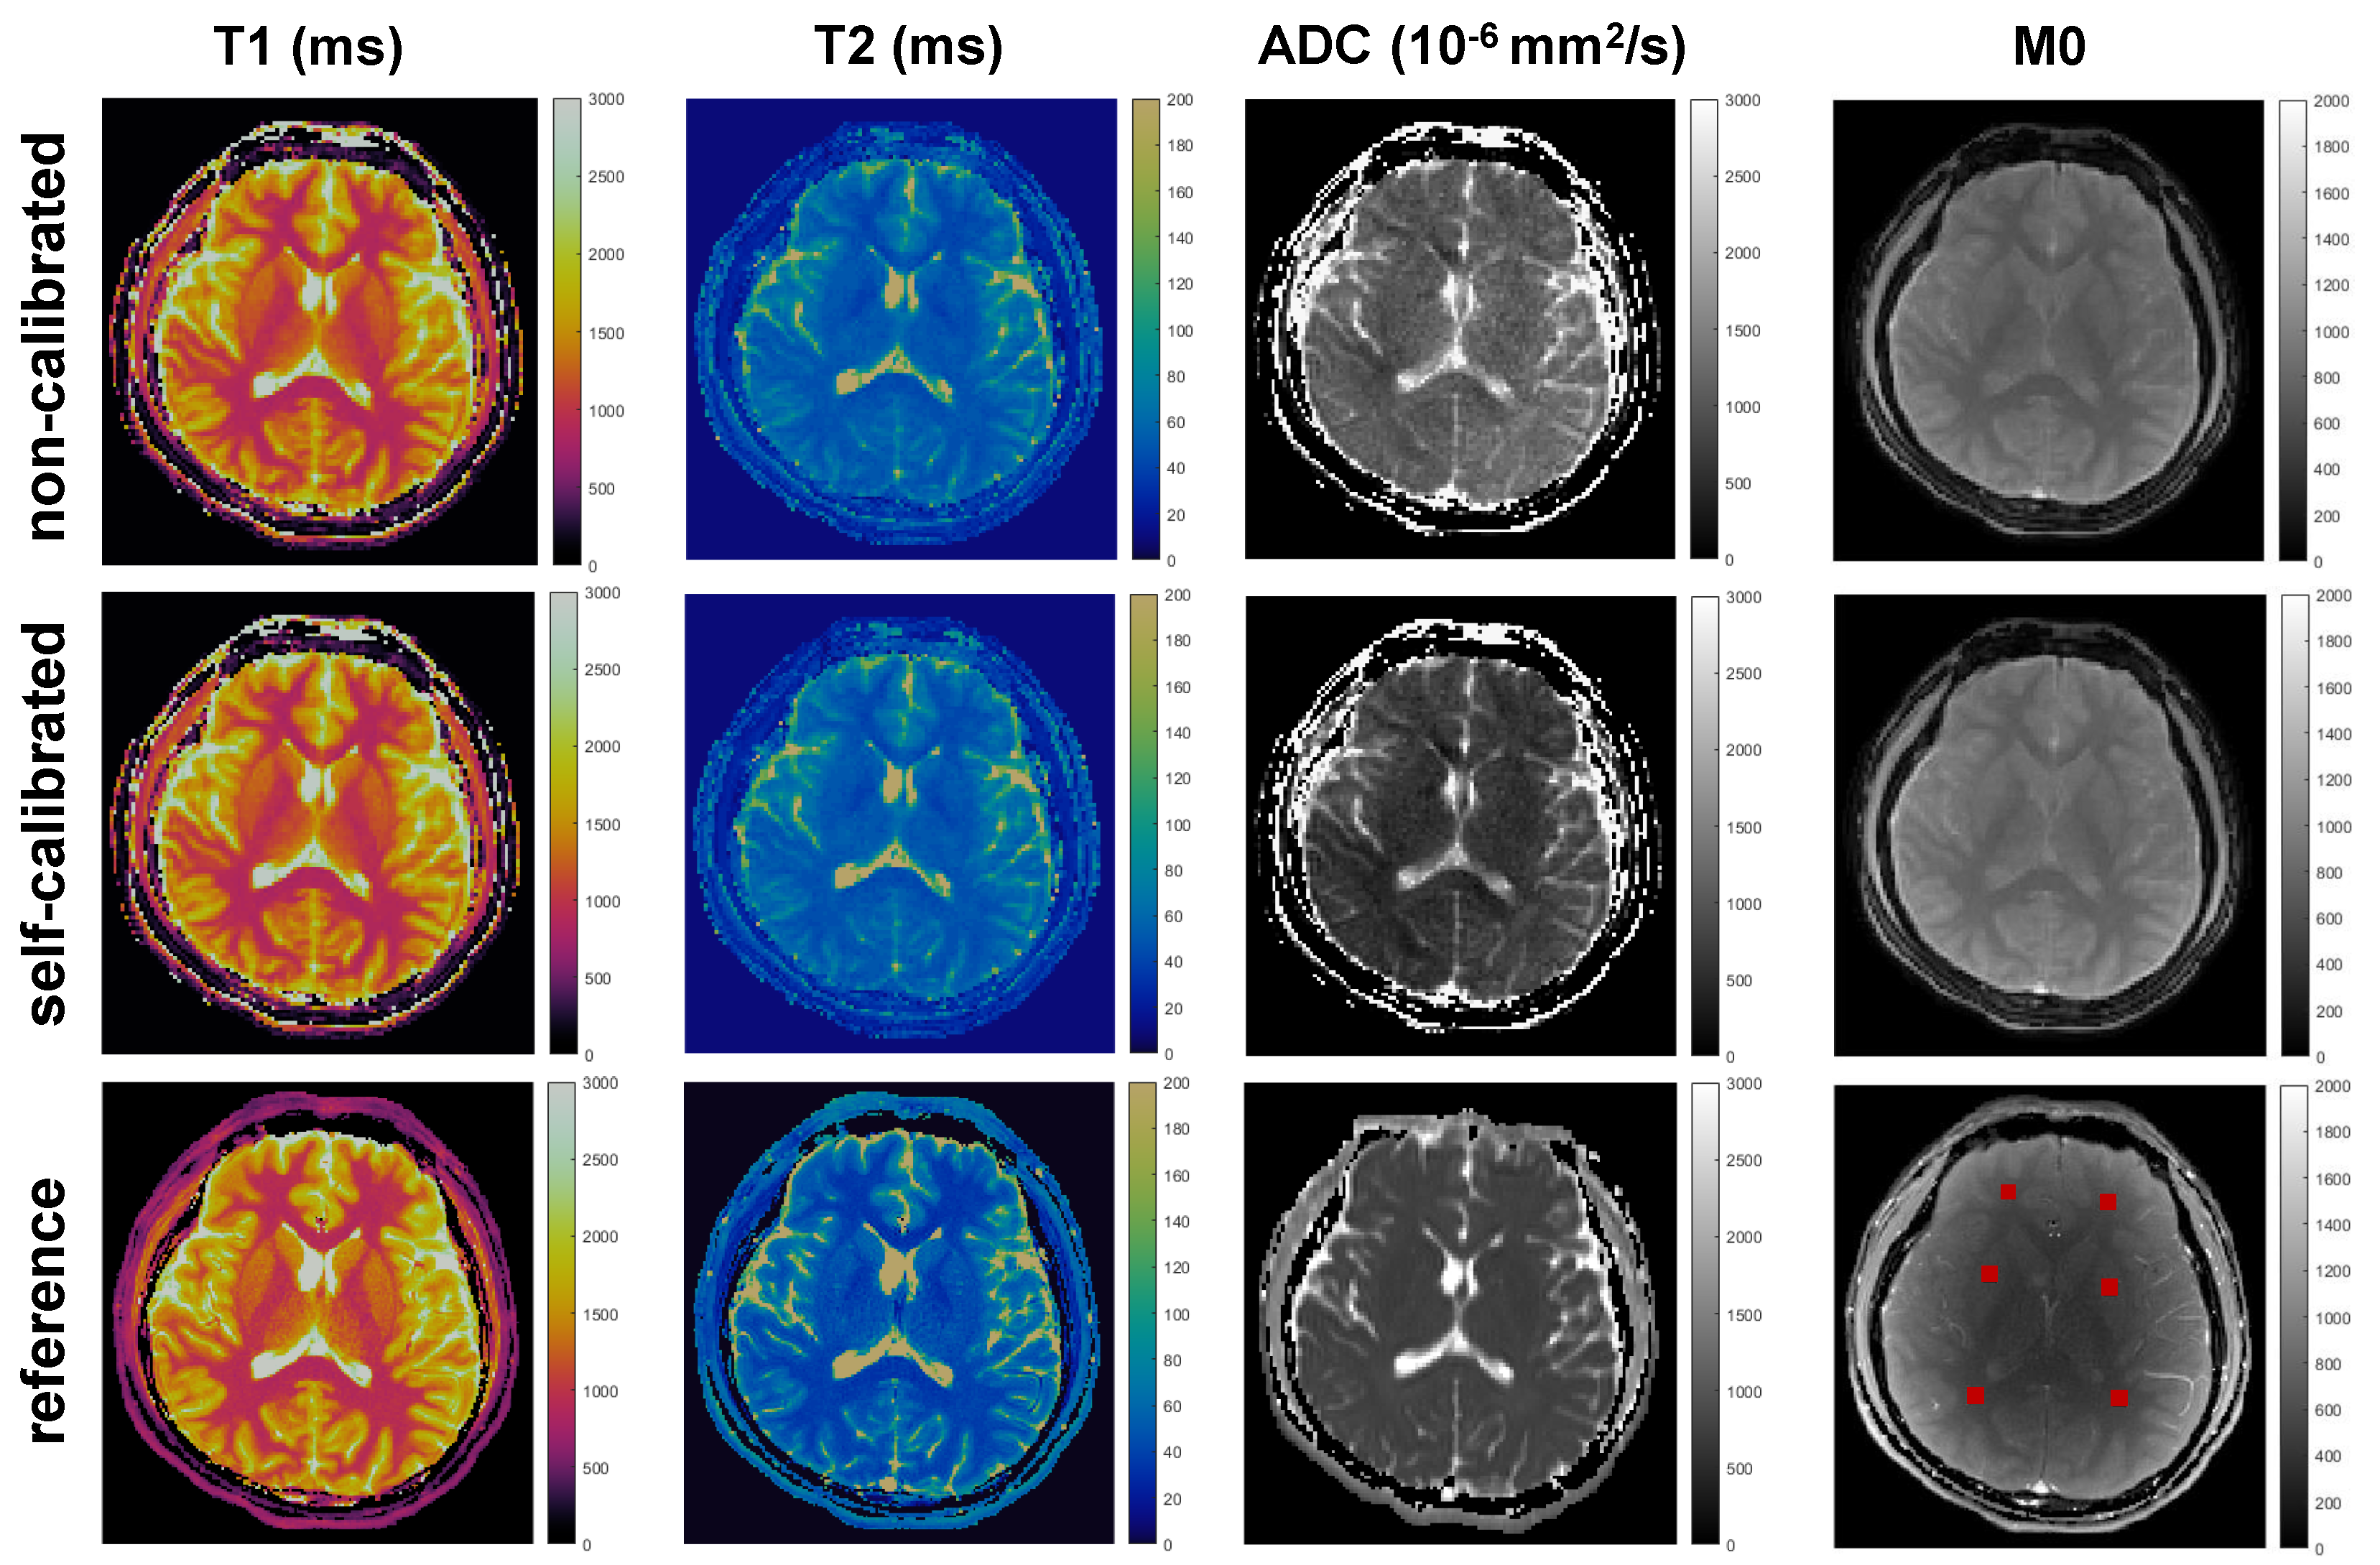
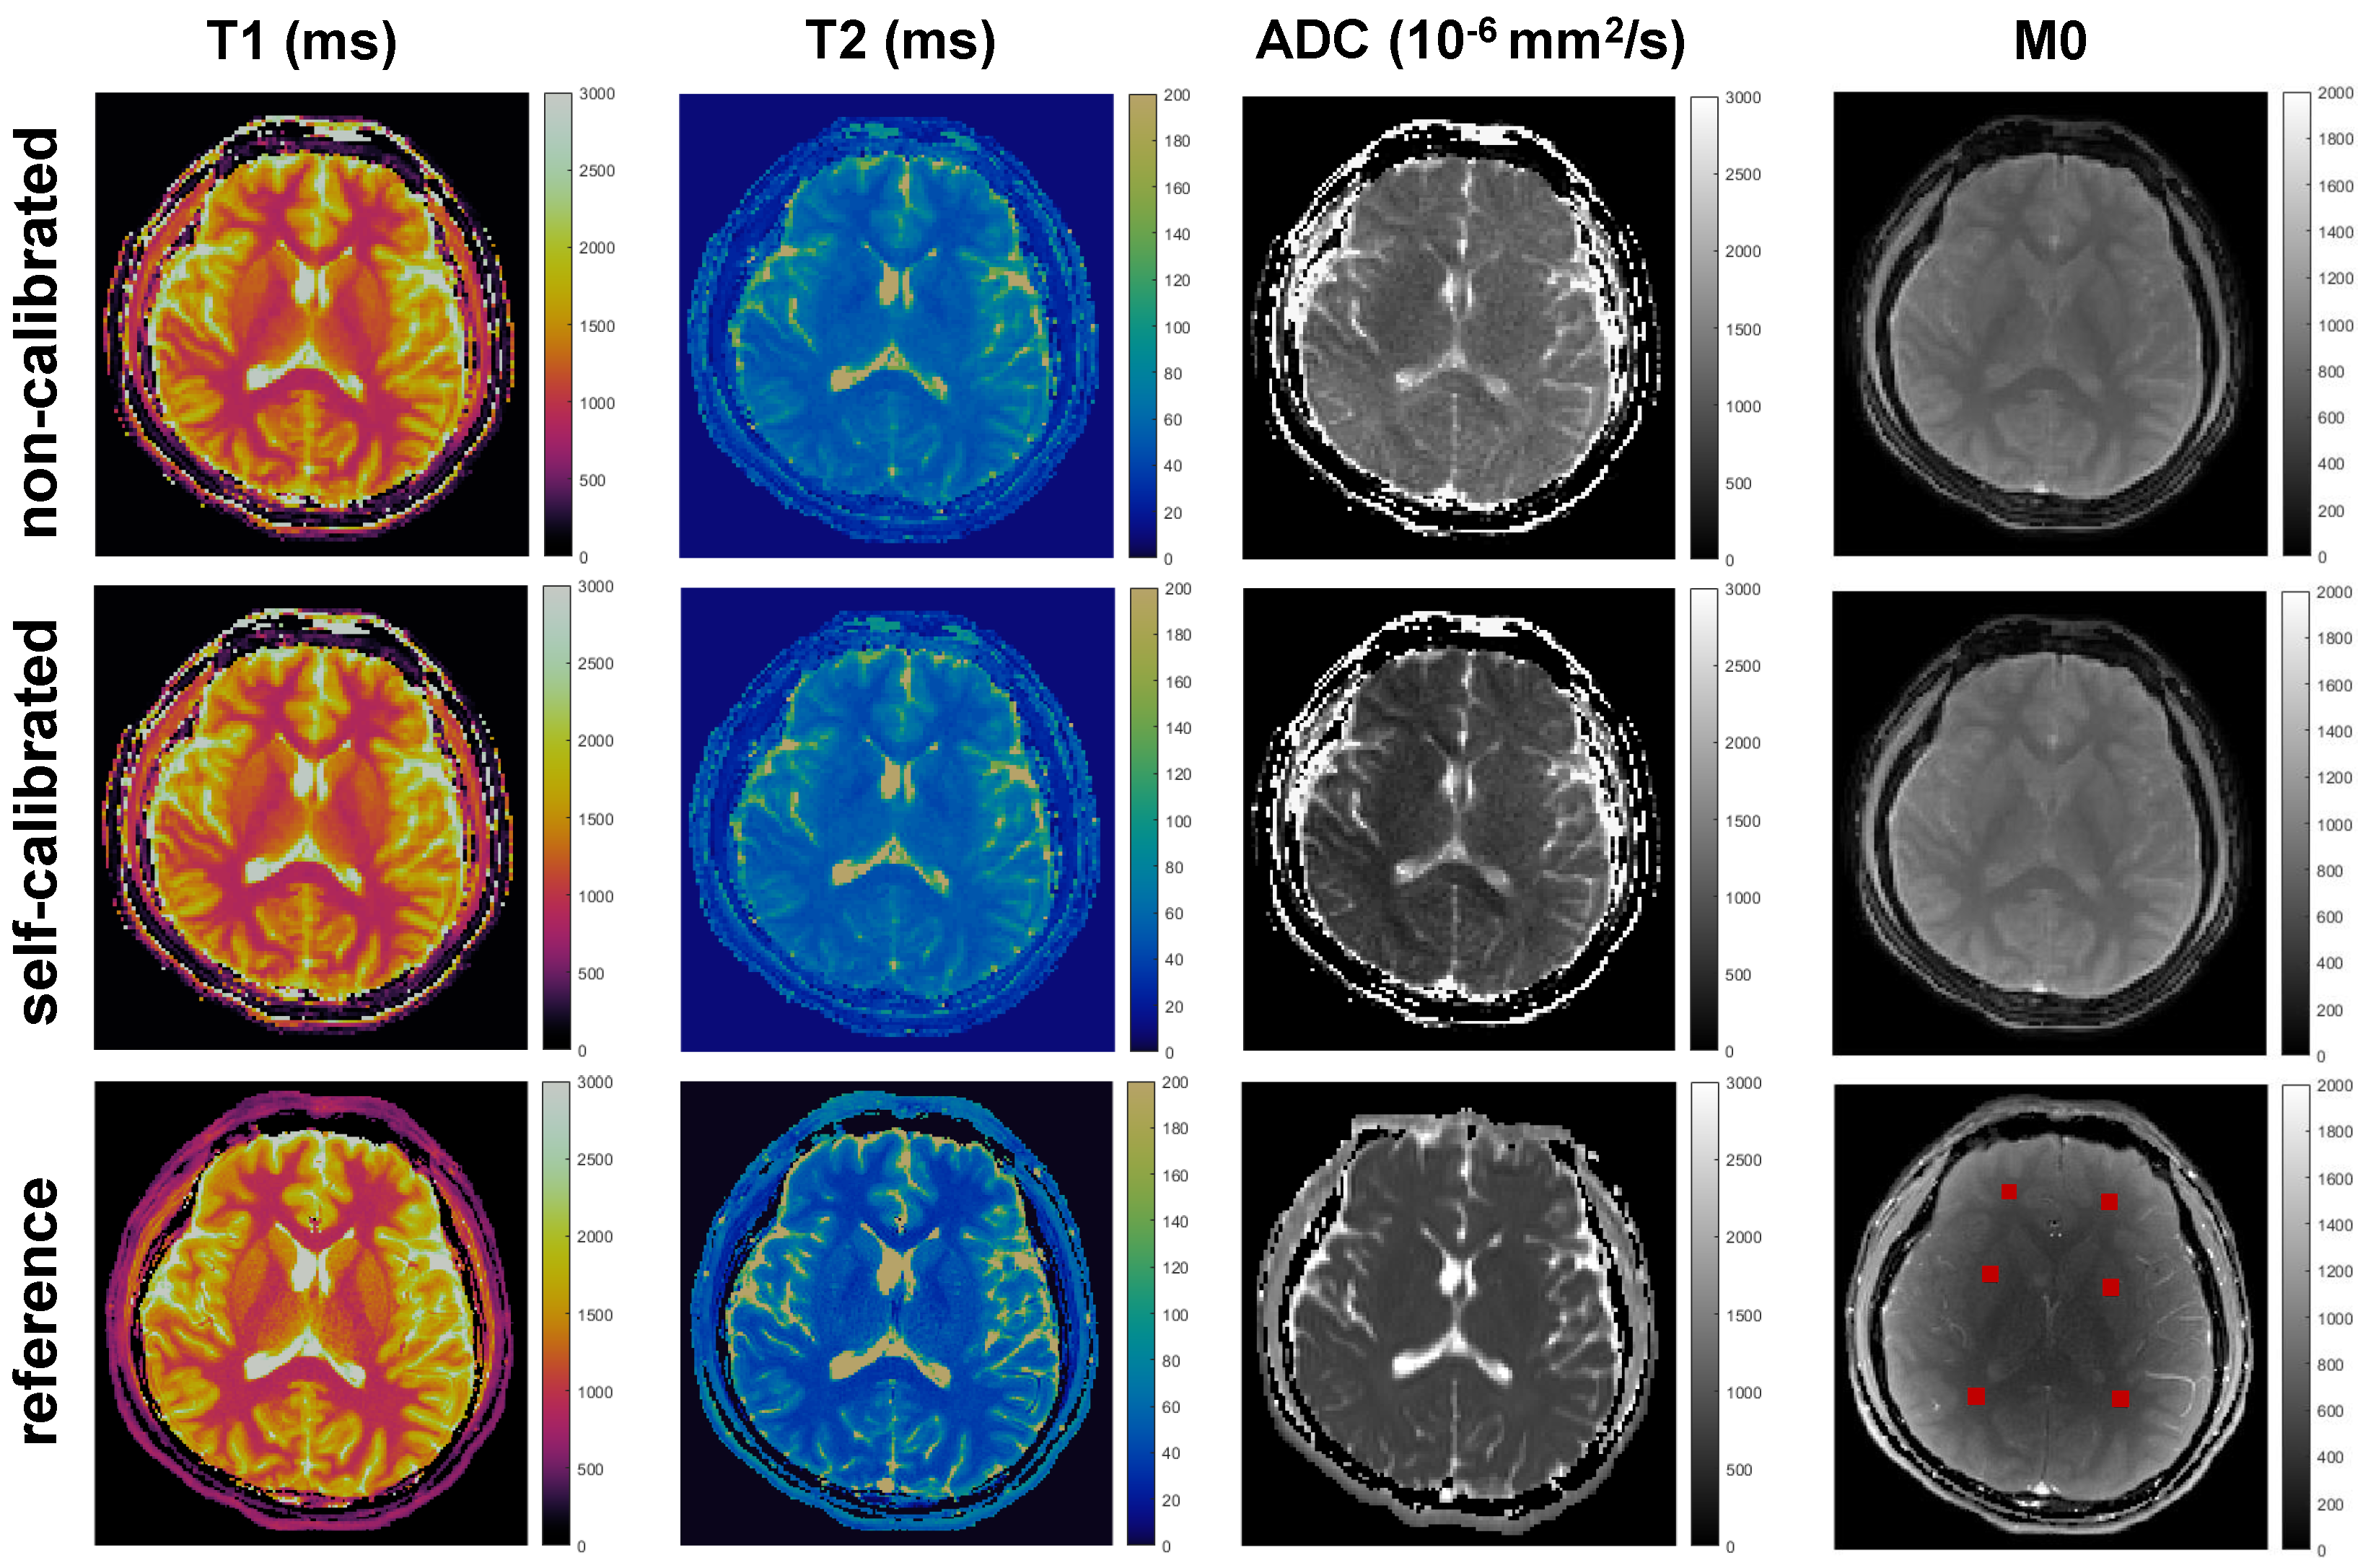
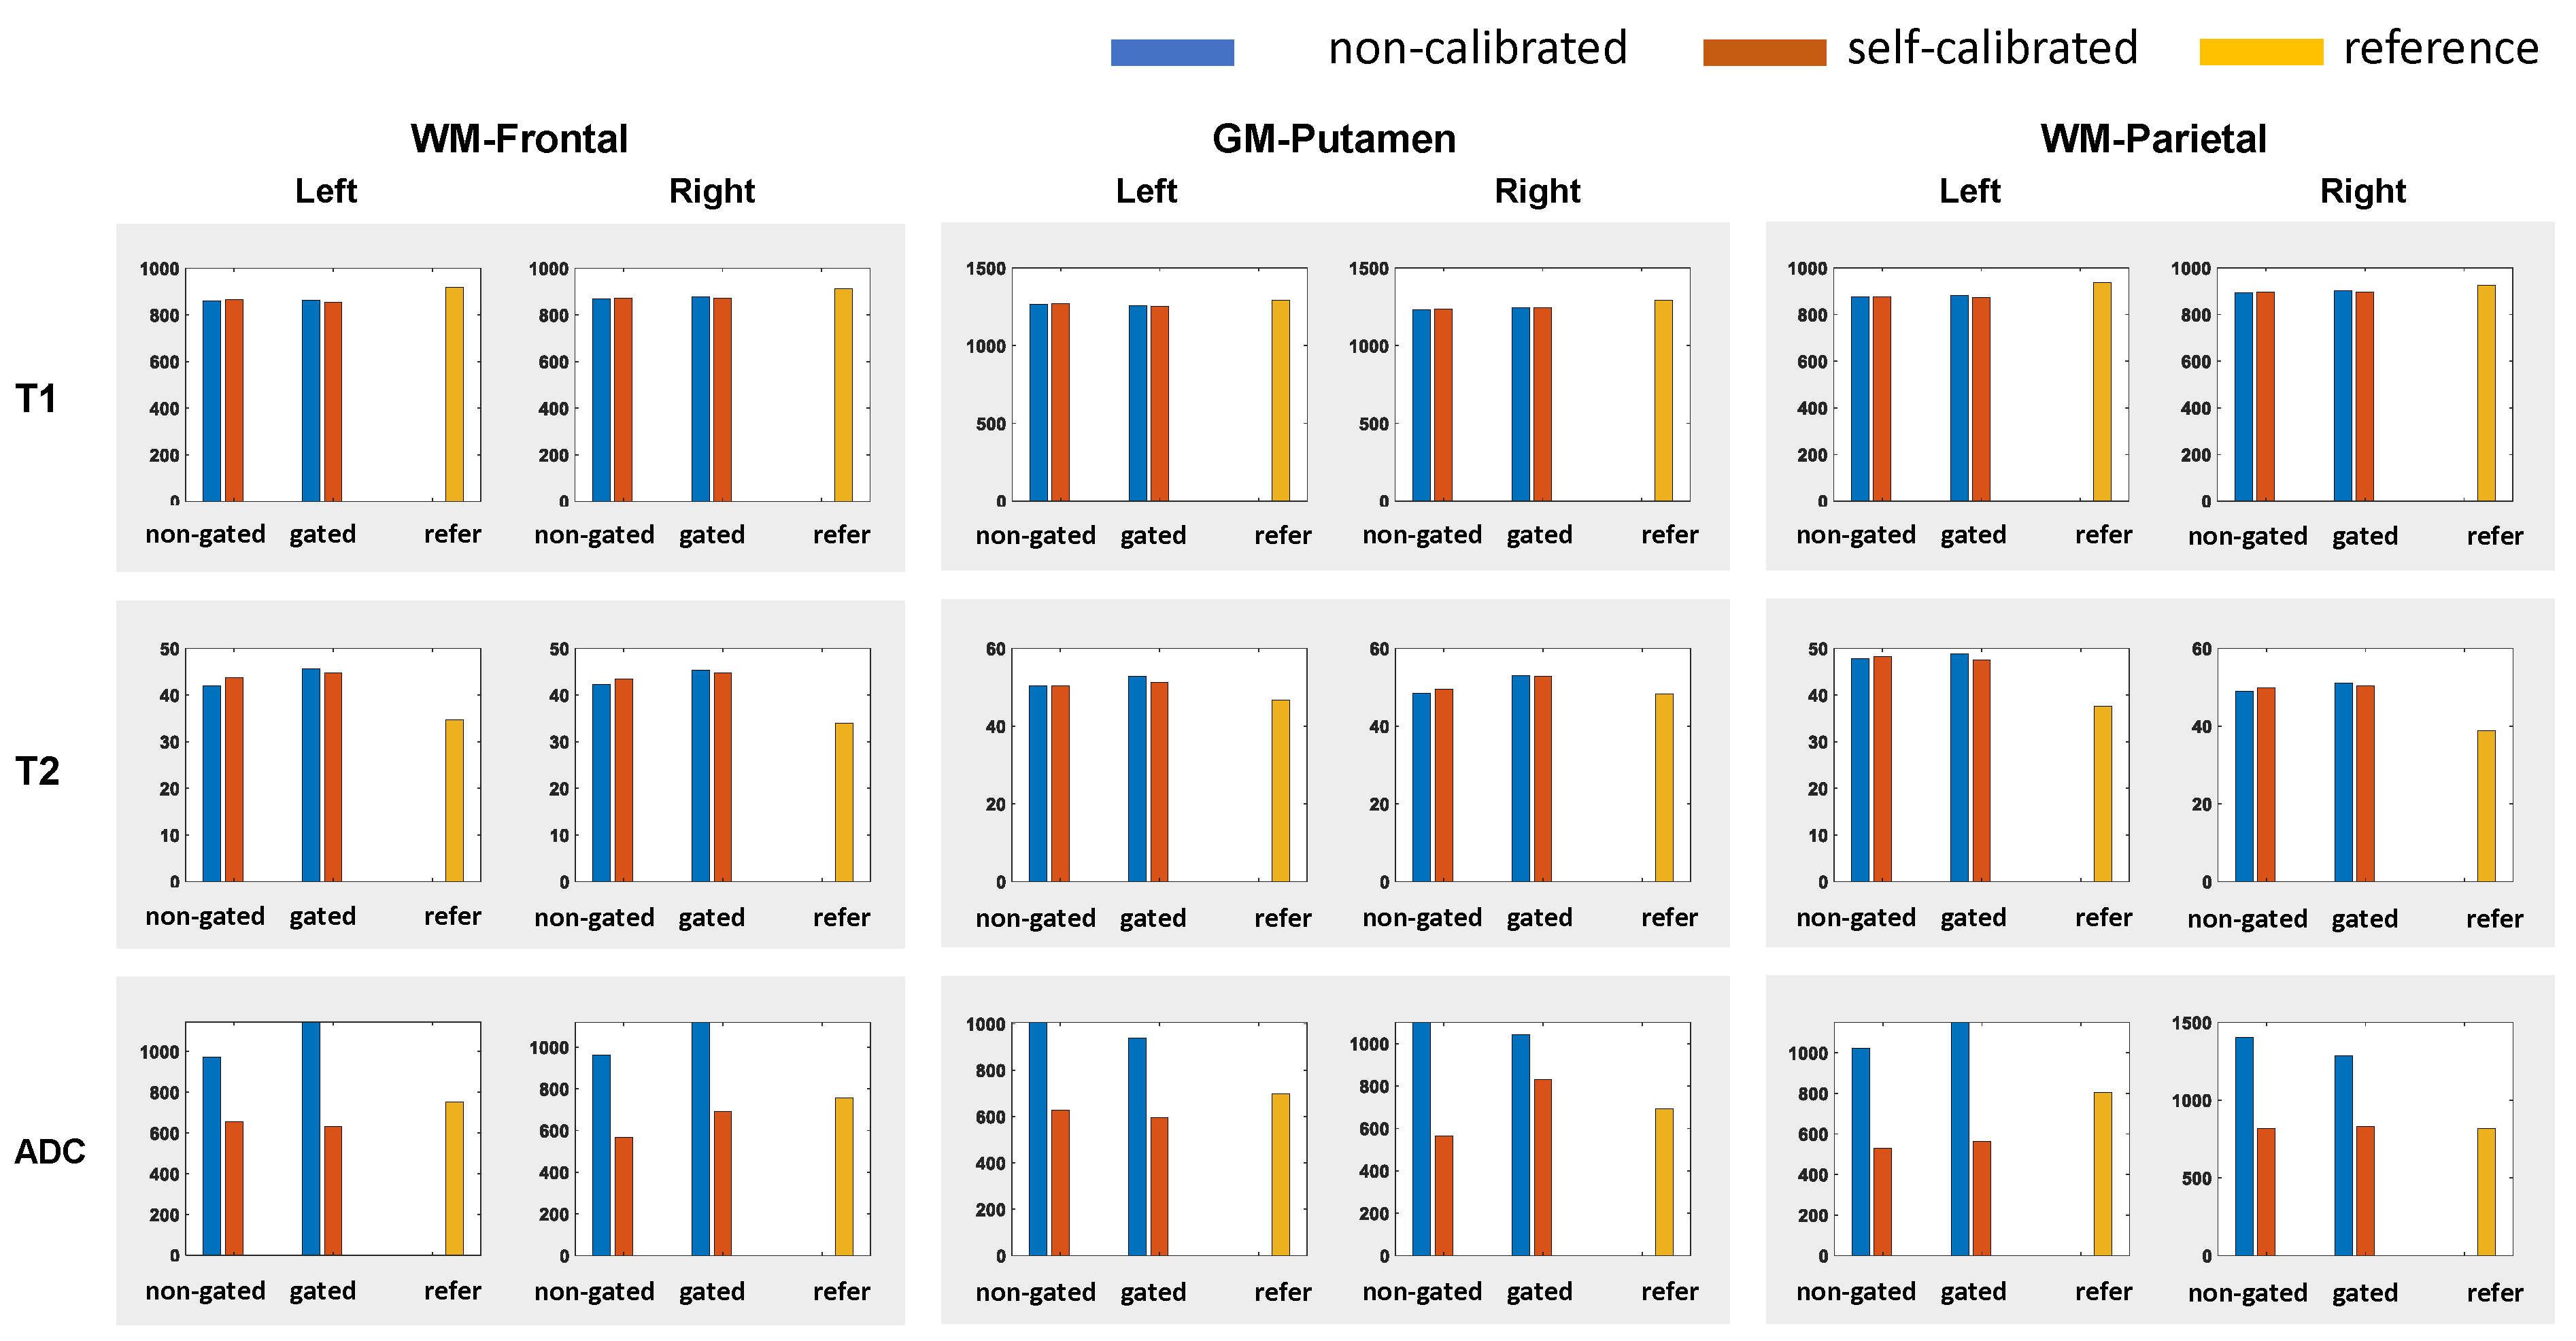
Figure 2 shows reconstructed images using the proposed self-calibrated subspace reconstruction. In the corrupted segments, there are magnitude variations (signal dropouts) and phase variations along the temporal dimension (Figure 2B). Typically, the magnitude and phase variations also exhibit spatial distribution (Figure 2A). Figure 3 shows the comparison of quantitative maps obtained using the proposed self-calibrated mdMRF and non-calibrated mdMRF, both without pulsation gating, as well as reference. While T1 and T2 maps are consistent between non-calibrated mdMRF and self-calibrated mdMRF, ADC comparison reveals severe shading artifacts in non-calibrated mdMRF, which appears as significantly uneven and overestimated ADC values. These shading artifacts are not observed on the ADC map from self-calibrated mdMRF. Similarly, Figure 4 compares quantitative maps obtained using the three methods, but with pulsation gating, to avoid phase variation caused by cardiac pulsation [1]. However, it failed in this case. Shading artifacts still exist in the ADC map of the non-calibrated mdMRF. The shading artifacts can be addressed in the self-calibrated mdMRF. Figure 5 shows the quantitative analysis for six ROIs. While T1 and T2 values remain consistent between non-calibrated mdMRF and self-calibrated mdMRF, ADC values are significantly overestimated in the former while. Self-calibrated mdMRF provides highly accurate ADC values. Compared to the reference (conventional EPI-based diffusion MRI), there are no geometric distortions observed in self-calibrated mdMRF. T2 values in both mdMRFs are slightly higher than the reference (the conventional MRF), this may be from differences in signal modeling [2].Discussion and Conclusion
In this work, we proposed and evaluated a self-calibrated subspace reconstruction method for mdMRF without gating, to retrospectively address shading artifacts in mdMRF caused by measurement errors. We demonstrate that self-calibrated mdMRF allows for a more flexible sequence design and improves scan efficiency by removing the need for pulsation gating, and provides robust and accurate relaxation and diffusion maps.Acknowledgements
This work was supported by Siemens Healthineers and NIH grant R01 NS109439.References
1. Ma D, et al. Magnetic resonance fingerprinting. Nature. 2013;495:187-192.
2. Afzali M, et al. MR Fingerprinting with b‐Tensor Encoding for Simultaneous Quantification of Relaxation and Diffusion in a Single Scan. Magn Reson Med. 2022;88:2043-2057.
3. Jeong EK, et al. High-resolution diffusion-weighted 3D MRI, using diffusion-weighted driven-equilibrium (DW-DE) and multishot segmented 3D-SSFP without navigator echoes. Magn Reson Med. 2003;50:821-829.
4. Nguyen C, et al. In vivo three-dimensional high resolution cardiac diffusion-weighted MRI: a motion compensated diffusion-prepared balanced steady-state free precession approach. Magn Reson Med. 2014;72:1257-1267.
5. Lu L, et al. Diffusion‐prepared fast imaging with steady‐state free precession (DP‐FISP): a rapid diffusion MRI technique at 7 T. Magn Reson Med. 2012;68:868-73.
6. Candes E, Recht B. Exact matrix completion via convex optimization. Communications of the ACM. 2012 Jun 1;55(6):111-9.
7. Doneva M, et al. Matrix completion-based reconstruction for undersampled magnetic resonance fingerprinting data. Magn Reson Imaging. 2017;41:41-52.
8. Jiang Y, et al. MR fingerprinting using fast imaging with steady state precession (FISP) with spiral readout. Magn Reson Med. 2015;74:1621-1631.
Figures