0425
Optimizing an Accelerated Spin- and Gradient-Echo Sequence for Dynamic MR Vascular Fingerprinting1Biomedical Engineering, University of California Davis, Davis, CA, United States, 2Neurology, University of California Davis, Davis, CA, United States
Synopsis
Keywords: MR Fingerprinting/Synthetic MR, MR Fingerprinting
An accelerated spin- and gradient-echo (SAGE) pulse sequence sensitive to changes in oxygenation has been demonstrated to be suitable for MR vascular fingerprinting (MRvF), potentially enabling quantitative, multiparametric mapping of dynamic vascular physiology. This study aimed to optimize this SAGE sequence and matching algorithms used in MRvF and found that selecting shorter echo times resulted in better signal properties and sensitivity for pattern matching with lower estimation error. This optimization will enable these techniques to be used during dynamic vascular challenges and investigations into multiple, simultaneous functional cerebrovascular biomarkers.
Introduction
Magnetic resonance fingerprinting (MRF) has reshaped the field of quantitative MRI through its ability to generate multiparametric, quantitative parameter maps from a single MR sequence.1 The further development of MR vascular fingerprinting (MRvF), has leveraged the biophysical simulations inherent to MRF to enable simultaneous mapping of vascular parameters such as cerebral blood volume (CBV), microvascular vessel radii (R), and tissue oxygen saturation (SO2).2 A fast spin- and gradient-echo (SAGE) pulse sequence provides five echo times (TE), is sensitive to quantitative perfusion metrics,3 and allows for dynamic vascular parameter mapping on the order of seconds (<5 s). It has also been shown to have an adequate echo train length and SNR for feasible MRvF with high temporal resolution and accuracy.4,5 Optimizing the SAGE acquisition specifically for MRvF and implementing an efficient matching algorithm that minimizes error while generating reliable physiological measurements is highly desirable for MRvF mapping of vascular physiology.Methods
Biophysical signal simulations were performed using the MRVox toolkit in MATLAB.6 An example of a simulated signal is shown in Figure 1A, illustrating the free induction decay (FID) after the initial 90° radiofrequency (RF) pulse, the refocusing after the 180° RF, and the signal dephasing after the spin echo (SE). When practically implementing the SAGE sequence on the scanner, the first TE is set manually, and then the 180° RF (and therefore the SE) shifts based on that first TE. This is reflected in Figure 1B which shows the seven TE patterns and imaging parameters used in both the simulations and in vivo imaging.Seven simulated dictionaries were generated, one for each set of imaging parameters, using 40 values of CBV from 0.1 to 25%, 40 values of radius from 2 to 24 microns, and 40 values of SO2 from 0 to 100% for a total of 64,000 entries for each of the seven dictionaries. Complex Gaussian noise was added to an example signal (5% CBV, 5 µm R, and 65% SO2) 100 times with signal-to-noise ratio (SNR) of 160 and matched to the noise-free dictionary with a complex inner product matching algorithm.
Four matching algorithms were implemented (Figure 3) utilizing the magnitude (left) or complex signal (right), and a 1-step (top) or 2-step iterative method (bottom). The first step of the iterative methods uses only the FID echoes, as this regime is most sensitive to SO2. The second step uses all echoes but limits the dictionary range in the SO2 dimension based on the best match from the first step. Monte Carlo simulations were performed in which 300 dictionary entries were randomly selected from each of the seven dictionaries and Gaussian noise (SNR=160) was added 100 independent times for 30,000 unique simulations for each TE pattern. Each of the four matching algorithms were utilized on every noisy simulation, and the resulting root-mean-square-error between the MRvF estimate and the true underlying vascular parameters was calculated (Figure 4).
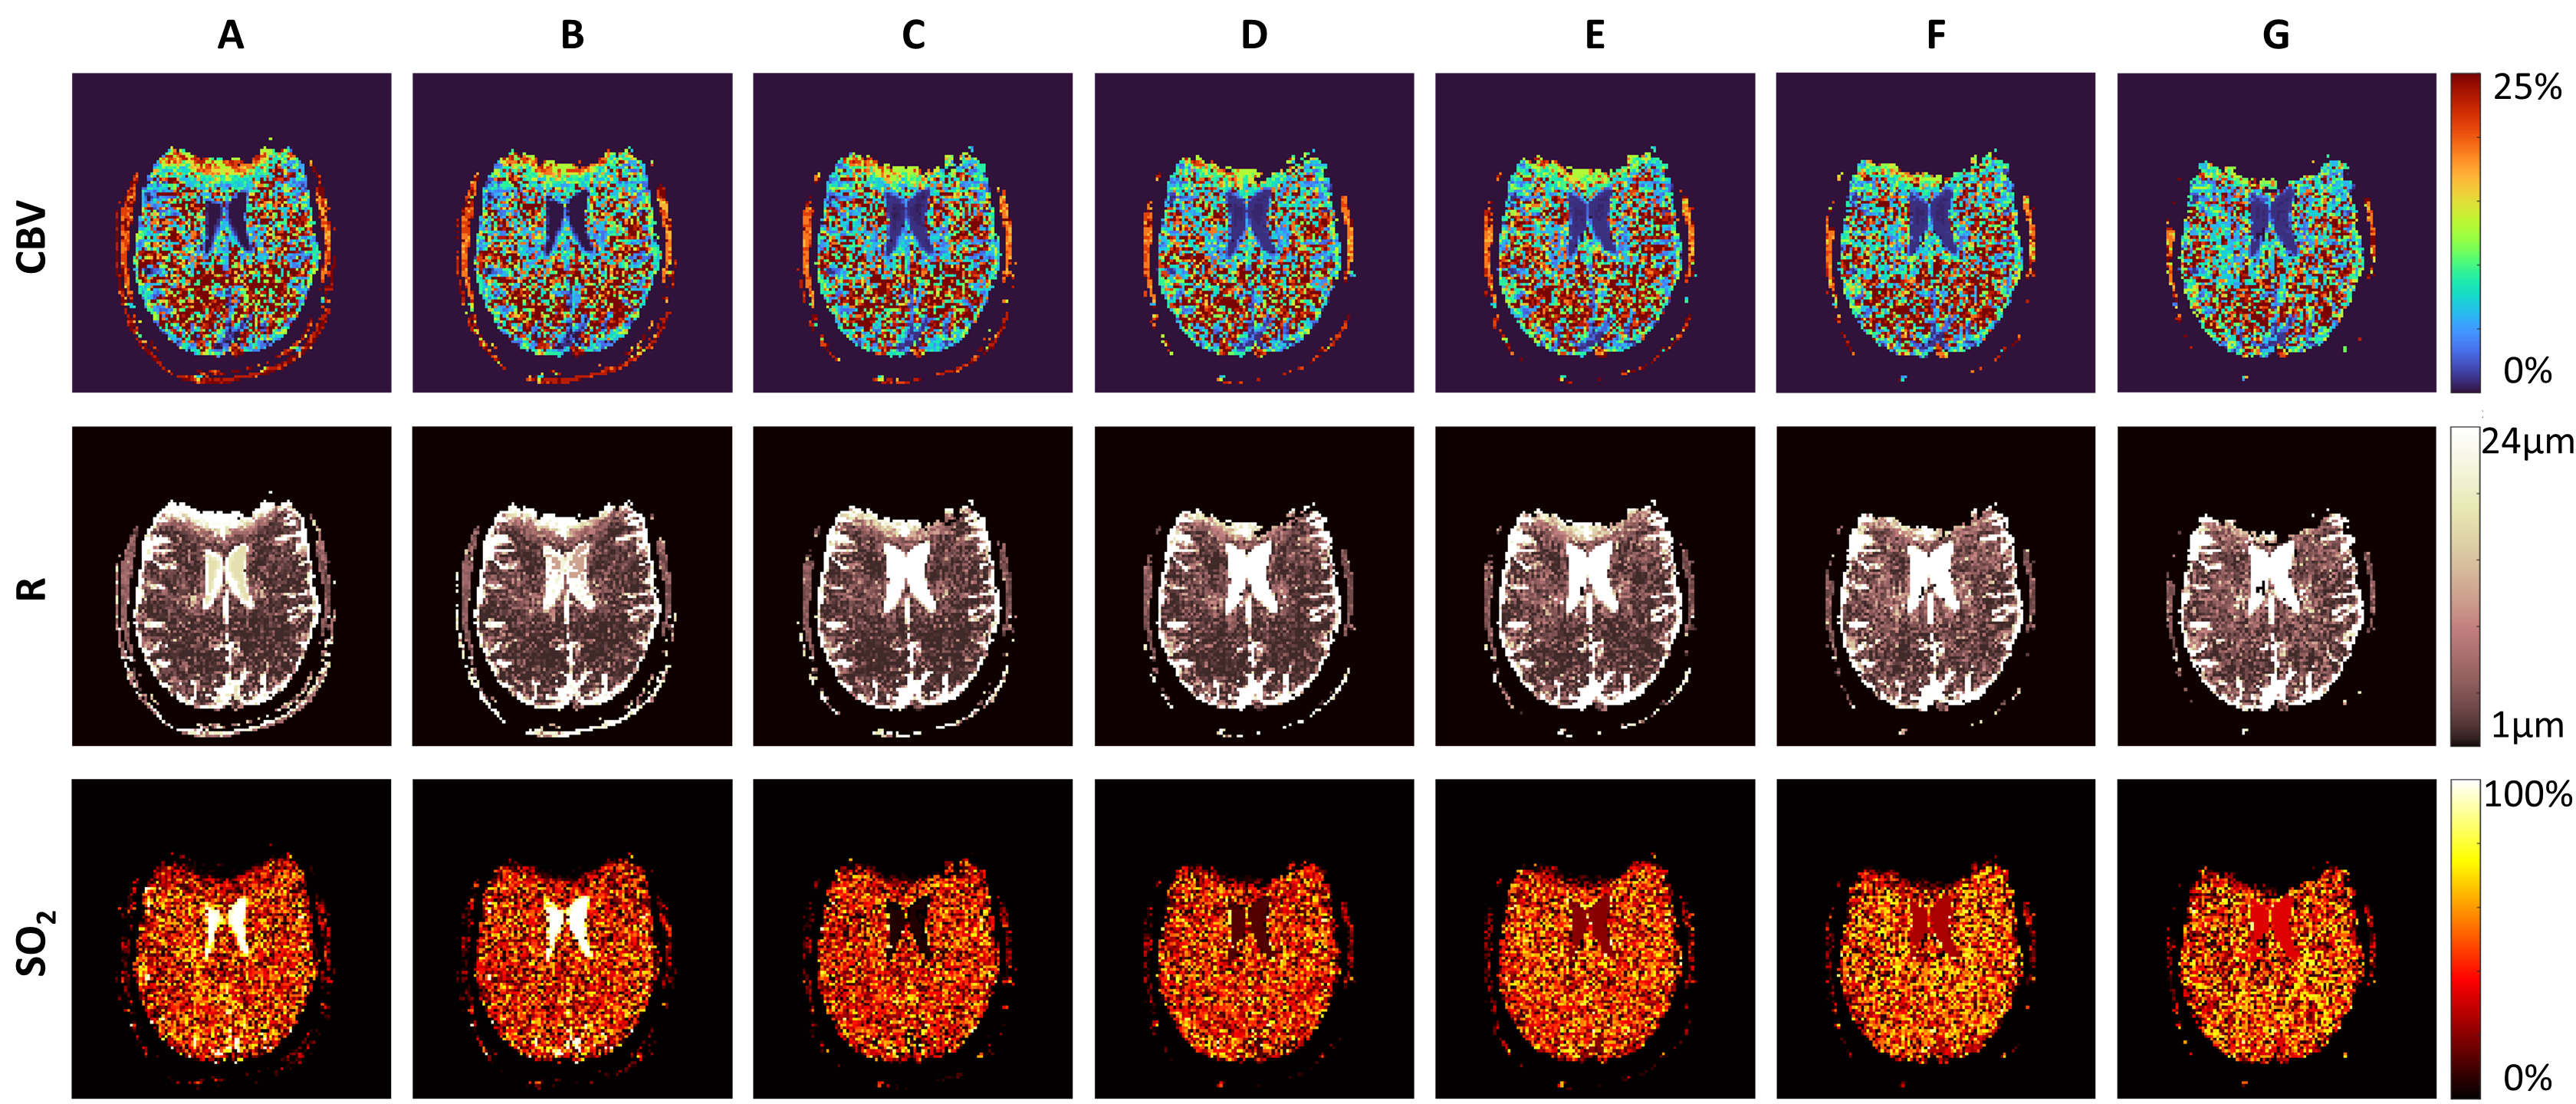
To assess the SAGE imaging parameters in vivo, a healthy subject was scanned at 3T (Siemens Skyra) with each TE pattern. Each image was phase processed7 and then matched to the appropriate dictionary described previously, using the 2-step magnitude method from Figure 3C. CBV, R, and SO2 maps were reconstructed from the extracted parameters after fingerprint matching (Figure 5).
Results
The average inner product metric between the example noisy signal and each noise-free dictionary entry was calculated (Figure 2). Parameter maps generated using each of the four matching algorithms are shown below each algorithm (Figure 3). With magnitude matching, the iterative method (3C) provided lower CBV values at more physiological levels than the 1-step method (3A). For complex matching, the iterative approach (3D) provided increased, more physiological SO2 values than the 1-step approach (3B).Simulations with the seven SAGE patterns and four matching algorithms show that error of parameter estimates increases when the first TE is longer. The 2-step algorithms also result in reduced CBV and R estimation error (Figure 4).
Discussion and Conclusions
The sensitivity profiles (Figure 2) illustrate the relationship between fitting metric and combinations of the simulated vascular parameter, indicating the difficulty in disentangling the best dictionary match as increasing CBV and decreasing SO2 have similar effects on SAGE signal. The TE patterns in Figure 2 show the relative signal for each, demonstrating that the shortest TE pattern has higher signal and therefore better SNR. This likely contributes to pattern A in Figure 4 having the smallest error. Additionally, patterns A and B sample after the spin echo which is beneficial for oxygenation sensitivity.Significant susceptibility distortions can be seen in the parameter maps in Figure 5; however, these also show that the parameter mapping is quite robust to the shifting TE patterns. Additionally, even with optimal TE patterns and matching algorithms, CBV values are higher and SO2 values are lower than one would expect physiologically. More realistic biophysical modelling, the addition of a range of T2 values in simulations, and a machine learning MRvF reconstruction should help improve this.
These findings will lead to improved modelling and reconstruction in future MRvF studies in which an optimized SAGE sequence will be employed during a vascular challenge to observe vascular parameters dynamically changing over time.
Acknowledgements
This study was supported by NIH R00-NS102884. The project described was supported in part by the National Center for Advancing Translational Sciences, National Institutes of Health, through grant number UL1 TR001860 and linked award TL1 TR001861.References
1. Ma D, Gulani V, Seiberlich N, et al. Magnetic resonance fingerprinting. Nature. 2013;495(7440):187-192. doi:10.1038/nature11971
2. Christen T. Tissue oxygen saturation mapping with magnetic resonance imaging. Published online 2014:8.
3. Manhard MK, Bilgic B, Liao C, et al. Accelerated whole‐brain perfusion imaging using a simultaneous multislice spin‐echo and gradient‐echo sequence with joint virtual coil reconstruction. Magn Reson Med. Published online May 8, 2019:mrm.27784. doi:10.1002/mrm.27784
4. Wheeler G, Fan A. Noise Considerations for Accelerated MR Vascular Fingerprinting. Presented at: Proc. Intl. Soc. Mag. Reson. Med. 29; 2021. https://cds.ismrm.org/protected/21MProceedings/PDFfiles/1534.html
5. Wheeler G, Lee Q, Manhard MK, Bilgic B, Fan A. Feasibility of Dynamic Contrast-free Vascular Magnetic Resonance Fingerprinting. Presented at: Proc. Intl. Soc. Mag. Reson. Med. 30; 2022. https://index.mirasmart.com/ISMRM2022/PDFfiles/2597.html
6. Pannetier NA, Debacker CS, Mauconduit F, Christen T, Barbier EL. A Simulation Tool for Dynamic Contrast Enhanced MRI. PLoS ONE. 2013;8(3):e57636. doi:10.1371/journal.pone.0057636
7. Li W, Wu B, Liu C. Quantitative susceptibility mapping of human brain reflects spatial variation in tissue composition. NeuroImage. 2011;55(4):1645-1656. doi:10.1016/j.neuroimage.2010.11.088
Figures
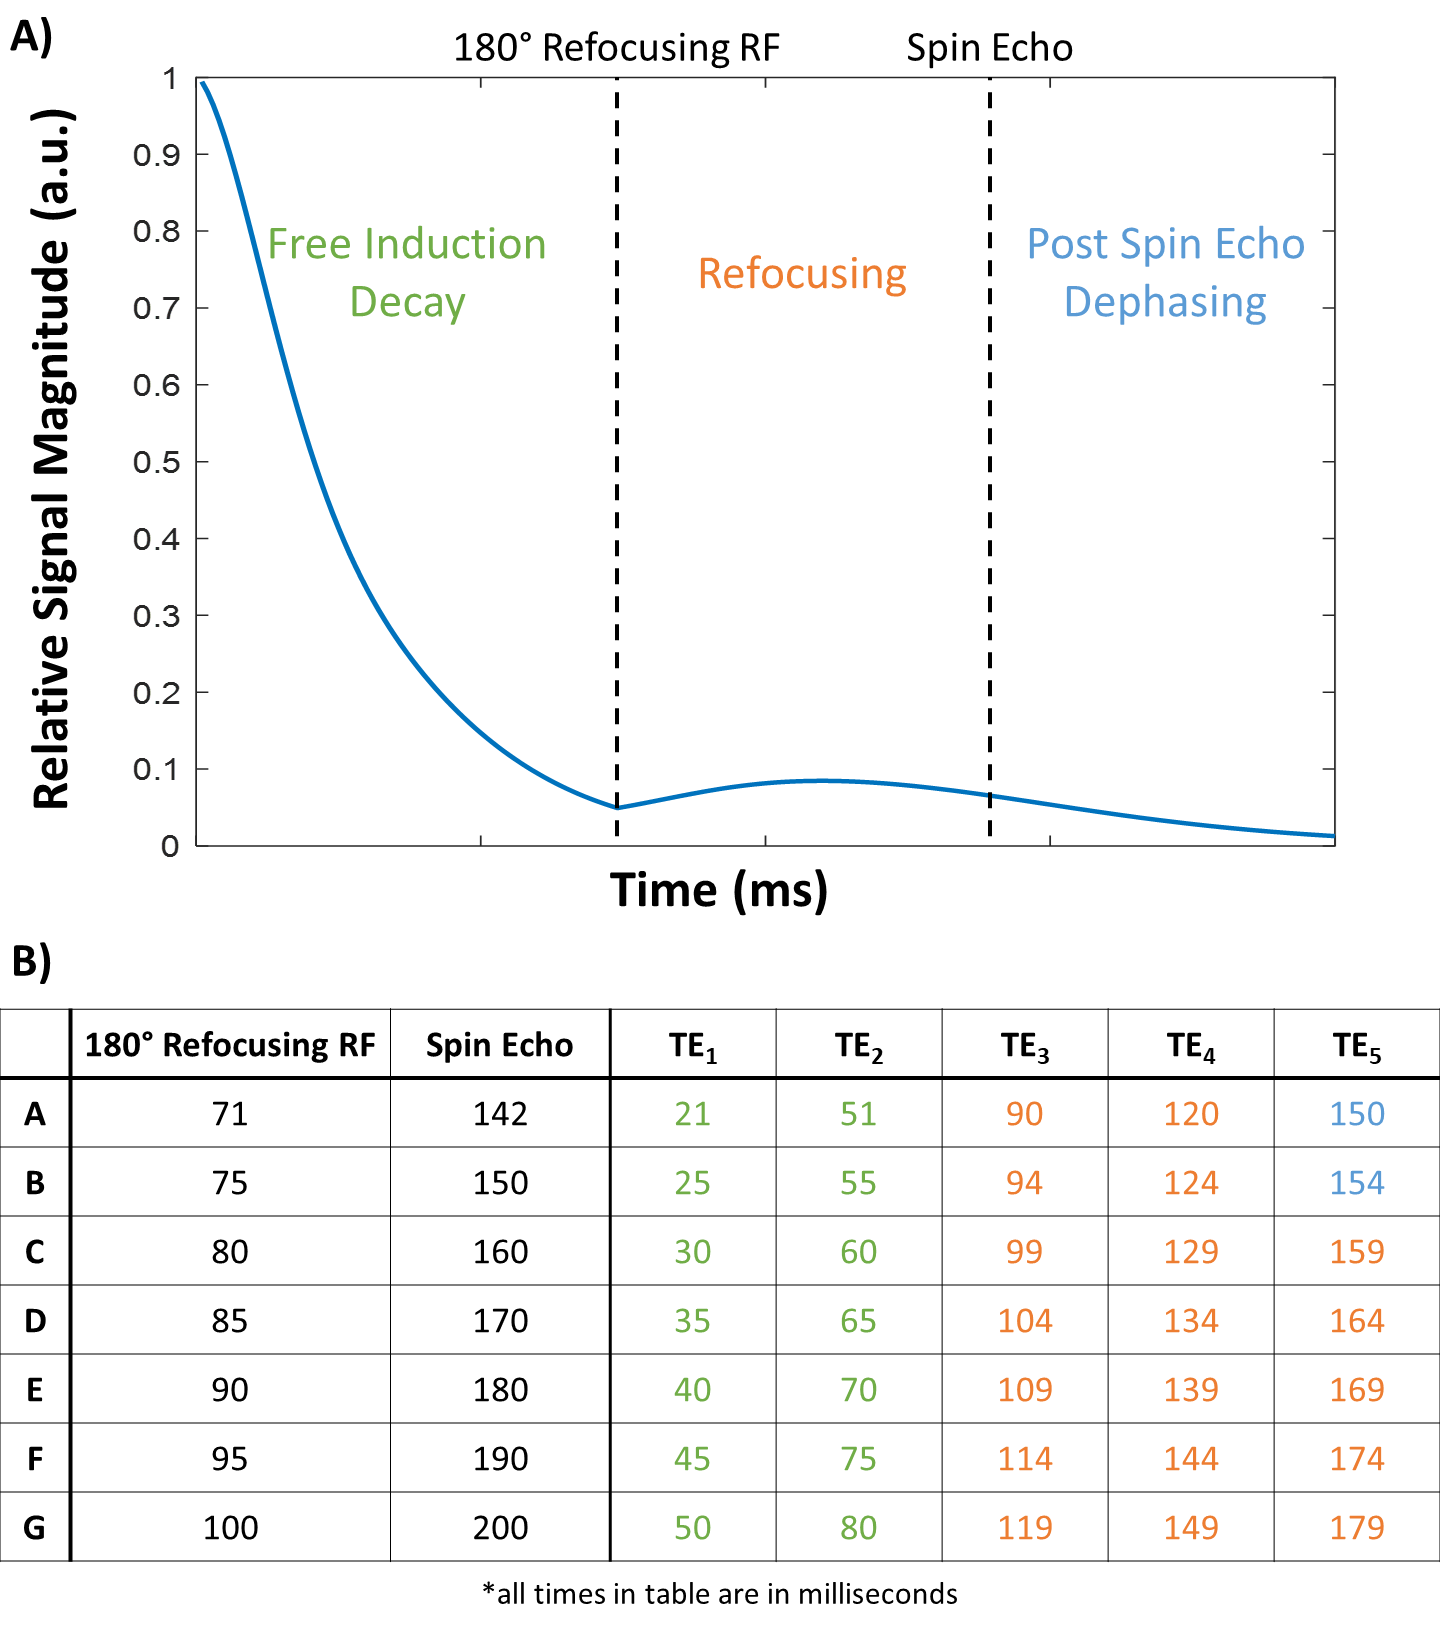
Figure 1. A) Example simulated signal from spin- and gradient-echo (SAGE) sequence. B) Imaging parameters implemented in simulations and in vivo with colors indicating whether the sampled echo time is in the free induction decay (green), refocusing (orange), or post spin echo dephasing (blue) regime.
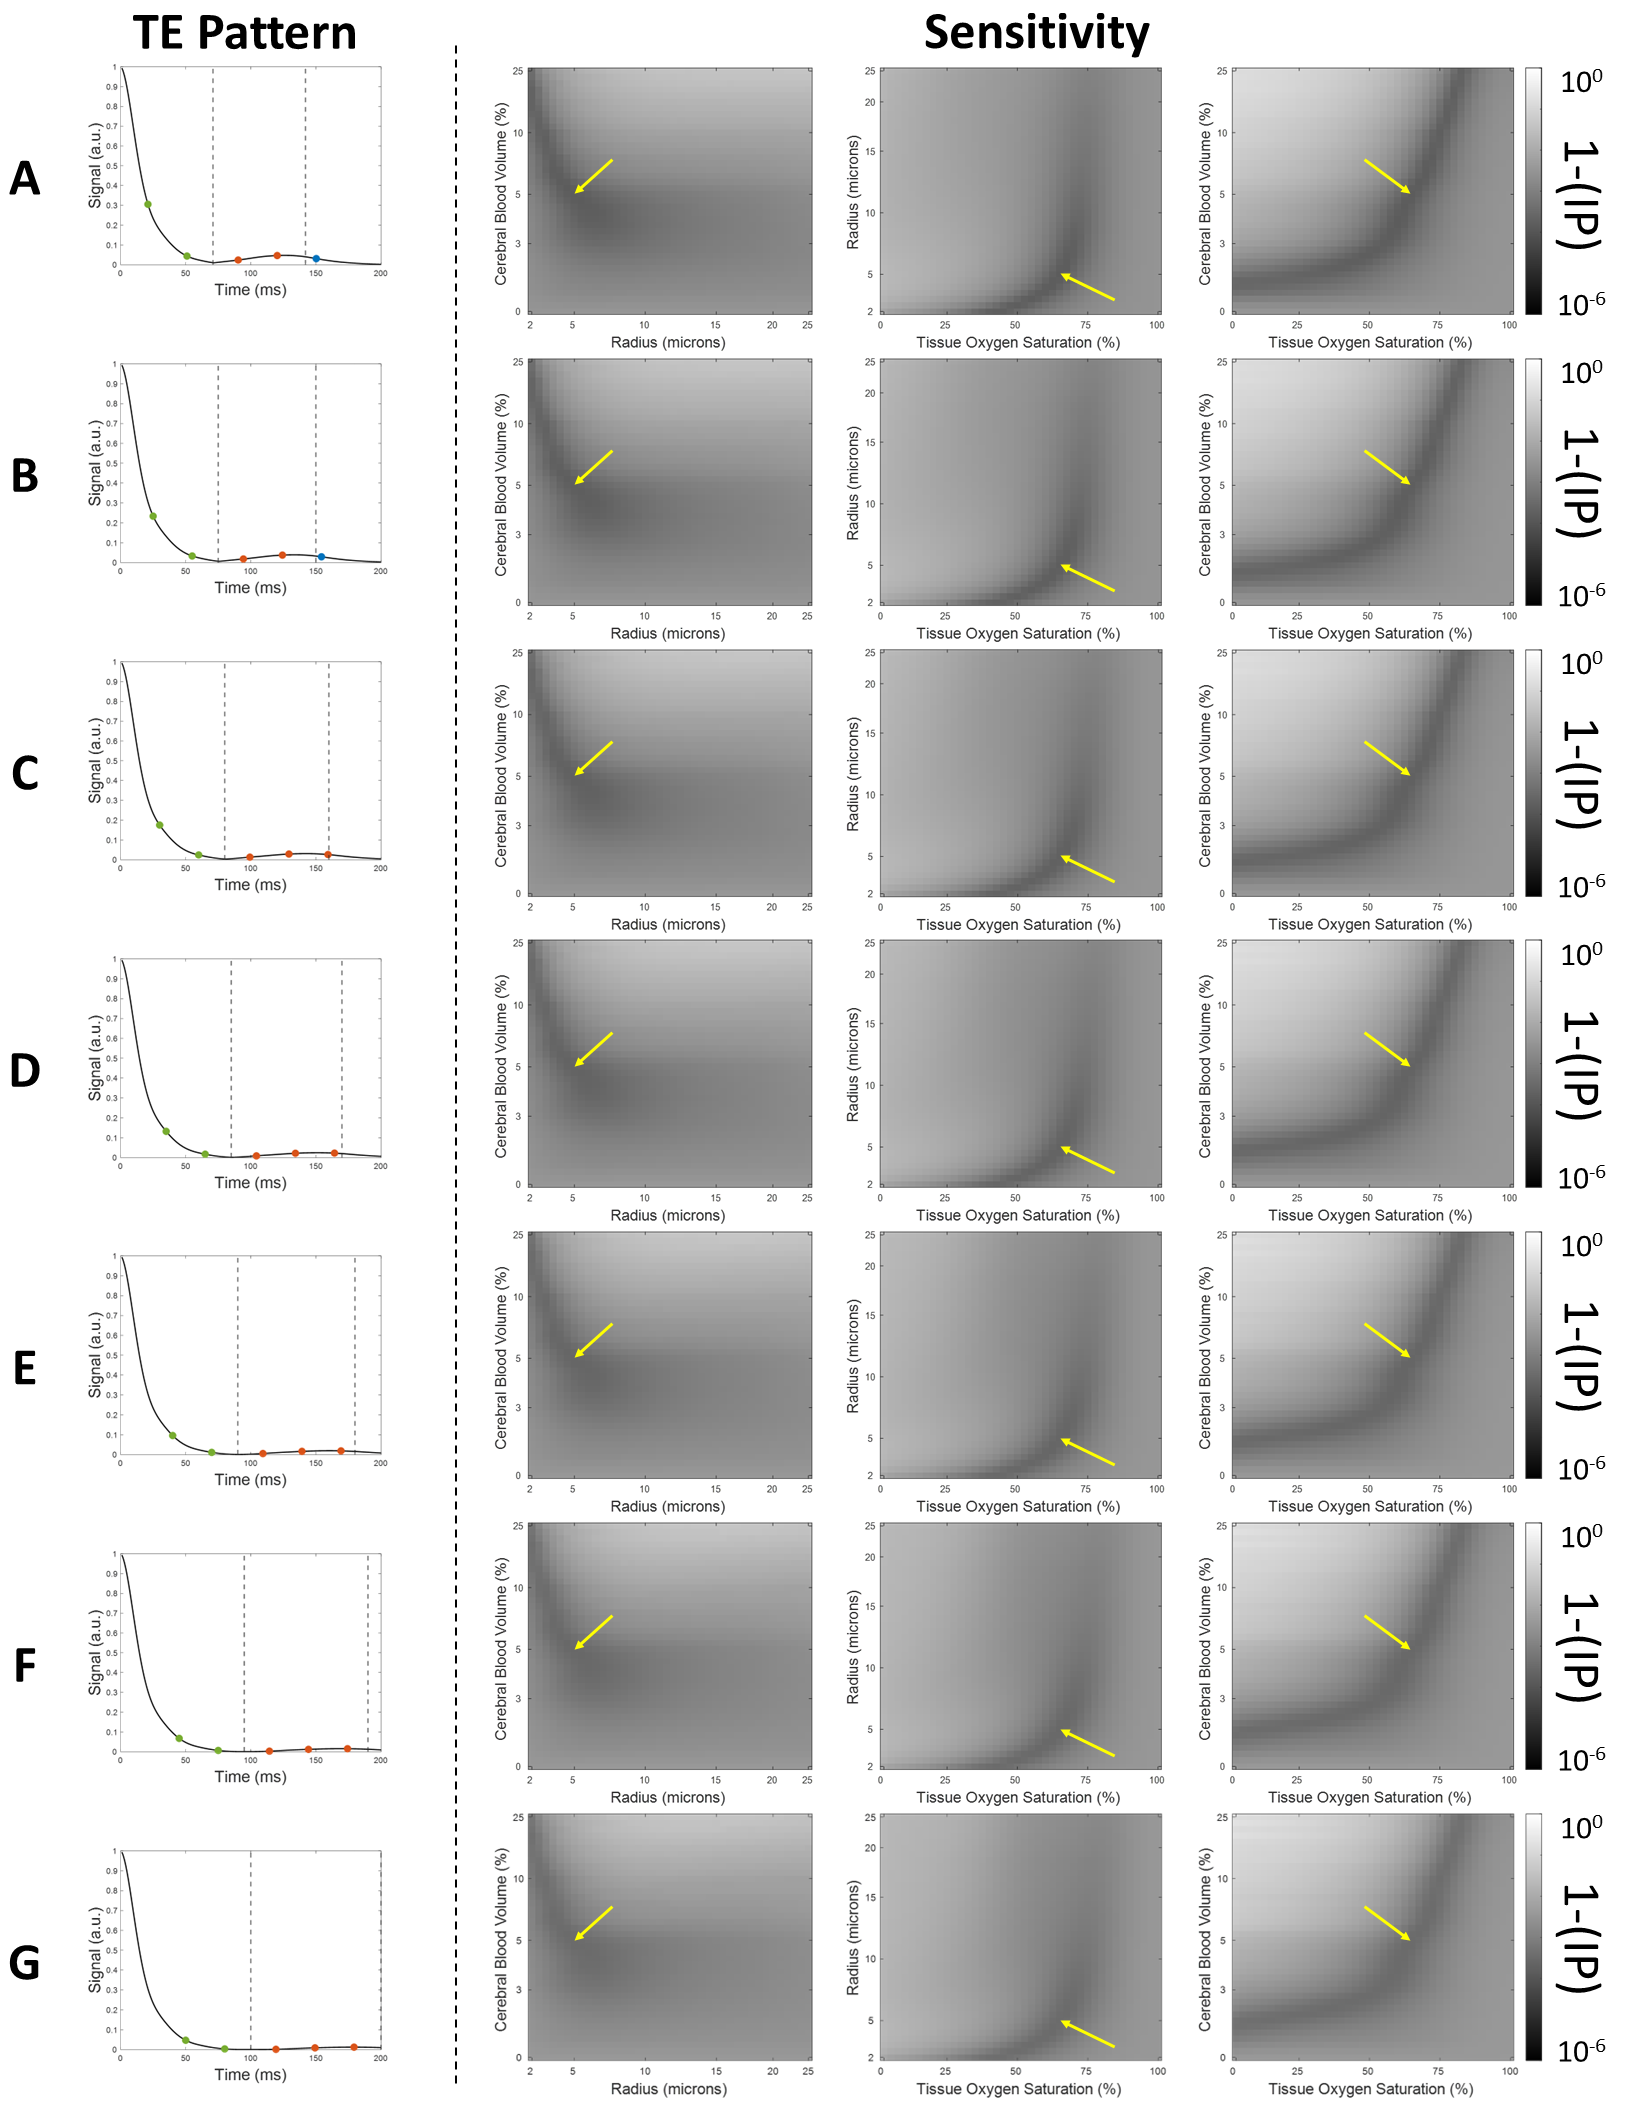
Figure 2. Schematic illustrating the TE sampling of each signal progression (left). Average sensitivity plots from a known signal with added noise (SNR=160, 100 repetitions) display the average matching metric between the noisy signal with known parameters and every possible signal in the dictionary. Darker indicates a better match, and the yellow arrows indicated the true parameter values of the noisy signal.
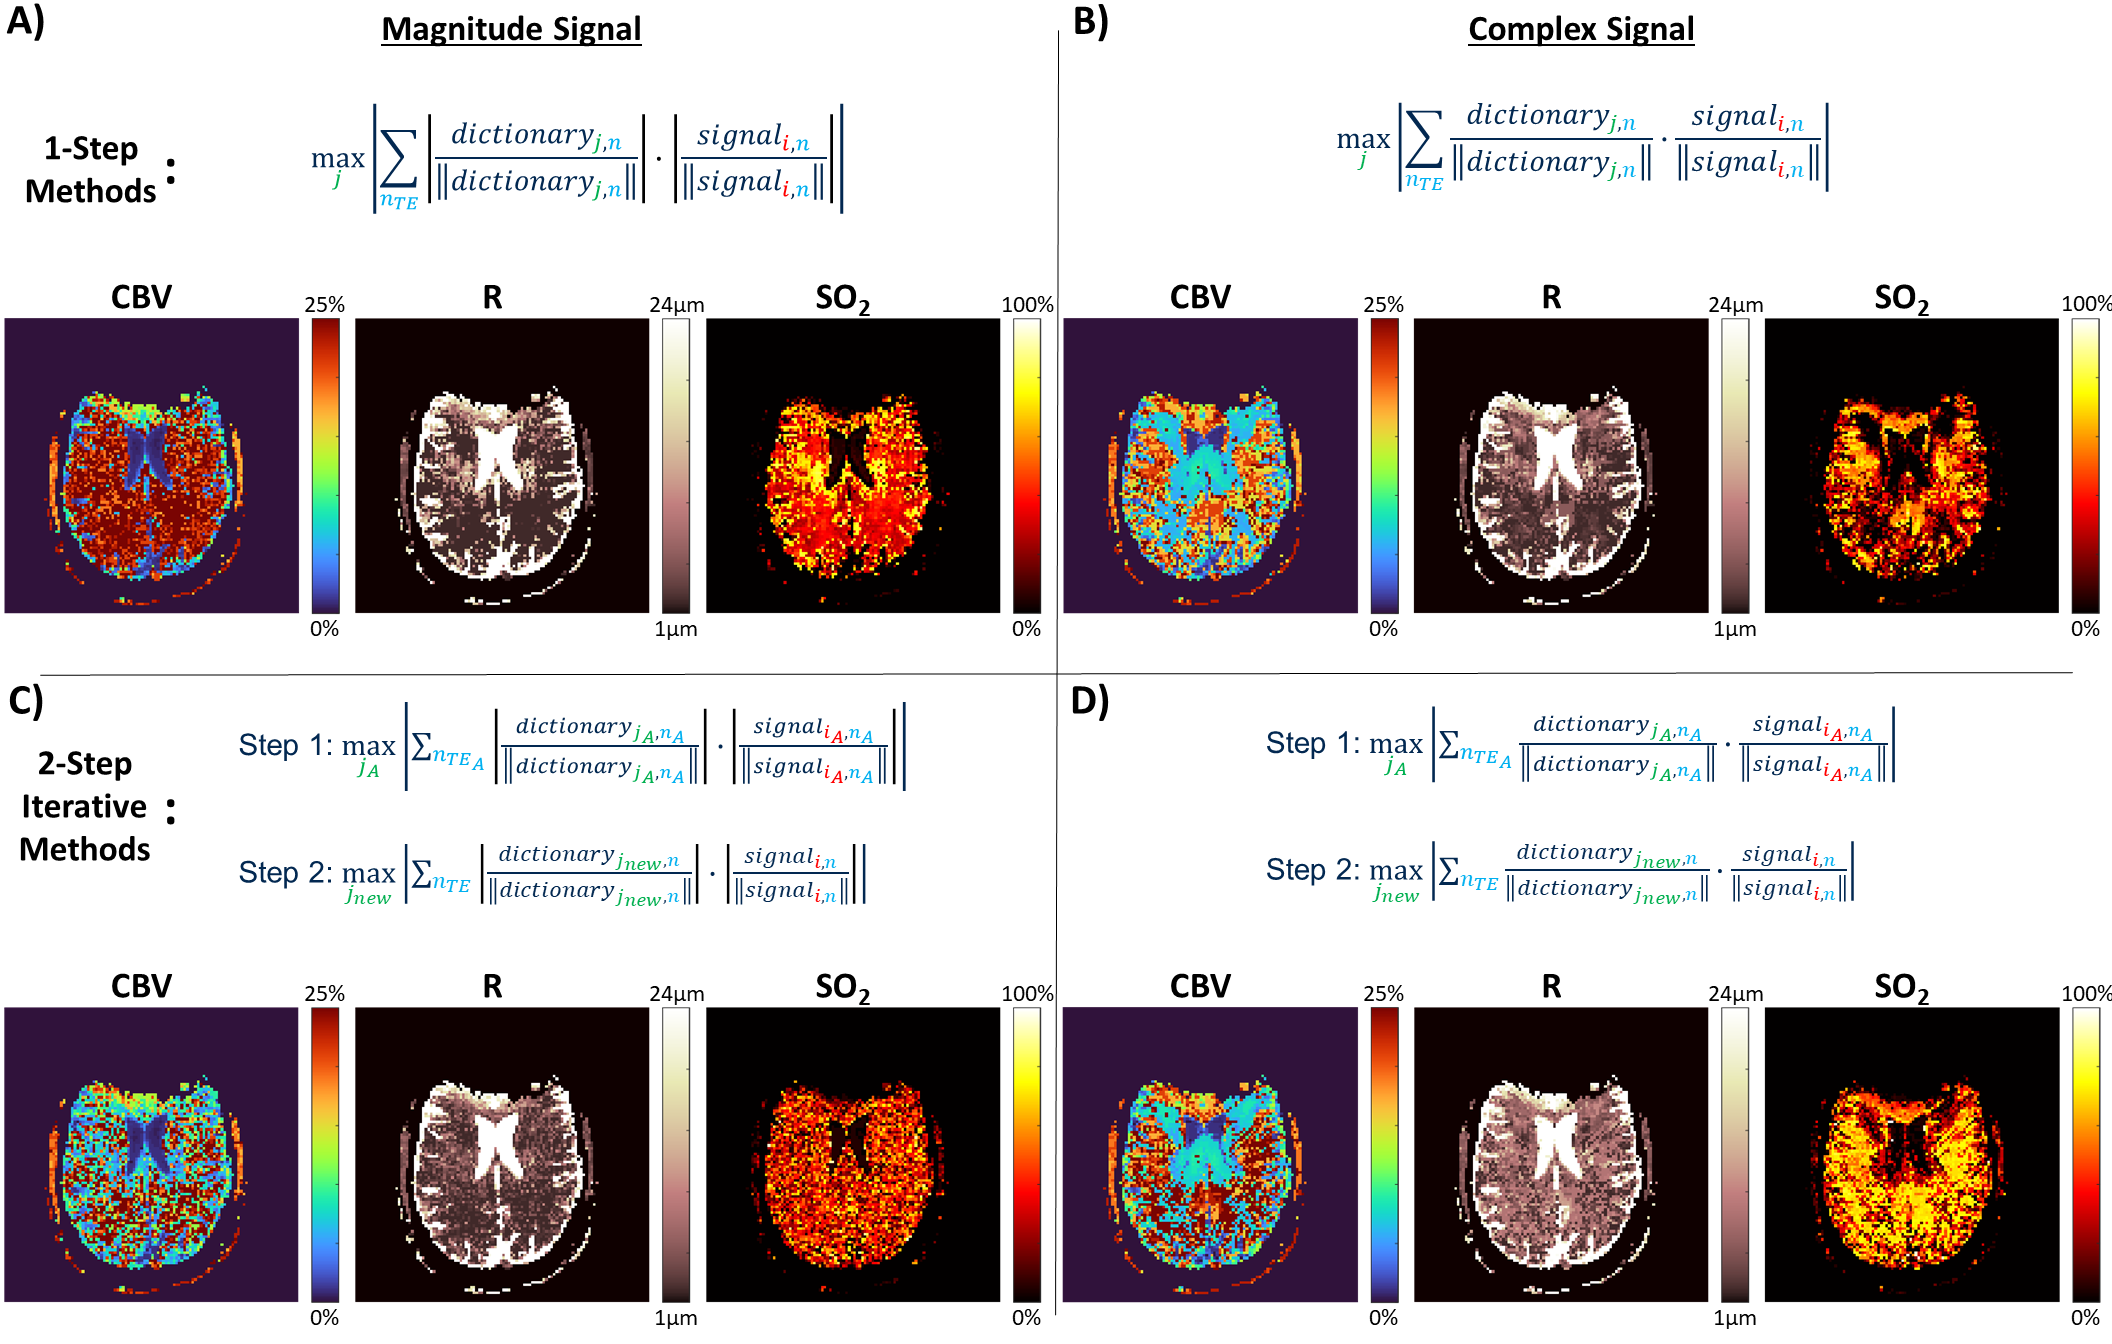
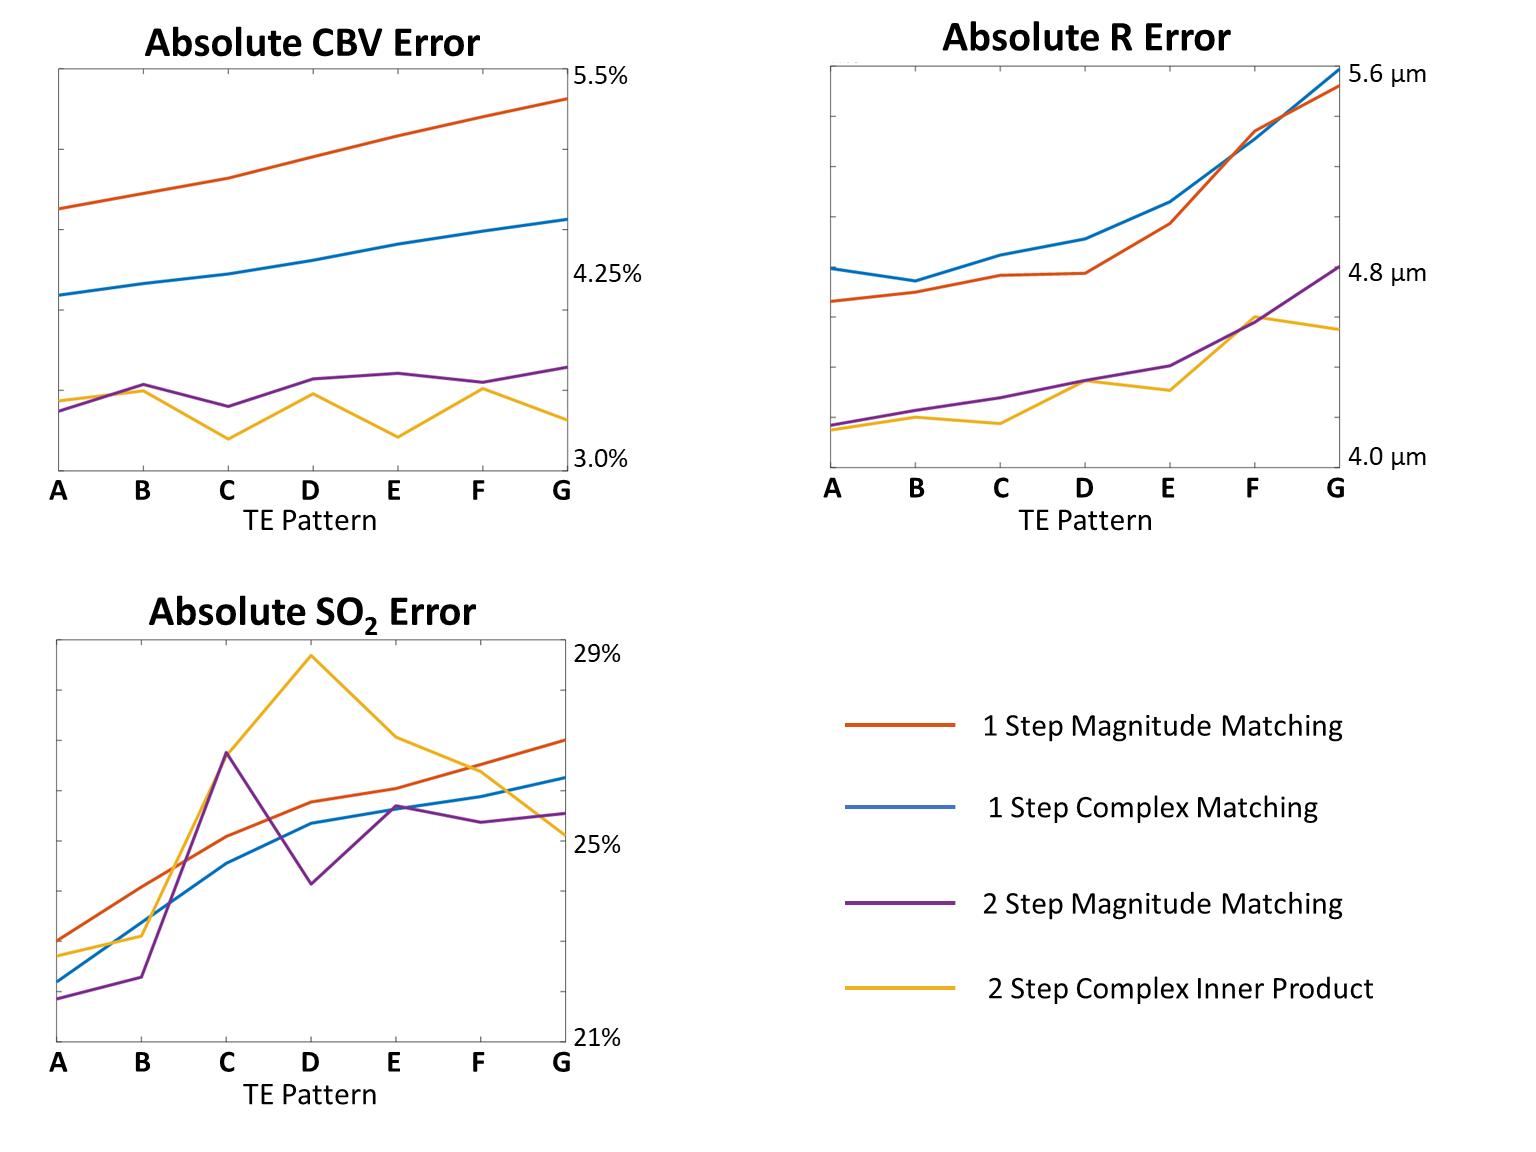
Figure 4. The average absolute error between the estimated cerebral blood volume (CBV; top), microvascular vessel radius (R; middle), and tissue oxygen saturation (SO2; bottom) and the true values using four different matching algorithms and seven TE sampling patterns as outlined in Figure 1B.