0424
Only-Train-Once MR Fingerprinting for B0 and B1 Inhomogeneity Correction in Quantitative Magnetization Transfer Contrast1School of Electrical Engineering, Korea Advanced Institute of Science and Technology, Daejeon, Korea, Republic of, 2Department of Radiology, Johns Hopkins University, Baltimore, MD, United States
Synopsis
Keywords: MR Fingerprinting/Synthetic MR, Machine Learning/Artificial Intelligence, B0 and B1 correction
Magnetization transfer contrast MR fingerprinting (MTC-MRF) enables fast reconstruction of free bulk water and semisolid macromolecules parameters. However, B0 and B1 inhomogeneities that originate from system imperfection can corrupt MR fingerprints, thereby impairing the tissue quantification. We proposed a fast, deep-learning MTC-MRF technique that simultaneously estimates multiple tissue parameters and corrects the effect of B0 and B1 variations. An only-train-once recurrent neural network was designed to perform the fast tissue parameter quantification regardless of MRF acquisition schedule. This allows a dynamic scan-wise linear calibration of the scan parameters using the measured B0 and B1 maps.Introduction
Magnetization transfer contrast MR fingerprinting (MTC-MRF) is a novel technique that estimates multiple tissue parameters of free bulk water and semisolid macromolecule using pseudo-randomized (PR) MRF schedules1-2. Although MRF enables fast and accurate reconstruction of tissue parameters, B0 and B1 inhomogeneities that originate from system imperfections interrupt MRF reconstruction that solves the complex inverse problem of Bloch equations3-4. In particular, RF saturation-encoded MRF schedules are much prone to B1 variation5-7. Therefore, it is crucial to compensate the B0 and B1 variations in MTC- and CEST-MRF imaging. Previously, additionally acquired B0 and B1 maps were used to compensate B0 shifts and B1 scaling factors for the MRF schedule in MRF-SPEM framework8. However, it is challenging to apply aforementioned scheme to a conventional deep neural network because the dataset is constrained to a certain MRF schedule that was already used for training of the network. Recently, we introduced a novel learning-based MTC-MRF technique that quantified tissue parameters regardless of MRF schedule and dubbed Only-Train-Once MRF (OTOM)9. In this study, we developed a linear compensation scheme for B0 and B1 correction on the OTOM framework.Methods
An overview of the OTOM method for B0 and B1 correction is illustrated in Fig. 1. The recurrent neural network (RNN) was trained with millions of different MRF schedules in the training phase, and thus in the test phase, the trained RNN can estimate tissue parameters for any MRF schedule. This allows a dynamic scan-wise modification of the MRF schedule and is utilized to correct B0 and B1 errors. The corrected scan parameters ($$$p_{scan}^{corr}$$$), in lieu of the nominal scan parameters ($$$p_{scan}^{nom}$$$), were calibrated using experimentally obtained ΔB0 and rB1 maps and fed to the trained RNN to estimate the accurate tissue parameter maps (Fig. 1B).Network Training
A recurrent neural network (RNN) was trained to estimate water and MTC parameters in accordance with the MRF schedule. The generation of MRF dataset consists of two steps: 1) sampling scan parameters pscan and tissue parameters ptissue, and 2) synthesizing the MTC-MRF signals using Bloch equations. For training, 80 million combinations of tissue and scan parameters were chosen.
Validation
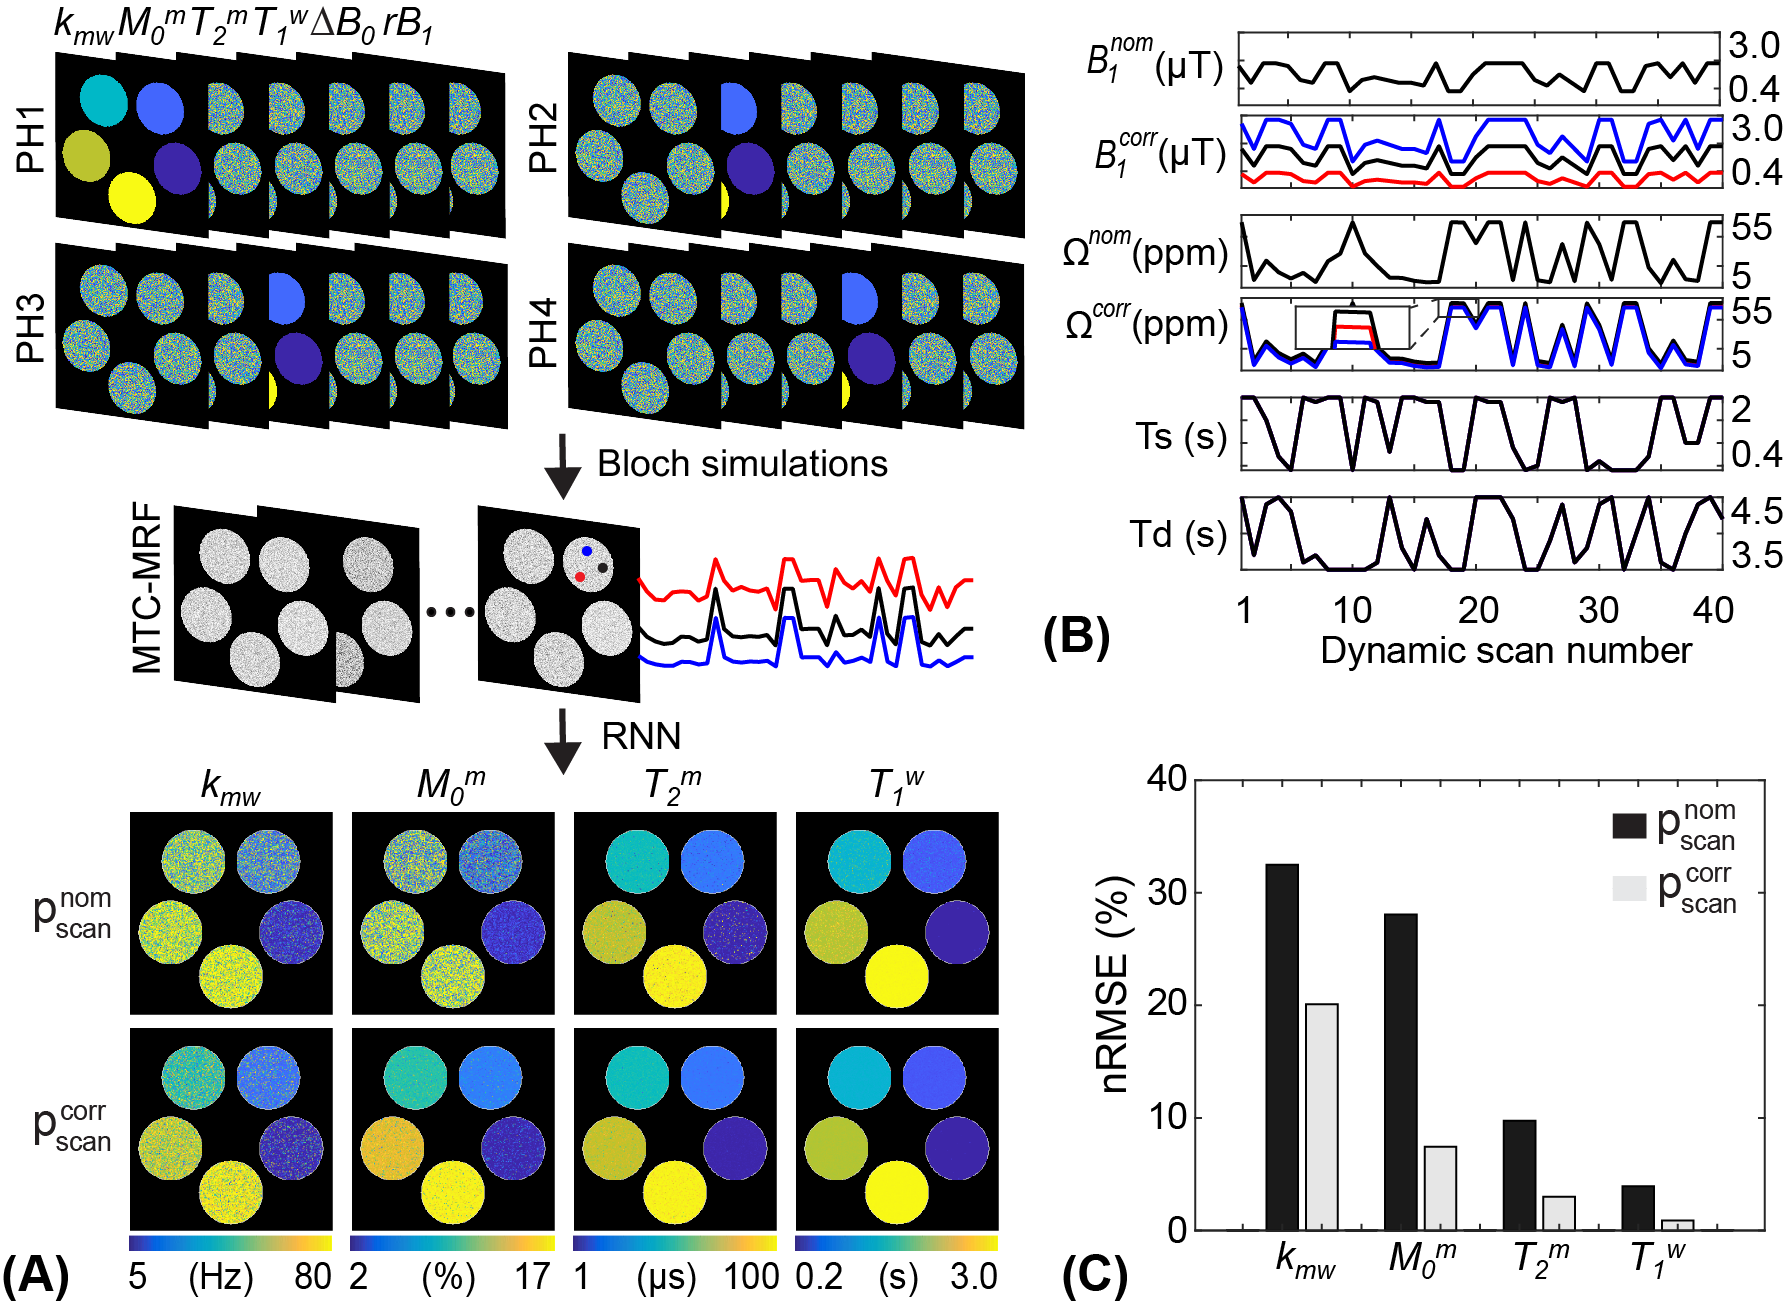
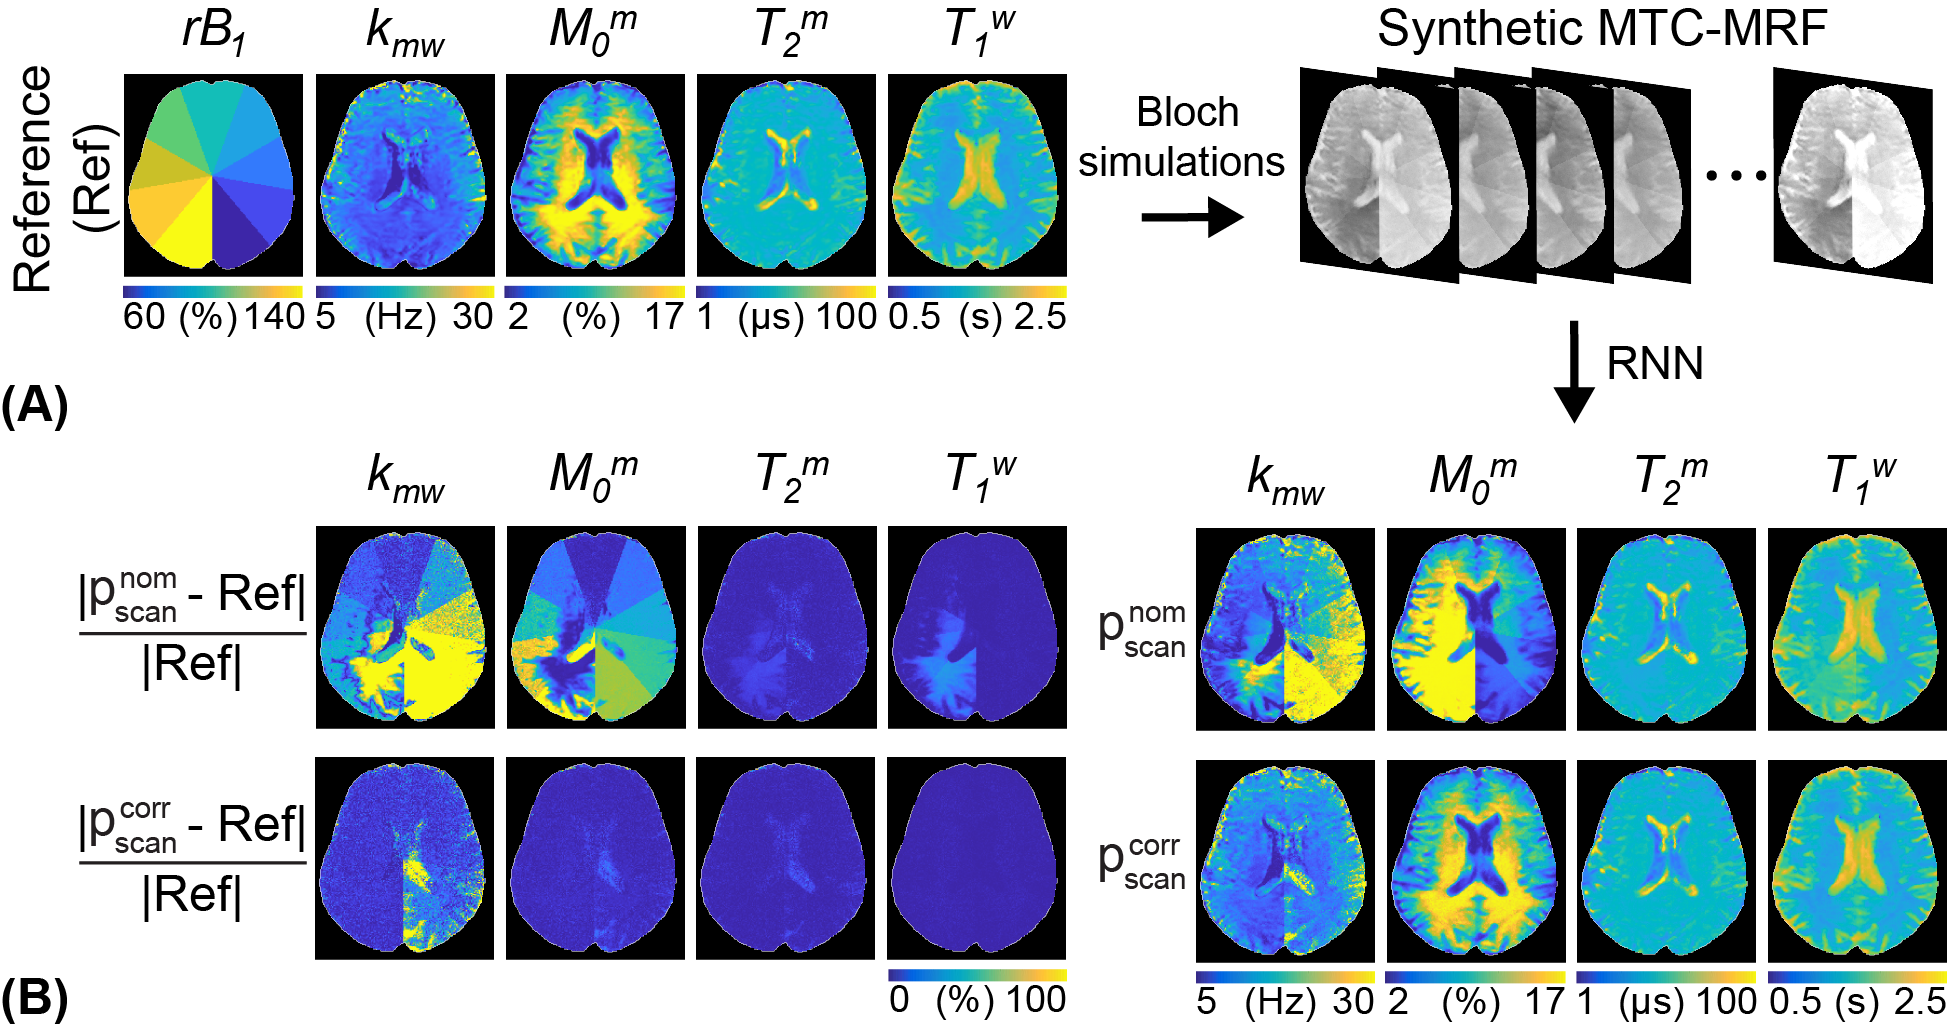
For digital phantom studies, each phantom has five different values for a target tissue parameter and has randomly sampled values for the other parameters including ΔB0 and rB1 (-1.2 to 1.2 ppm for ΔB0 and 50 to 150% for rB1) as shown in Fig. 3A. For validation with synthetic MRI analysis (due to the lack of an objective ground truth in vivo), the tissue parameter maps estimated using RNN network with the PR schedule (forty dynamic scans) were defined as the reference (Fig. 4A). In addition, the synthetic rB1 map was generated to have nine different values. By using the four digital phantoms and the reference maps, synthetic MTC-MRF images were generated via the two-pool Bloch equation, which were fed to the RNN model for tissue quantification. For in vivo studies, eight healthy volunteers (three females and five males; age 38.1 ± 4.1) were scanned on a 3T MRI scanner after written informed consent was obtained with the approval of the institutional review board.
Results and Discussion
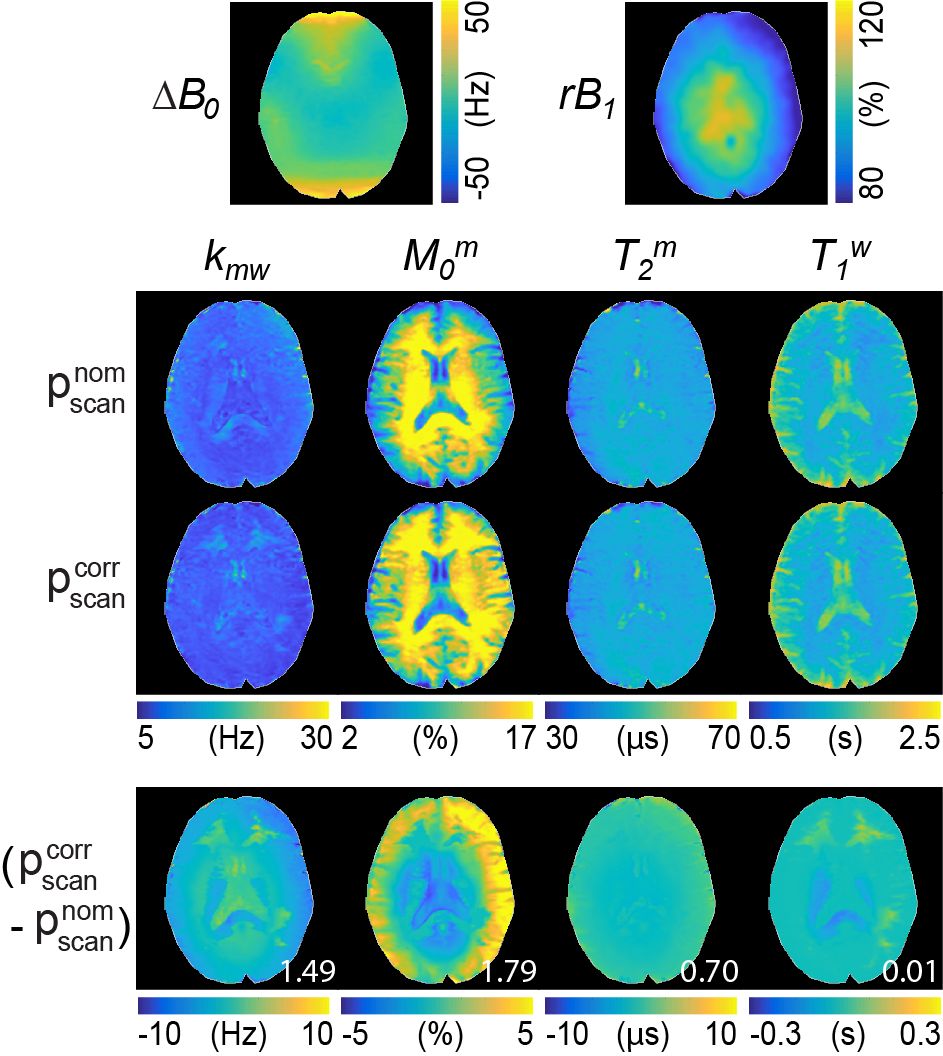
The corrected schedule ($$$p_{scan}^{corr}$$$) was calculated by scaling saturation power (B1) with the relative B1 (rB1) map and by shifting frequency offset with the ΔB0 map from the nominal schedule ($$$p_{scan}^{nom}$$$) as shown in Fig. 3B. The estimated tissue parameter maps using were much more accurate than those using for all tissue parameters (Fig. 3C). The nRMSE values with and were 32.5% and 20.1% for Kmw, 28.1% and 7.4% for M0m, 9.7% and 3.0% for T2m, and 3.9% and 0.9% for T1w, respectively. The synthetic MRI analysis for the proposed correction method is shown in Fig. 4A. An excellent agreement was observed between the reference tissue parameter maps and the estimated maps using $$$p_{scan}^{corr}$$$. However, a poor agreement was observed between the reference maps and the estimated maps using $$$p_{scan}^{nom}$$$. The Pearson correlation coefficients for and were 0.742 and 0.253 for Kmw, 0.995 and 0.503 for Mom, 0.985 and 0.976 for T2m, and 0.998 and 0.923 for T1w, respectively. Especially, the B1 errors highly impaired the exchange rate and the concentration maps, whereas the free bulk water T1 and the macromolecule T2 were relatively robust to the B1 variations. Figure 5 shows the quantitative water and MTC parameter maps obtained from the OTOM reconstruction in accordance with the $$$p_{scan}^{nom}$$$ and $$$p_{scan}^{corr}$$$ and their difference images. The B1 inhomogeneity pattern obviously reflected the corrected tissue parameter maps, particularly as seen in the difference images of the exchange rate and the concentration, whereas the B0 inhomogeneity had negligible effect on the MTC-MRF reconstruction. However, the B0 inhomogeneity could result in more significant errors at frequency offsets close to the water resonance (e.g., CEST).Conclusions
We developed a fast, deep-learning MRF approach that simultaneously estimates multiple tissue parameters and corrects B0 and B1 errors. The proposed method could achieve a high degree of accuracy for MTC-MRF reconstruction in the presence of severe B0 and B1 inhomogeneities. The only-train-once deep-learning framework can be further combined with any conventional MRF or CEST-MRF method, and improve the reconstruction accuracy of tissue parameter maps.Acknowledgements
This work was supported, in part, by the National Institute of Health and Korea Medical Device Development Fund.
References
1. Kim B, Schar M, Park H, Heo HY. A deep learning approach for magnetization transfer contrast MR fingerprinting and chemical exchange saturation transfer imaging. Neuroimage 2020;221:117165.
2. Kang B, Kim B, Schar M, Park H, Heo HY. Unsupervised learning for magnetization transfer contrast MR fingerprinting: Application to CEST and nuclear Overhauser enhancement imaging. Magn Reson Med 2021;85(4):2040-2054.
3. Chen Y, Jiang Y, Pahwa S, Ma D, Lu L, Twieg MD, Wright KL, Seiberlich N, Griswold MA, Gulani V. MR Fingerprinting for Rapid Quantitative Abdominal Imaging. Radiology 2016;279(1):278-286.
4. Ma D, Coppo S, Chen Y, McGivney DF, Jiang Y, Pahwa S, Gulani V, Griswold MA. Slice profile and B1 corrections in 2D magnetic resonance fingerprinting. Magn Reson Med 2017;78(5):1781-1789.
5. Ropele S, Filippi M, Valsasina P, Korteweg T, Barkhof F, Tofts PS, Samson R, Miller DH, Fazekas F. Assessment and correction of B1-induced errors in magnetization transfer ratio measurements. Magn Reson Med 2005;53(1):134-140.
6. Windschuh J, Zaiss M, Meissner JE, Paech D, Radbruch A, Ladd ME, Bachert P. Correction of B1-inhomogeneities for relaxation-compensated CEST imaging at 7 T. NMR Biomed 2015;28(5):529-537.
7. Schuenke P, Windschuh J, Roeloffs V, Ladd ME, Bachert P, Zaiss M. Simultaneous mapping of water shift and B1 (WASABI)-Application to field-Inhomogeneity correction of CEST MRI data. Magn Reson Med 2017;77(2):571-580.
8. Heo HY, Han Z, Jiang S, Schar M, van Zijl PCM, Zhou J. Quantifying amide proton exchange rate and concentration in chemical exchange saturation transfer imaging of the human brain. Neuroimage 2019;189:202-213.
9. Kang B, Heo H-Y, Park H. Only-Train-Once MR Fingerprinting for Magnetization Transfer Contrast Quantification. Medical Image Computing and Computer Assisted Intervention – MICCAI 2022; 2022; Cham. Springer Nature Switzerland. p 387-396. (Medical Image Computing and Computer Assisted Intervention – MICCAI 2022).
Figures
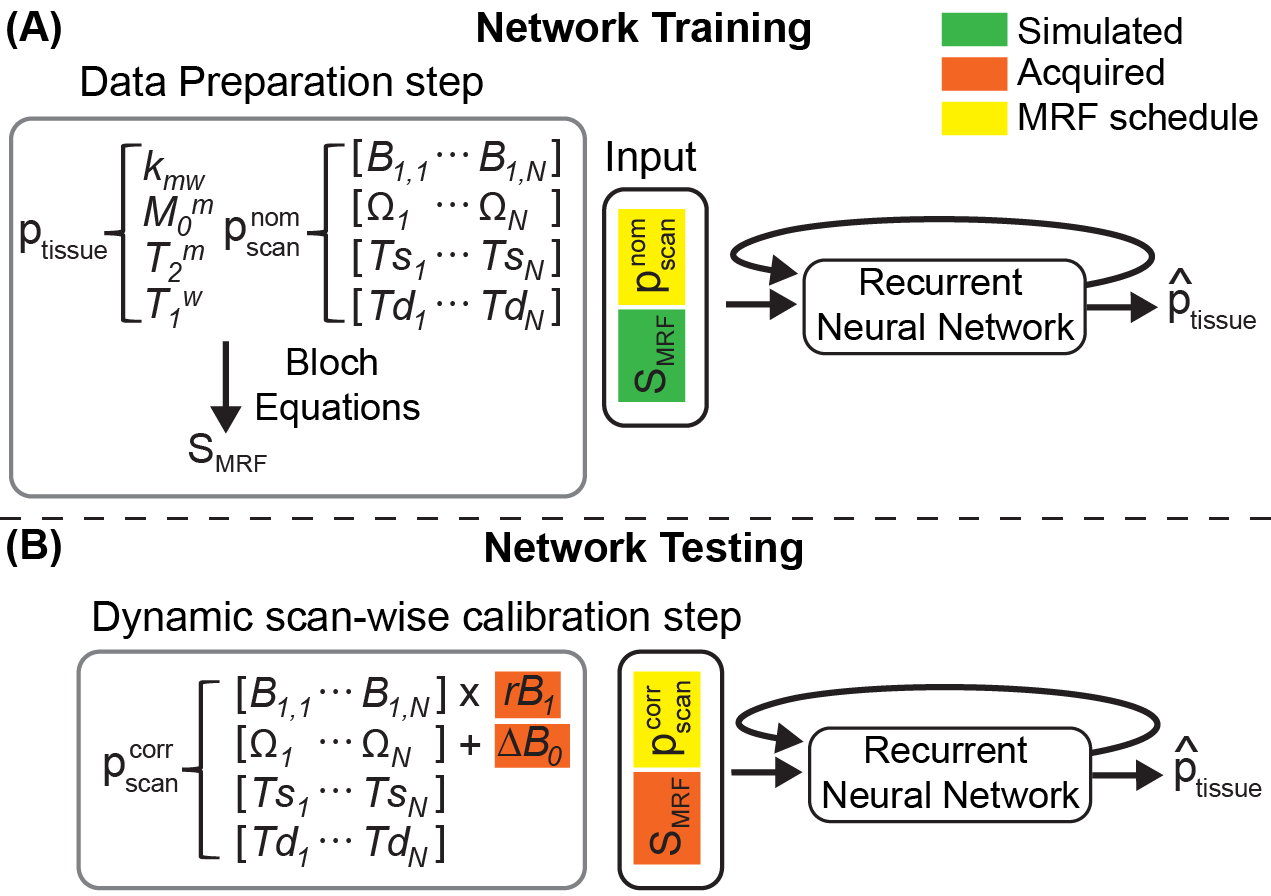
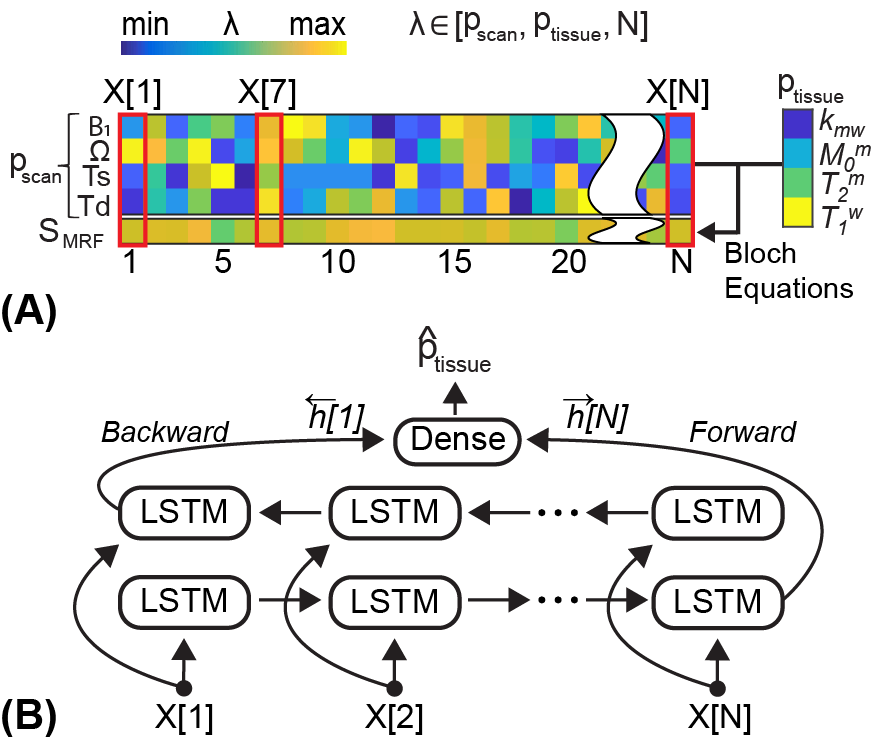
Figure 2. (A) The illustration of the data preparation step. The tissue and scan parameters including the length (N) were randomly sampled each time and used to generate the MR fingerprints (SMRF) through Bloch equations. The input vector (X) consists of pscan and SMRF. (B) The LSTM (Long short-term memory) model takes the input vector of each time-point (X[n]) and updates the hidden state. The bi-directional LSTM processes the input sequence in two ways: moving forward from the start to the end of the sequence, and vice versa.