0417
White Matter Neurometabolite Vulnerability Predicts Cognitive Decline in Alzheimer’s Disease: A High-Resolution 3D 1H-MRSI Study1School of Biomedical Engineering, Shanghai Jiao Tong University, Shanghai, China, 2Department of Nuclear Medicine, Ruijin Hospital, Shanghai Jiao Tong University of Medicine, Shanghai, China, 3Beckman Institute for Advanced Science and Technology, University of Illinois at Urbana-Champaign, Urbana, IL, United States, 4Department of Electrical and Computer Engineering, University of Illinois at Urbana-Champaign, Urbana, IL, United States, 5National Center for Supercomputing Applications, University of Illinois at Urbana-Champaign, Urbana, IL, United States, 6Department of Neurology and Institute of Neurology, Ruijin Hospital, Shanghai Jiao Tong University of Medicine, Shanghai, China
Synopsis
Keywords: Alzheimer's Disease, Spectroscopy
White matter (WM) damage plays an important role in AD and different mechanisms have been suggested for different brain areas from postmortem studies. Understanding the spatial patterns of pathological changes in WM is of great importance in AD diagnosis. Using a high-resolution 3D MRSI technique, we investigated the spatial patterns of neurometabolic changes in WM regions. We firstly derived neurometabolite vulnerability maps in AD, showing spatially varying patterns of NAA reduction and mIn elevation in WM regions, in distinct association with gray matter volume or Aβ deposition, respectively. The neurometabolic biomarkers showed improved prediction of cognitive decline of AD patients.Introduction
White matter (WM) damage is frequently found in AD patients and is closely related to patient cognitive deficits1. Despite the findings of reduced WM integrity in AD characterized by diffusion MRI2, the underlying pathophysiological changes remain elusive. Postmortem studies showed different mechanisms involved in distinct brain regions. For example, loss of myelin in the temporal lobes suggests a Wallerian degeneration secondary to neuronal damage, while increase in reactive astrocytes in the frontal lobes might reflect pathological deposition of Aβ3. Understanding the stereotypical spatial patterns of these pathological changes is of great importance in the diagnosis and prognosis of AD, but has been limited to postmortem examinations due to the lack of effective imaging technology. MRSI can provide in vivo measurements of neurometabolites, including N-acetylaspartate (NAA) as a marker for neuronal/axonal integrity and myo-inositol (mIn) as a marker for astrogliosis4. Nonetheless, long acquisition time, poor spatial resolution, and narrow coverage have limited its clinical applications in AD. Recently, a fast high-resolution 3D 1H-MRSI technology, known as SPICE (SPectroscopic Imaging by exploiting spatiospectral CorrElation)5–8, has been developed, which enables whole-brain mapping of neurometabolites at 2×3×3 mm3 nominal resolution in an 8-min scan. In this study, we used SPICE to investigate the spatial patterns of neurometabolic changes in WM regions and derived, for the first time, a neurometabolic vulnerability map in AD. The relationship between theWM neurometabolic vulnerability and cortical Aβ deposition, gray matter volume (GMV) as well as their predictability in cognitive decline of AD patients were also investigated.Methods
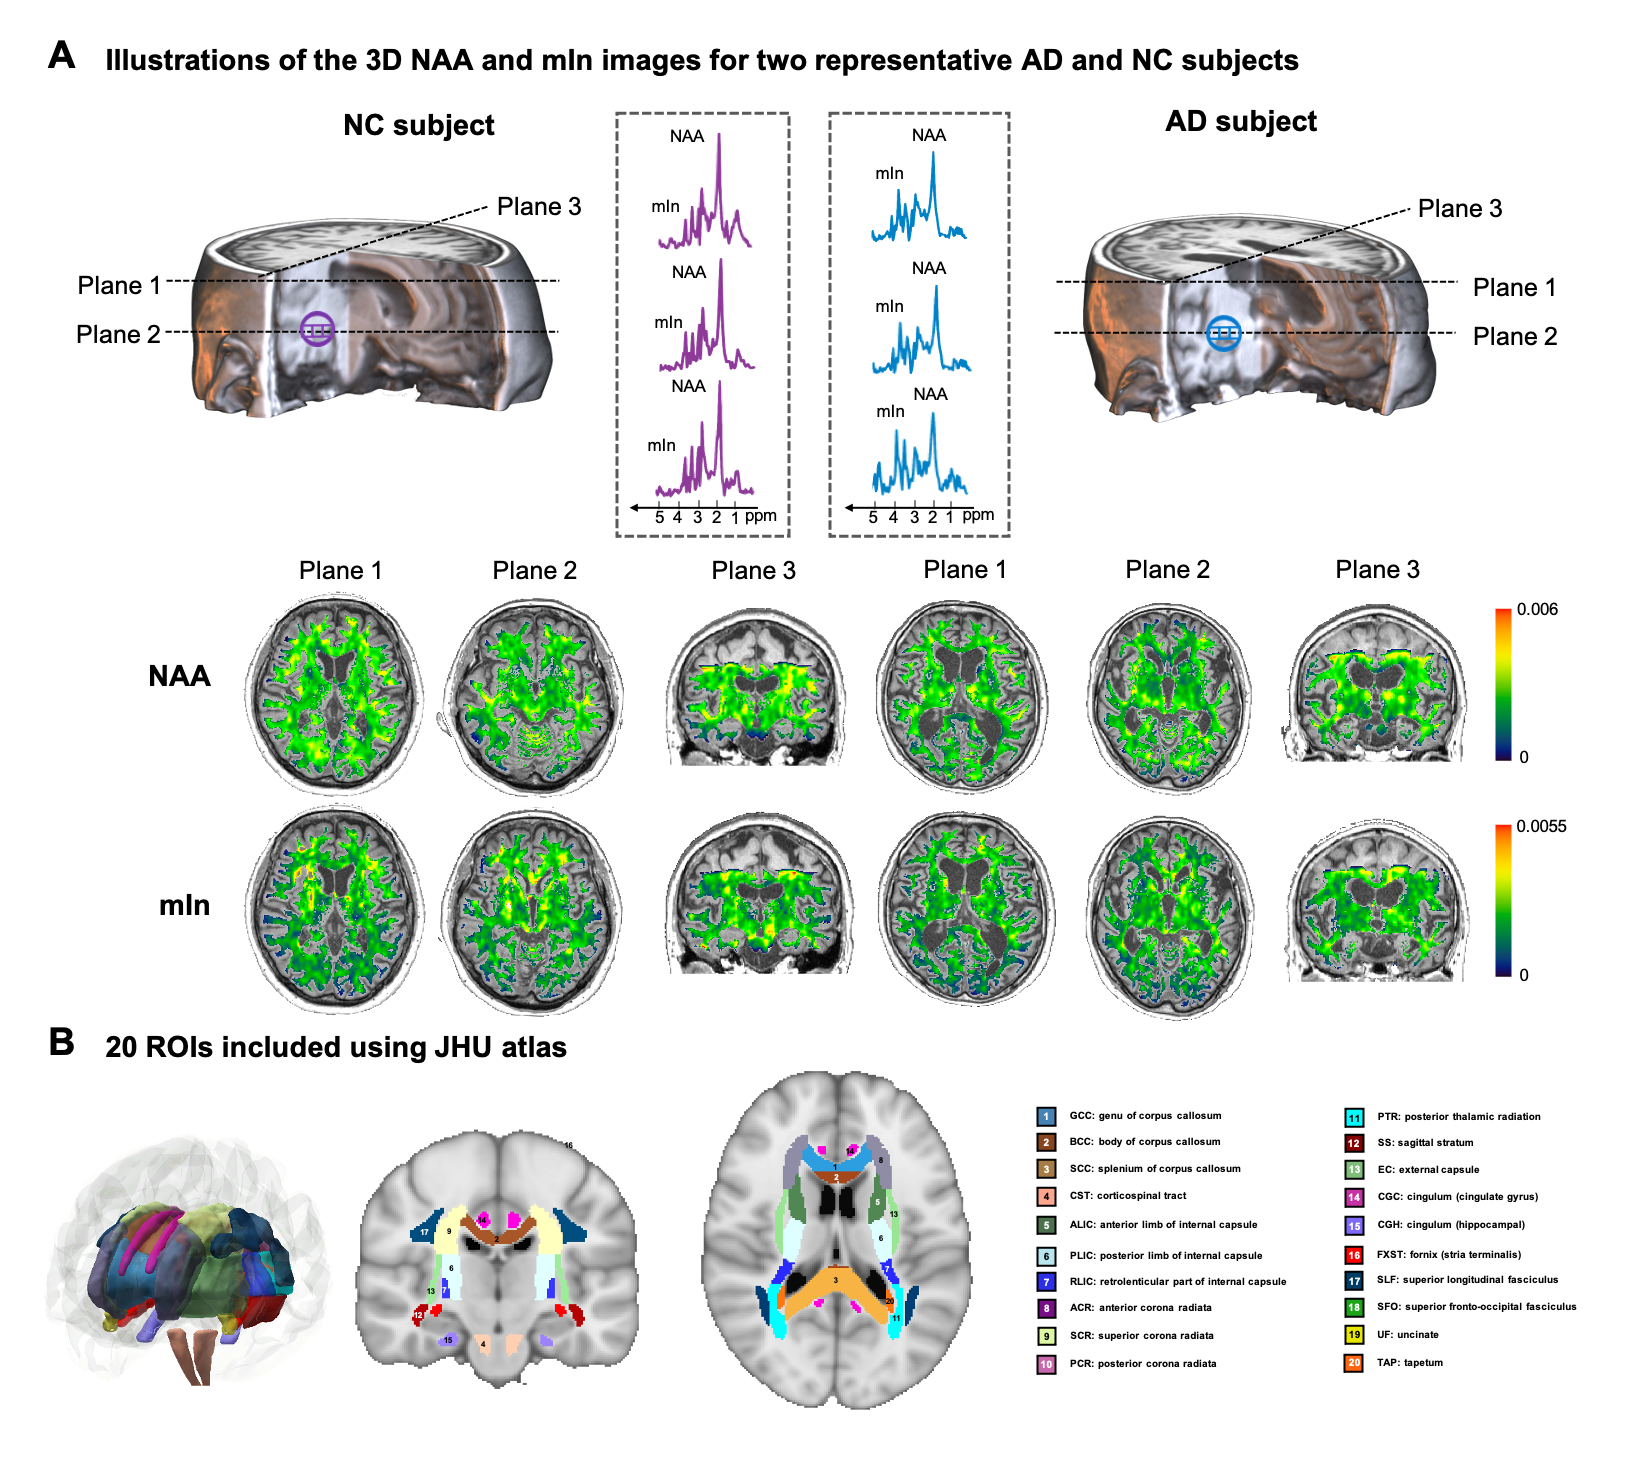
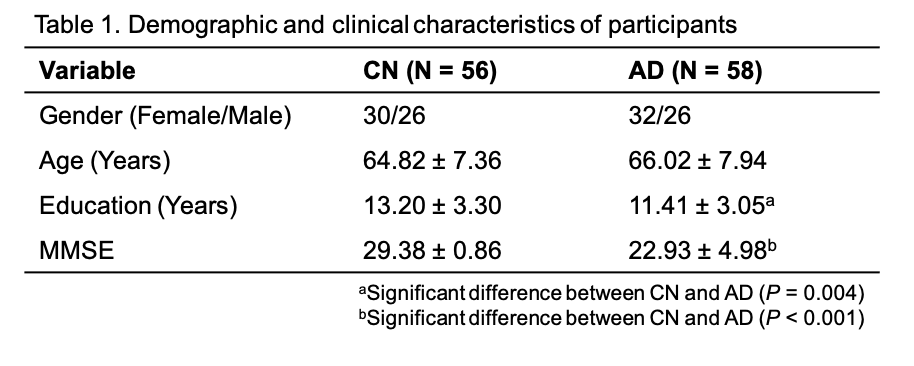
Fifty-eight AD patients and 56 cognitive normal (CN) subjects were enrolled in our study (Table 1). All the images were acquired on a 3T PET/MR scanner (Biograph mMR, Siemens Healthcare, Erlangen, Germany). The study was approved by the IRB of Ruijin Hospital, Shanghai, China. The experimental protocols for MR scans included high-resolution MRSI using SPICE (2.0×3.0×3.0 mm3; FOV = 256×256×96/160 mm3; TR/TE = 160/1.6 ms; scan time = 8 minutes) and T1w MPRAGE imaging (0.5×0.5×1.0 mm3; TR/TE = 1900/2.4 ms; FOV = 256×256×192 mm3). Neurometabolite maps were obtained using the standard processing pipeline of SPICE5–8. The PET images were acquired at 45~60 mins post a bolus injection of 18F-AV-45 at 3.7 MBq/kg (2.1×2.1×2.0 mm3, matrix size = 344×344, scan time = 15 minutes). Aβ deposition was quantified by a standard uptake value ratio (SUVR) map with the whole cerebellum as the reference region.All MRSI and PET images were coregistered to the T1w images. To extract the neurometabolite concentrations within WM regions, we used 20 WM regions of interest (ROIs) defined in JHU atlas and warped the MRSI maps to MNI152 space (Figure 1B). We used ComBat to harmonize the variance between different FOVs for neurometabolites9. To measure the GMV and Aβ deposition level, we extracted 34 cortical and 6 subcortical ROIs defined by Desikan-Killarny atlas using Freesurfer.
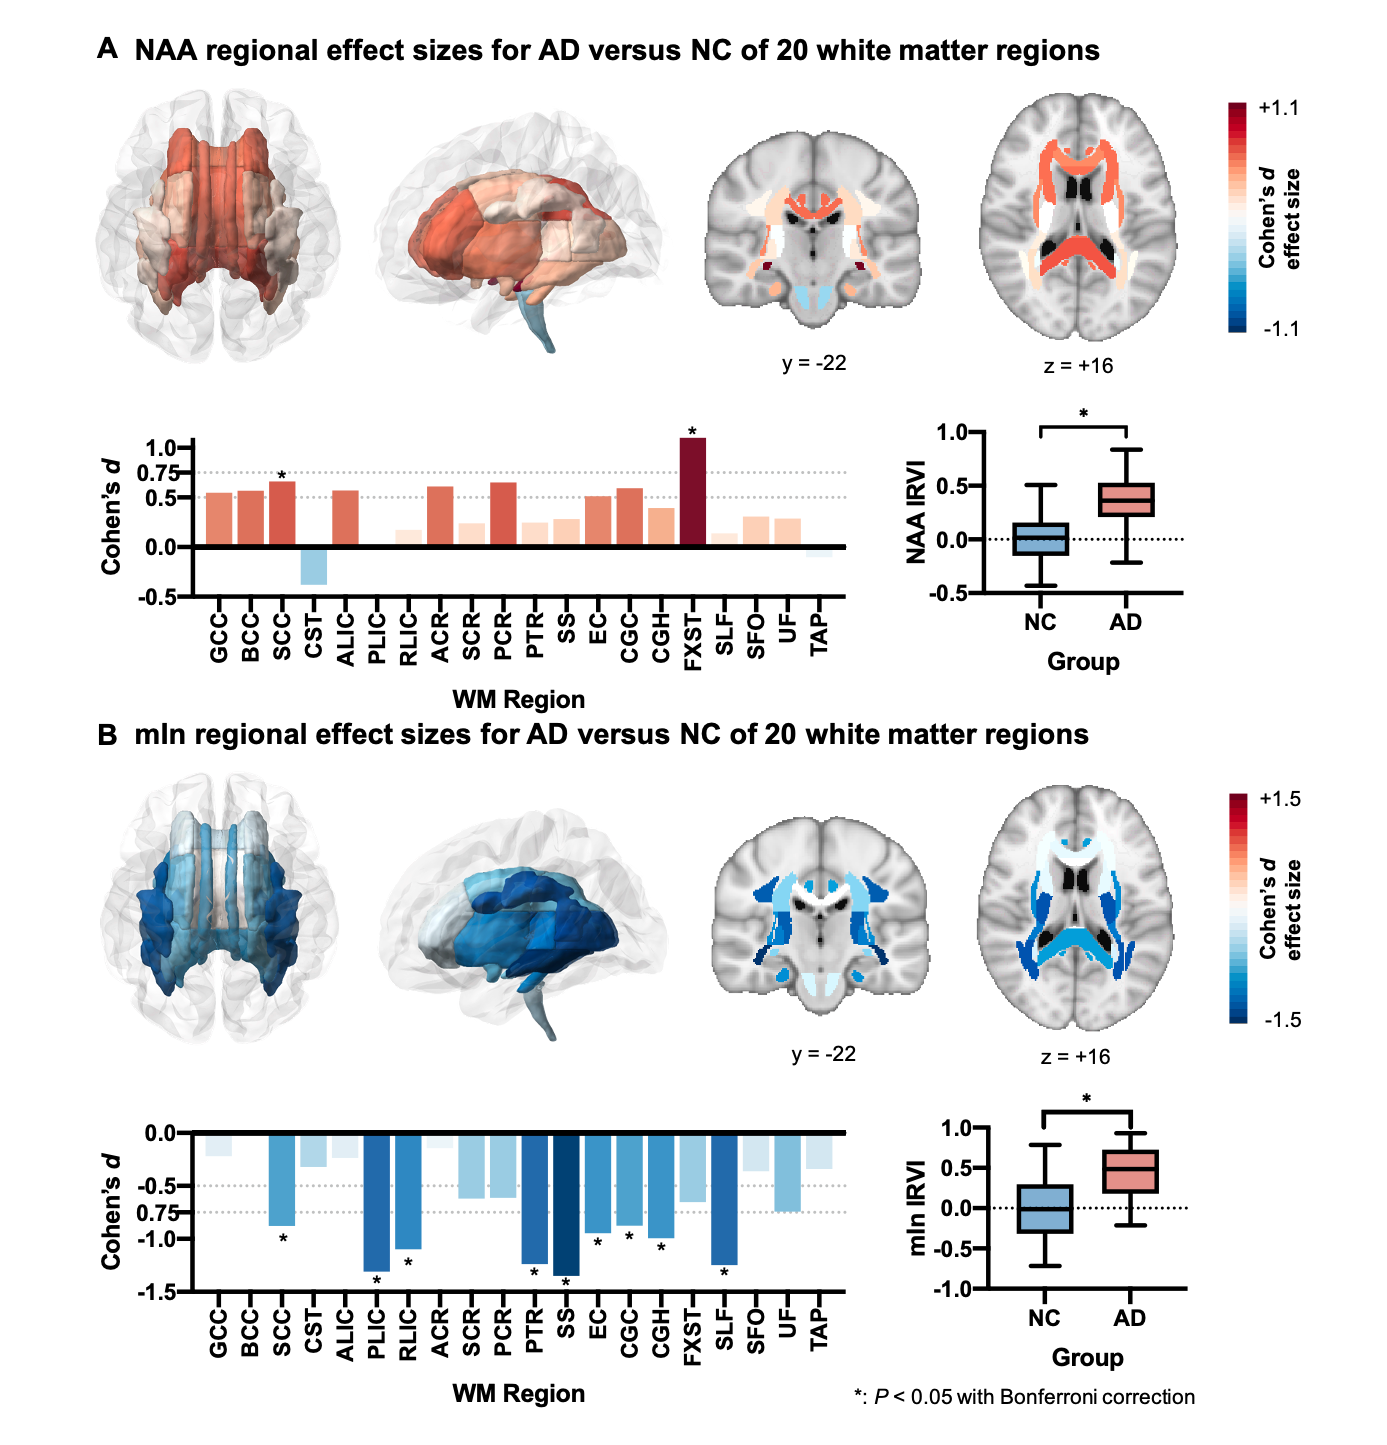
Group comparisons of neurometabolic levels in WM ROIs were performed using analysis of covariance (ANCOVA), with age, gender, and education level controlled. The regional vulnerability pattern (RVP) was measured by Cohen’s d effect sizes for WM NAA and mIn, GMV and Aβ between CN and AD groups10. Individual regional vulnerability index (IRVI) was calculated as the correlation coefficient between the normalized biomarkers and RVP using Pearson correlation analysis10. The predictivity of neuroimaging markers for cognitive decline in AD patients was evaluated using partial least squares (PLS) regression and 10-fold cross-validation (1,000 times).
Results
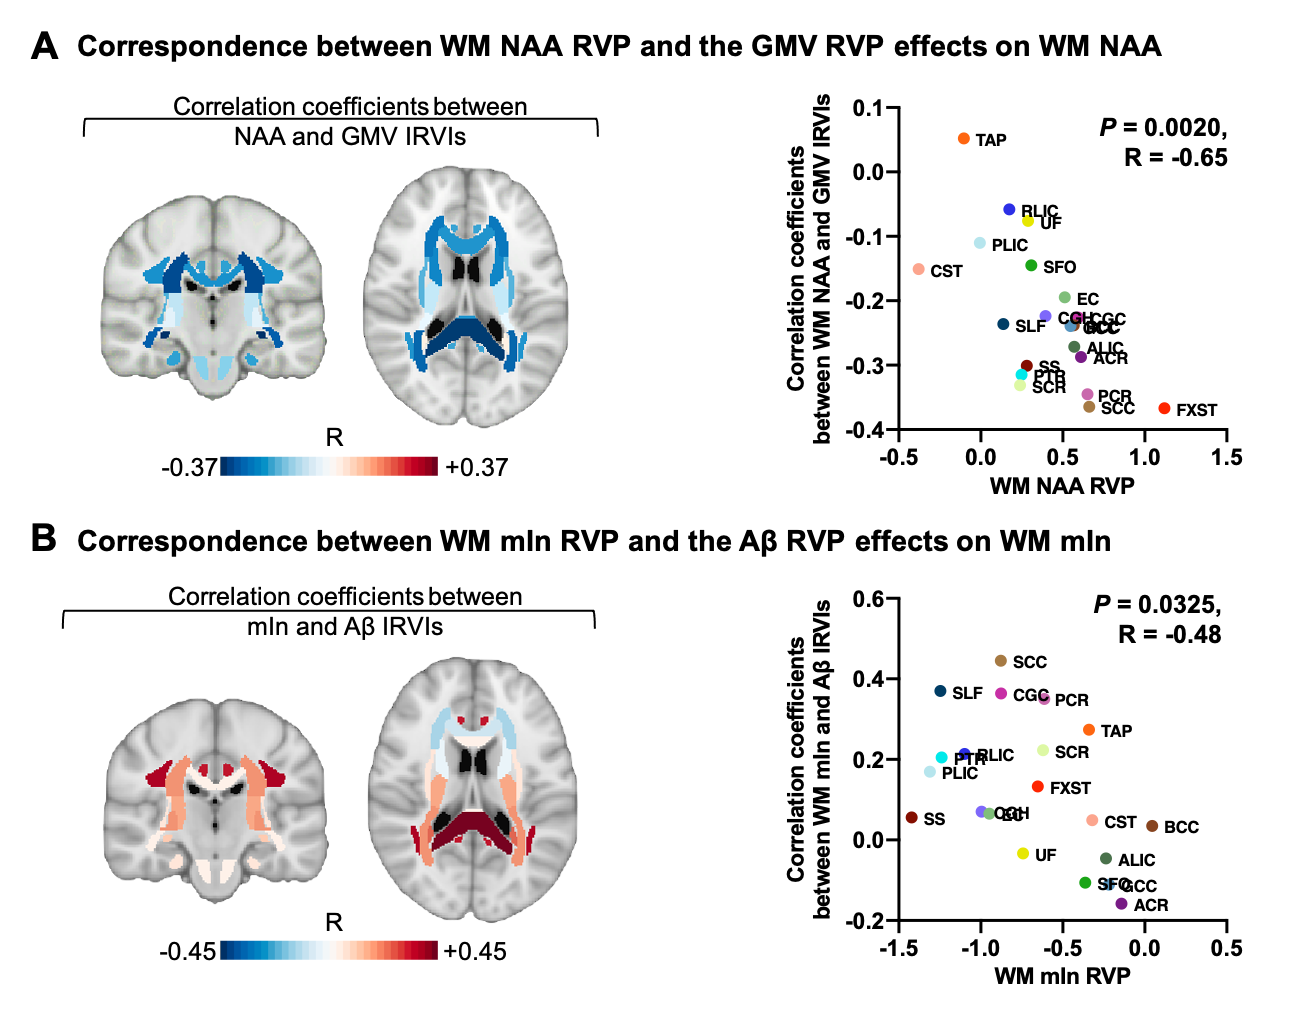
Representative high-resolution 3D NAA and mIn maps from an AD patient (MMSE = 21) and a healthy subject are shown in Figure 1. Reduction in NAA and elevation in mIn were observed in the localized spectra selected from the WM region near fornix stria terminalis (FXST). Figure 2 illustrates the NAA and mIn RVP across 20 WM regions in AD patients. The ROIs with significant vulnerability for NAA include FXST and splenium of corpus callosum (SCC), and for mIn include sagittal stratum (SS) and posterior thalamic radiation (PTR) etc. Significant IRVI differences were found for both neurometabolites between CN and AD groups (P < 0.05 for both after Bonferroni correction).The relationship between the vulnerability of WM neurometabolites and Aβ deposition/GMV in AD patients are shown in Figure 3. The regional NAA concentrations were associated with the IRVIs of GMV, and the association pattern was correlated with NAA RVP (P = 0.0020, R = -0.65). The regional mIn concentrations were associated with the IRVIs of Aβ, and the association pattern was correlated with mIn RVP (P = 0.0325, R = -0.48).
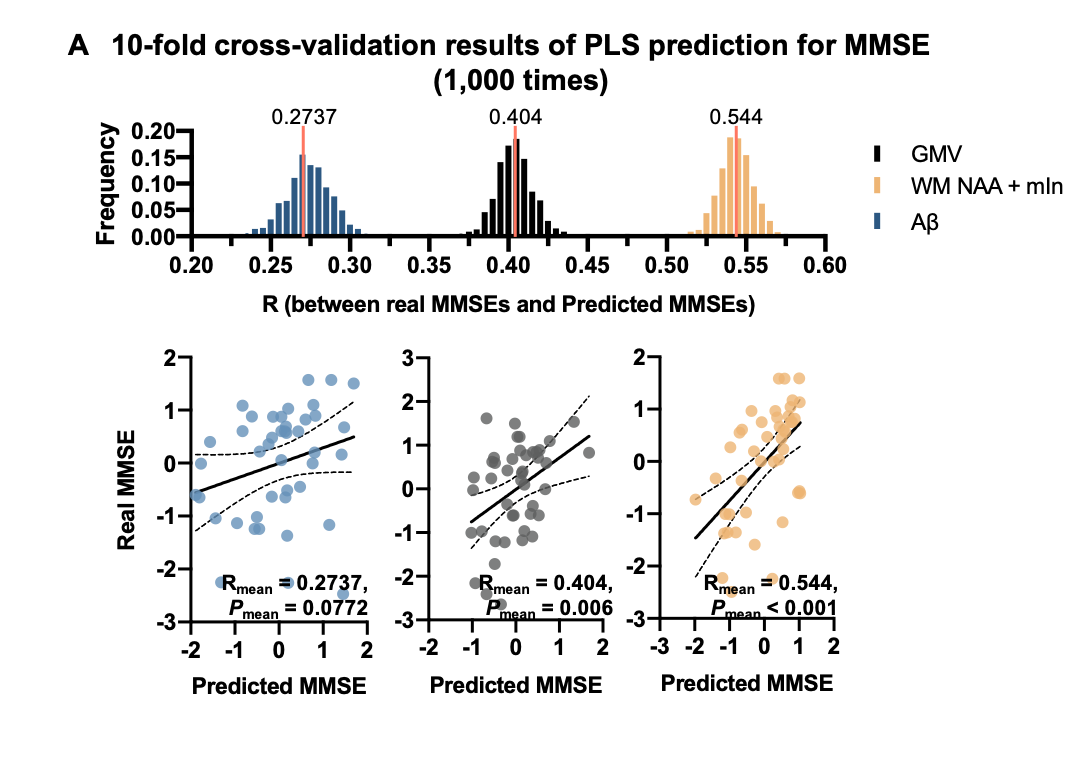
In Figure 4, cross-validation analysis showed that the WM neurometabolic profiles had the best prediction performance for patient MMSE scores (Rmean = 0.54, Pmean < 0.001), in contrast to Aβ (Rmean = 0.27, Pmean = 0.074) and GMV (Rmean = 0.40, Pmean = 0.006).
Conclusion
Using high-resolution 3D-MRSI, we first derived a neurometabolic vulnerability map in AD, showing spatially varying patterns in NAA reduction and mIn elevation in WM regions, in distinct associations with GMV or Aβ deposition, respectively. The WM neurometabolic biomarkers showed improved prediction of cognitive decline of AD patients. The study may provide a good foundation for further investigation of WM damage in AD with high-resolution 3D-MRSI.Acknowledgements
This work was supported by Shanghai Pilot Program for Basic Research-Shanghai Jiao Tong University (21TQ1400203); the National Natural Science Foundation of China (81871083); and Key Program of Multidisciplinary Cross Research Foundation of Shanghai Jiao Tong University (YG2021ZD28, YG2022QN035, YG2021QN40).References
1. Sachdev PS, Zhuang L, Braidy N, Wen W. Is Alzheimer’s a disease of the white matter? Curr Opin Psychiatry. 2013;26(3):244-251.
2. Zhang Y, Schuff N, Du AT, et al. White matter damage in frontotemporal dementia and Alzheimer’s disease measured by diffusion MRI. Brain. 2009;132(9):2579-2592.
3. Caso F, Agosta F, Filippi M. Insights into White Matter Damage in Alzheimer’s Disease: From Postmortem to in vivo Diffusion Tensor MRI Studies. Neurodegener Dis. 2016;16(1-2):26-33.4. Llufriu S, Kornak J, Ratiney H, et al. Magnetic Resonance Spectroscopy Markers of Disease Progression in Multiple Sclerosis. JAMA Neurol. 2014;71(7):840-847.
5. Lam F, Li Y, Guo R, Clifford B, Liang Z. Ultrafast magnetic resonance spectroscopic imaging using SPICE with learned subspaces. Magn Reson Med. 2020;83(2):377-390.
6. Lam F, Liang ZP. A subspace approach to high-resolution spectroscopic imaging: High-Resolution Spectroscopic Imaging. Magn Reson Med. 2014;71(4):1349-1357.
7. Li Y, Lam F, Clifford B, Liang ZP. A Subspace Approach to Spectral Quantification for MR Spectroscopic Imaging. IEEE Trans Biomed Eng. 2017;64(10):2486-2489.
8. Ma C, Lam F, Ning Q, Johnson CL, Liang ZP. High-resolution 1 H-MRSI of the brain using short-TE SPICE. Magn Reson Med. 2015;77(2):467-479.
9. Bell TK, Godfrey KJ, Ware AL, Yeates KO, Harris AD. Harmonization of multi-site MRS data with ComBat. Neuroimage. 2022;257:119330.
10. Kochunov P, Zavaliangos-Petropulu A, Jahanshad N, et al. A White Matter Connection of Schizophrenia and Alzheimer’s Disease. Schizophr Bull. 2020;47(1):197-206.
Figures