0415
Unique brain stiffness and damping ratio patterns associated with morphological phenotypes of normal pressure hydrocephalus
Pragalv Karki1, Matthew C Murphy1, Petrice M Cogswell1, Matthew L Senjem1, Jonathan Graff-Radford2, Clifford R Jack Jr1, Richard L Ehman1, and John Huston III1
1Department of Radiology, Mayo Clinic, Rochester, MN, United States, 2Department of Neurology, Mayo Clinic, Rochester, MN, United States
1Department of Radiology, Mayo Clinic, Rochester, MN, United States, 2Department of Neurology, Mayo Clinic, Rochester, MN, United States
Synopsis
Keywords: Dementia, Brain, Normal pressure hydrocephalus
Normal pressure hydrocephalus (NPH) is a brain disorder that is often misdiagnosed as Alzheimer’s or Parkinson’s disease due to overlapping symptoms. However, unlike such neurodegenerative diseases, NPH can be surgically treated by shunt placement with a success rate of around 80%, depending on phenotype. Therefore, correct diagnosis and categorization of NPH is important. As a step towards that goal, we demonstrate that analyzing the different morphologic phenotypes of NPH using magnetic resonance elastography can help establish unique viscoelastic signatures associated with each phenotype providing distinguishing biomarkers.INTRODUCTION
Normal pressure hydrocephalus (NPH) is a brain pathology with symptoms of cognitive decline, gait disturbance, and urinary incontinence with an estimated prevalence of 8.9%1 in the elderly population of age 80 and above. It is often misdiagnosed as Alzheimer’s2 or Parkinson’s3 due to overlapping symptoms. But unlike such degenerative diseases, NPH is treatable with ventriculoperitoneal shunt placement with sustained improvement in 75 - 91%4,5 of cases. Due to the invasive nature of the surgery, accurate screening is important. Enlargement of ventricles in NPH can reflect mechanical processes that affect the viscoelastic properties of adjacent brain tissue. Therefore, magnetic resonance elastography (MRE), an MRI based non-invasive technique that can measure viscoelastic properties of tissues, is a logical tool for investigating NPH-related effects. A prior study demonstrated that MRE can distinguish disease specific patterns of NPH compared to control and Alzheimer’s disease6. However, patients with NPH may have different morphologic phenotypes that can be assessed by MRI. With the potential implication to improve the diagnosis and prediction of shunt effectiveness in NPH, the hypothesis of this study is that each NPH phenotype is associated with a unique mechanical property signature.METHODS
An expert neuroradiologist categorized the patients with suspected NPH into four groups based on their morphologic features: high convexity tight sulci (HCTS7), ventriculomegaly only (Ventric, Evan’s Index, EI>0.3), neither ventriculomegaly (EI<0.3) or HCTS, and congenital hydrocephalus (ventriculomegaly, diffusely narrowed cerebral sulci and aqueductal stenosis or web8). There were 158 participants in total, with 44 in the Control group, 83 in HCTS, 18 in Ventric, 8 in Congenital, and 5 in Neither. MRE scans were performed on 3T MR scanners using a spin-echo EPI pulse sequence. MRE displacement data were inverted using a neural network inversion9,10,11 to obtain the viscoelastic property maps, stiffness and damping ratio. Groups were compared by fitting a linear model at each voxel with model predictors including age, sex, scanner, and a categorical variable for group assignment. A voxel-wise false discovery rate corrected Q-value less than 0.05 was considered significant. HCTS pattern scores were computed using leave-one-out cross validation as previously described6.RESULTS
Group-wise mean stiffness maps show distinct patterns as shown in right panel of Figure 1. On the left of Figure 1, a boxplot is shown with a jitter plot of averaged stiffness values for each individual. Welch’s t-test and Wilcoxon rank sum test for stiffness between the groups show significant difference between the HCTS and the Control group (p<0.05). Damping ratio maps of the groups with the accompanying boxplots and jitter plots are shown in Figure 2. For the Welch’s t-test and the Wilcoxon rank sum test, the Ventric and the HCTS groups have significantly lower damping ratio values compared to the Control group with p<0.001. HCTS and Congenital groups have lower damping ratio compared to the Neither and the Control group respectively, with p<0.05. Figures 3 and 4 show difference and thresholded t-statistic maps (q<0.05) between the HCTS and each of the other groups. The number of significant voxels is reported in the respective figures. Leave-one-out cross validated correlation scores were calculated for all the cases with HCTS group as the reference. Correlation scores were calculated separately for the stiffness and the damping ratio. The pattern analysis plot with damping ratio scores in y-axis and stiffness scores in x-axis is shown in Figure 5.DISCUSSION
Damping ratio showed more distinction between groups than stiffness for both voxel-wise patterns and global values. The only exception was the HCTS versus congenital comparison, where stiffness had 493 voxels while the damping ratio had none. Both viscoelastic properties show more significant voxels at the vertex. The pattern-analysis plot in Figure 5 shows distinct separation of the HCTS and control cases. Congenital cases are clustered towards the HCTS group as expected from the similarity in their viscoelastic property maps. Cases from Neither and Ventric groups tend to lie between HCTS and control groups with a few Ventric cases closer to the HCTS cluster.CONCLUSION
Disproportionately enlarged subarachnoid-space hydrocephalus (HCTS with enlarged sylvian fissures) is a key feature for diagnosing NPH under the widely established Japanese criteria12. In a multi-regression analysis study, HCTS was shown to have highest correlation with shunt surgery success13. But studies have highlighted that relying solely on tight high convexity for predicting shunt outcome14,15 would exclude cases from other phenotypes of NPH that could also benefit from surgery. Therefore, it is important to establish distinct biomarker-based signatures for different morphologic phenotypes of NPH. In this study, we have demonstrated that MRE can provide such a biomarker. Furthermore, MRE-based pattern analysis separates some ventriculomegaly cases into HCTS spectrum or cluster, signaling that viscoelastic signatures could predict development of HCTS in those cases. The result provides motivation for further MRE-based studies to better understand the underlying viscoelastic biomarker findings in such cases.Acknowledgements
No acknowledgement found.References
- Andersson J, Rosell M, Kockum K, Lilja-Lund O, Söderström L, Laurell K. Prevalence of idiopathic normal pressure hydrocephalus: a prospective, population-based study. PloS one 2019;14:e0217705.
- M. Borzage, A. Saunders, J. Hughes, J. McComb, S. Blu ̈ml, and K. King, The first examination of diagnostic performance of automated measurement of the callosal angle in 1856 elderly patients and volunteers indicates that 12.4% of exams met the criteria for possible normal pressure hydrocephalus, American Journal of Neuroradiology 42, 1942 (2021).
- K. Molde, L. Soderstrom, and K. Laurell, Parkinsonian symptoms in normal pressure hydrocephalus: a population-based study, Journal of Neurology 264, 2141 (2017).
- E. M. Wu, T. Y. El Ahmadieh, B. Kafka, J. Caruso, S. G. Aoun, A. R. Plitt, O. Neeley, D. M. Olson, R. A. Ruchinskas, M. Cullum, H. Batjer, and J. A. White, Ventriculoperitoneal shunt outcomes of normal pressure hydrocephalus: A case series of 116 patients, Cureus 11, e4170 (2019).
- A. M. Popal, Z. Zhu, X. Guo, Z. Zheng, C. Cai, H. Jiang, J. Zhang, A. Shao, and J. Zhu, Outcomes of ventriculoperitoneal shunt in patients with idiopathic normal-pressure hydrocephalus 2 years after surgery, Frontiers in Surgery 8, 10.3389/fsurg.2021.641561 (2021).
- M. Murphy, P. Cogswell, J. Trzasko, A. Manduca, M. Senjem, F. Meyer, R. Ehman, and J. Huston, Identification of normal pressure hydrocephalus by disease-specific patterns of brain stiffness and damping ratio, Investigative Radiology 55, 200 (2020).
- Kitagaki, H., Mori, E., Ishii, K., Yamaji, S., Hirono, N., Imamura, T., 1998. CSF spaces in idiopathic normal pressure hydrocephalus: morphology and volumetry. AJNR Am J Neuroradiol 19, 1277–1284.
- Oi, S., Shimoda, M., Shibata, M., Honda, Y., Togo, K., Shinoda, M., Tsugane, R., Sato, O., 2000. Pathophysiology of long-standing overt ventriculomegaly in adults. Journal of Neurosurgery 92, 933–940. https://doi.org/10.3171/jns.2000.92.6.0933
- M. C. Murphy, A. Manduca, J. D. Trzasko, K. J. Glaser, J. Huston III, and R. L. Ehman, Artificial neural networks for stiffness estimation in magnetic resonance elastography, Magnetic Resonance in Medicine 80, 351 (2018). 10.
- J. M. Scott, A. Arani, A. Manduca, K. P. McGee, J. D. Trzasko, J. Huston, R. L. Ehman, and M. C. Murphy, Artificial neural networks for magnetic resonance elastography stiffness estimation in inhomogeneous materials, Medical Image Analysis 63, 101710 (2020).
- J. M. Scott, K. Pavuluri, J. D. Trzasko, A. Manduca, M. L. Senjem, J. Huston III, R. L. Ehman, and M. C. Murphy, Impact of material homogeneity assumption on cortical stiffness estimates by MR elastography, Magnetic Resonance in Medicine 88, 916 (2022).
- E. Moier, M. Ishikawa, T. Kato, H. Kazui, H. Miyake, M. Miyajima, M. Makajima, M. Hashimoto, N. Kuriyama, T. Tokuda, K. Ishii, M. Kaijima, Y. Hirata, M. Saito, and H. Arai, Guidelines for management of idiopathic normal pressure hydrocephalus: Second edition, Neurologia medico-chirurgica 52, 775 (2012).
- W. Narita, Y. Nishio, T. Baba, O. Iizuka, T. Ishihara, M. Matsuda, M. Iwasaki, T. Tominaga, and E. Mori, High-convexity tightness predicts the shunt response in idiopathic normal pressure hydrocephalus, American Journal of Neuroradiology 37, 1831 (2016).
- Claudia L. Craven, Ahmed K. Toma, Tarek Mostafa, Neekhil Patel, Laurence D. Watkins, The predictive value of DESH for shunt responsiveness in idiopathic normal pressure hydrocephalus, Journal of Clinical Neuroscience, Volume 34, 2016, Pages 294-298.
- A.K. Ahmed, M. Luciano, A. Moghekar, J. Shin, N. Aygun, H.I. Sair, D. Rigamonti, A.M. Blitz, Does the Presence or Absence of DESH Predict Outcomes in Adult Hydrocephalus? American Journal of Neuroradiology Nov 2018, 39 (11) 2022-2026.
Figures
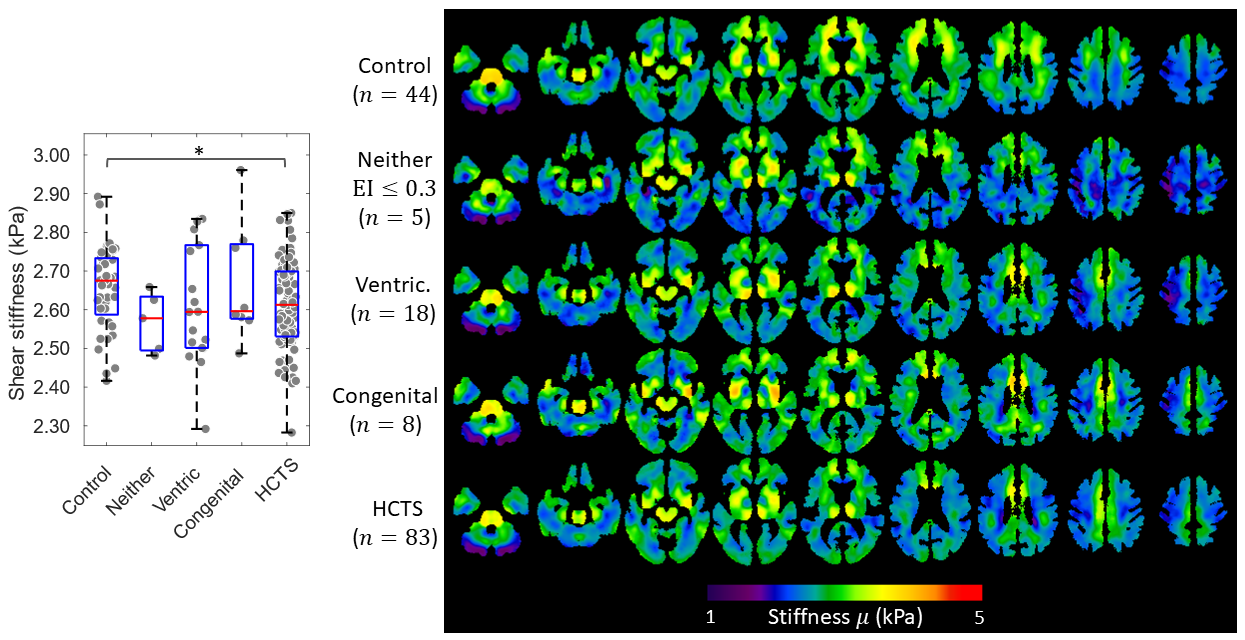
Figure 1. Averaged stiffness maps
(right) and boxplot (left) of global shear stiffness for the Control group and
the four morphologic phenotypes of normal pressure hydrocephalus. A boxplot
plot is overlaid on a jitter plot of the individual cases. Welch’s t-test and
Wilcoxon rank sum test results between the groups with p<0.05 shown with an asterisk.
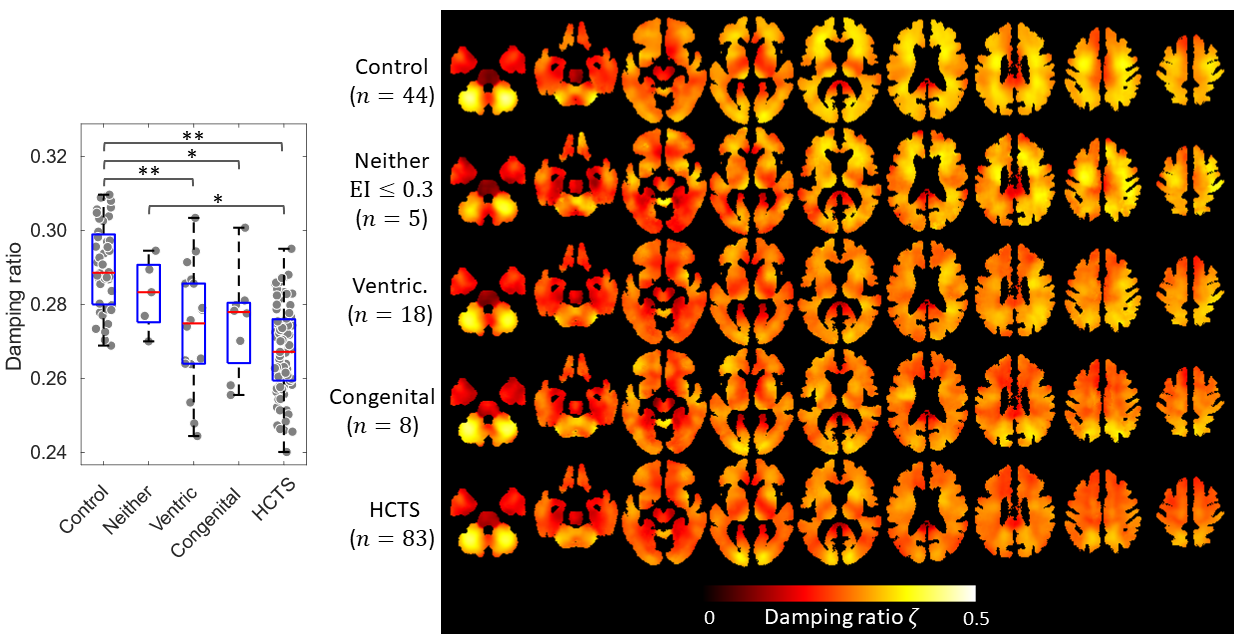
Figure 2. Averaged damping ratio maps
(right) and boxplot of the five participant groups overlayed on jitter plot
(left) of individual cases. Welch’s t-test and Wilcoxon
rank sum test results between the groups with p<0.05 is shown with an asterisk. Double asterisk
denotes p<0.001.
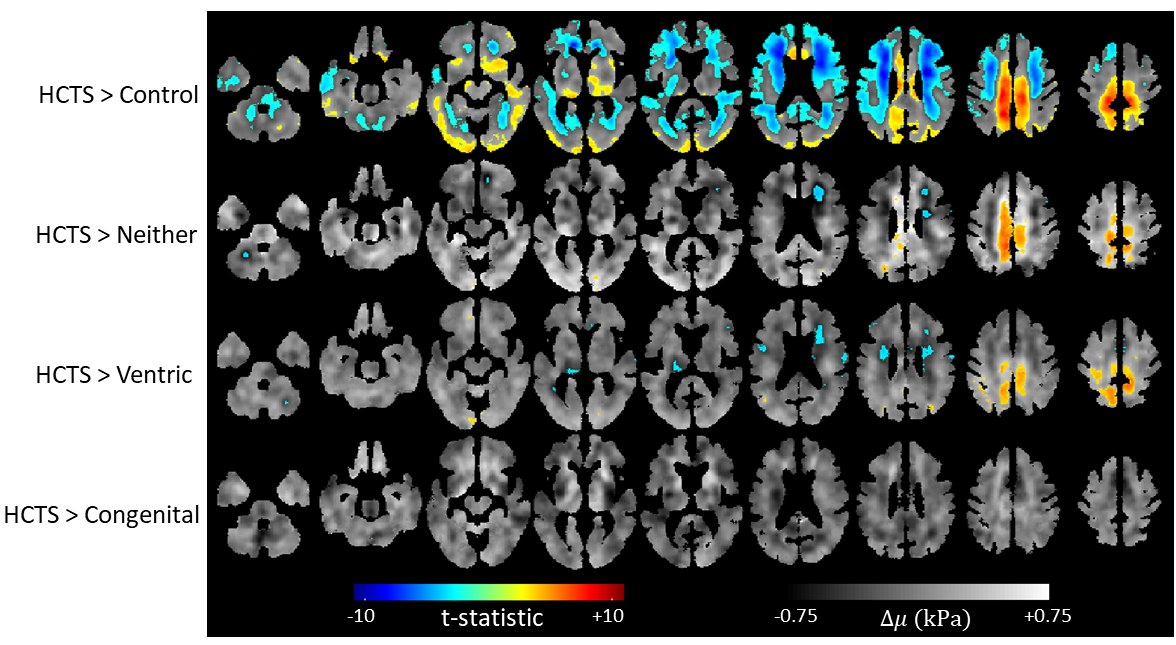
Figure 3. Positive false discovery
rate (pFDR) thresholded (q<0.05) t-statistic maps overlayed on voxel-wise
calculated difference stiffness maps of each group compared to the HCTS group. The
number of voxels that crossed the pFDR threshold were 493 for congenital, 9024
for Ventric, 6873 for Neither, and 92789 for Control.
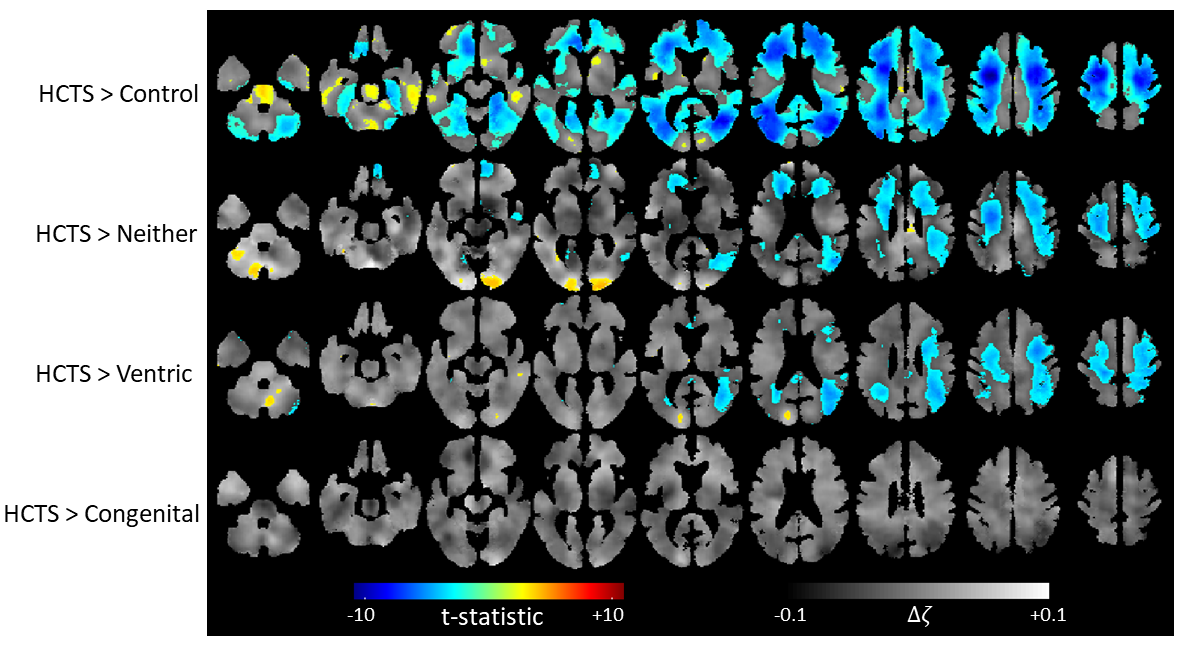
Figure 4. Positive false discovery rate thresholded (q<0.05) t-statistics map overlayed on difference maps
of groups compared to HCTS for the damping ratio. The number of voxels that
crossed the pFDR threshold were 0 for congenital, 28693 for Ventric, 37618 for
Neither, and 144022 for Control.
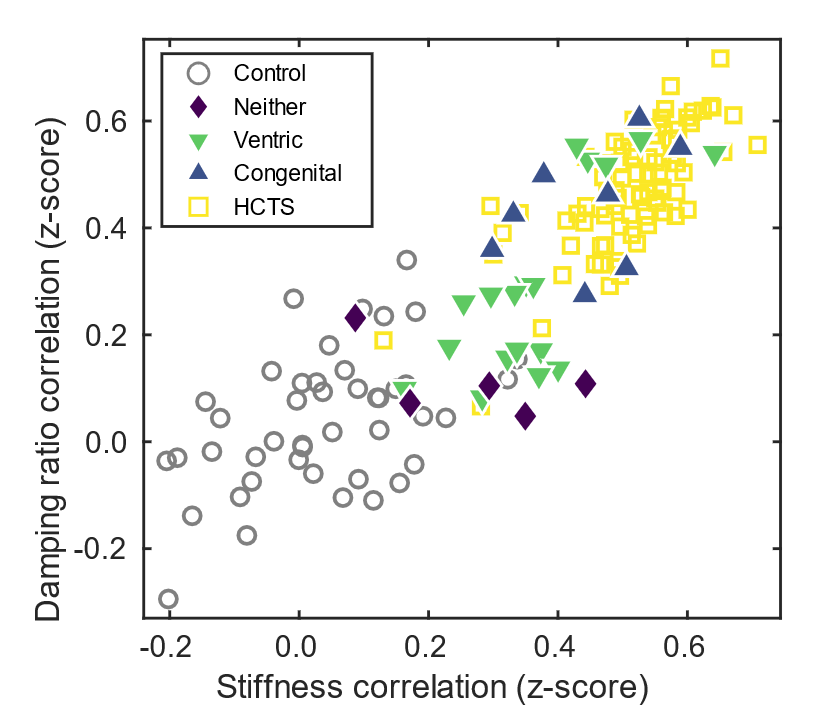
Figure 5. A plot of age, sex, and
scanner effect corrected spatial correlation scores for the individual cases
with HCTS group as the reference. The HCTS and the control groups separate into
two distinct clusters. The congenital cases are along the HCTS spectrum as
expected, since the pFDR calculations did not show significant difference
between the two groups. The Neither and the Ventric groups are scattered
between the Control and HCTS spectrum, with few Ventric cases separating
towards HCTS.
DOI: https://doi.org/10.58530/2023/0415