0413
Increased vessel size accompanies decreased cerebral blood flow in the hippocampus in Alzheimer’s disease1Department of Radiology, Athinoula A. Martinos Center for Biomedical Imaging, Massachusetts General Hospital, Charlestown, MA, United States, 2Department of Biomedical Engineering, Ulsan National Institute of Science and Technology, Ulsan, Korea, Republic of, 3Department of Neurology, Massachusetts General Hospital, Charlestown, MA, United States
Synopsis
Keywords: Alzheimer's Disease, Perfusion
The purpose of this study was to probe alterations in vessel size and their contributions to perfusion deficits observed in the early stages of Alzheimer’s disease (AD). AD and mild cognitive impairment (MCI) patients along with older and young adults underwent perfusion and diffusion magnetic resonance imaging (MRI). Increased vessel size was observed in conjunction with decreased cerebral blood flow in the hippocampus of individuals with AD and MCI. These results highlight potential pathologic mechanisms of abnormal vascular supply to the hippocampus in AD. Further investigations into vessel density and the relationship between cerebrovascular structure to AD pathology are warranted.Introduction
Alzheimer’s disease (AD) is biologically characterized by the presence of beta-amyloid plaques and neurofibrillary tangles containing hyperphosphorylated tau1. Cerebrovascular dysfunction has been recognized as a significant contributor to the progression of AD2,3. Alterations in brain perfusion beyond those in normal aging are known to emerge in the early stages of AD preceding neurodegeneration and brain atrophy4. Several studies have demonstrated perfusion deficits in AD. However, limited prior research has investigated abnormal vessel structure in individuals with AD or mild cognitive impairment (MCI). Non-invasive imaging biomarkers of vascular health could be used for the early detection of individuals with MCI at high risk for development of dementia. The purpose of this study was to evaluate the integrity of cerebrovascular structure and function in individuals with AD and MCI.Methods
Seven individuals with AD/MCI (6 MCI, 1 AD) (76.8±6.7 years, 3 females), nine cognitively intact older healthy adults (OHA) (65.1±5.4 years, 5 females), and seven younger healthy adults (YHA) (29.6±3.9 years, 3 females) were scanned on a 3T MRI scanner (Magnetom Prisma, Siemens, Germany) using a 32-channel head coil. For vessel size imaging, the simultaneous gradient-echo (GE) and spin-echo (SE) dynamic susceptibility contrast (DSC) MRI were acquired with contrast injection (Dotarem, gadoterate meglumine, Guerbet, France) with 2.2mm in-plane resolution, 3.5mm slice thickness, TE of 30ms and 90ms for SE and GE, respectively, and TR=1500ms5. Diffusion-weighted MRI was acquired using b-values=0, 1000, and 3000s/mm2 with 5, 32, and 64 directions, respectively, and TR/TE=3,133/70.8ms. A multiband pseudo-continuous arterial spin labeling (PCASL) sequence was also implemented with TR/TE=3580/19ms, 2.5mm in-plane resolution, 2.27mm slice thickness, and post-label delay intervals with 0.2s, 0.7s, 1.2s, 1.7s, and 2.2s6. Cerebral blood flow (CBF) and cerebral blood volume (CBV) were derived from pgui software (Center for Functionally Integrative Neuroscience, Aarhus University Hospital, Denmark). CBF and CBV were normalized to their mean cerebellar values for inter-subject comparison. ΔR23/2 and ΔR2* hysteresis plot was generated according to the vessel architectural imaging technique after fitting the data using a gamma variate function7. The relative vessel size index (rVSI) was measured by combining GE CBV, mean diffusivity (MD), and the slope of the hysteresis plot according to the equation, $$$√(CBV×MD)×slope$$$ (Figure 1)8. Relative CBF maps and arterial CBV from PCASL were calculated using the Bayesian Inference for Arterial Spin Labeling MRI (BASIL) toolbox in FSL. The parametric values were averaged and compared amongst the three groups in the amygdala, entorhinal cortex, and hippocampus using the Mann-Whitney U test, controlling for false discovery rate.Results
Figure 2 shows representative perfusion and diffusion images with T2-FLAIR from a 62-year-old male OHA and a 66-year-old female individual of MCI. MD in all three brain regions of the AD/MCI group was significantly higher than OHA and YHA (amygdala: 0.8:0.8:1.1 for YHA:OHA:patients, P-values<0.001; entorhinal cortex: 0.9:0.9:1.2, P-values<0.003; and hippocampus: 0.9:0.9:1.2, P-values<0.001) (Figure 3). The arterial CBV from PCASL was lower in the hippocampus of the patient group compared to the OHA and YHA groups (3.5:2.6:1.1 for YHA:OHA:patients, P-values<0.001) (Figure 4A). The relative CBF from PCASL is lower in all three regions of the patient group compared to other groups (P-values<0.006) (Figure 4D). SE CBF also showed reduced blood flow in the hippocampus of the patient group than OHA (1.0:1.1:0.8 for YHA:OHA:patients, P-values=0.004 between the patient group and OHA group) (Figure 4E). However, SE CBV, GE CBV, and GE CBF were not significantly different among the three groups (Figure 4B, 4C, and 4F). The rVSI in the hippocampus of the patient group was higher than in OHA and YHA groups (2.4:2.4:3.7 for YHA:OHA:patients, P-values<0.006) (Figure 5). There was no difference in all parameters between the YHA and OHA groups (all P-values>0.05).Discussion
In this study, we found increased mean vessel size in the hippocampus of individuals with AD and MCI compared to cognitively intact healthy adults. Reduced CBF observed from PCASL and SE DSC-MRI but not from GE DSC-MRI may imply that progressive degeneration occurs in capillaries and microvasculature in the hippocampus. GE signal is highly susceptibility-sensitive and dominated by both microscopic and macroscopic vessels, whereas SE signal is primarily affected by changes in microscopic vessels like capillaries9. Our result showing increased vessel size in the hippocampus of patients is consistent with several previous studies on AD mouse models validated by MRI vessel size imaging and histological analysis10,11,12. We examined three brain regions that are affected early in AD progression (hippocampus, amygdala, and entorhinal cortex); among these, significantly enlarged vascular size was only found in the hippocampus, which is an area of the brain critically important for memory and cognition13. It is possible that reduced vessel density occurs early in the disease course, leading to decreased blood flow and a compensatory increase in vessel size to maintain blood flow and preserve hippocampal function. These findings merit further investigation in larger cohorts of patients and controls using noninvasive perfusion MRI techniques to study vessel size and density and their relationship to AD pathology.Conclusion
This study demonstrates increased vascular size in the hippocampus in MCI and the early stages of AD in association with decreased cerebral blood flow using non-contrast (PCASL) and GE/SE DSC-MRI, which may be related to degeneration of the microvasculature and capillaries.Acknowledgements
This work was funded by NIH R21AG067562, P41EB030006, P30AG062421, K99AG061259, and R01NR010827. This work was also supported by the Korea Health Technology R&D Project through the Korea Healthy Industry Development Institute (KHIDI), funded by the Ministry of Health and Welfare, Republic of Korea (grant number: HI19C1095).
References
1. Jack Jr CR, Bennett DA, Blennow K, et al. NIA-AA research framework: toward a biological definition of Alzheimer's disease. Alzheimers. Dement. 2018;14(4):535-562.
2. Sweeney MD, Kisler K, Montagne A, et al. The role of brain vasculature in neurodegenerative disorders. Nat. Neurosci. 2018;(10):1318-1331.
3. Govindpani K, McNamara LG, Smith NR, et al. Vascular dysfunction in Alzheimer’s disease: a prelude to the pathological process or a consequence of it?. J. Clin. Med. 2019;8(5):651.
4. Iturria-Medina Y, Sotero RC, Toussaint PJ, et al. Early role of vascular dysregulation on late-onset Alzheimer’s disease based on multifactorial data-driven analysis. Nat. Commun. 2016;7(1):1-4.
5. Manhard MK, Bilgic B, Liao C, et al. Accelerated whole‐brain perfusion imaging using a simultaneous multislice spin‐echo and gradient‐echo sequence with joint virtual coil reconstruction. Magnetic resonance in medicine. 2019;82(3):973-83.
6. Li X, Wang D, Auerbach EJ, et al. Theoretical and experimental evaluation of multi-band EPI for high-resolution whole brain pCASL Imaging. Neuroimage. 2015;106:170-81.
7. Emblem KE, Mouridsen K, Bjornerud A, et al. Vessel architectural imaging identifies cancer patient responders to anti-angiogenic therapy. Nat. Med. 2013;19(9):1178-83.
8. Kiselev VG, Strecker R, Ziyeh S, et al. Vessel size imaging in humans. Magnetic Resonance in Medicine: An Official Journal of the International Society for Magnetic Resonance in Medicine. 2005;53(3):553-63.
9. Pathak AP, Ward BD, Schmainda KM. A novel technique for modeling susceptibility-based contrast mechanisms for arbitrary microvascular geometries: the finite perturber method. NeuroImage. 2008;40(3):1130-43.
10. Xu X, Meng T, Wen Q, et al. Dynamic changes in vascular size and density in transgenic mice with Alzheimer’s disease. Aging (Albany NY). 2020;12(17):17224.
11. Guo Y, Li X, Zhang M, et al. Age‑and brain region‑associated alterations of cerebral blood flow in early Alzheimer's disease assessed in AβPPSWE/PS1ΔE9 transgenic mice using arterial spin labeling. Mol. Med. Rep. 2019;19(4):3045-52.
12. Cao Y, Xu H, Zhu Y, et al. ADAMTS13 maintains cerebrovascular integrity to ameliorate Alzheimer-like pathology. PLoS Biol. 2019;17(6):e3000313.
13. Bird CM, Burgess N. The hippocampus and memory: insights from spatial processing. Nat. Rev. Neurosci. 2008;9(3):182-94.
Figures
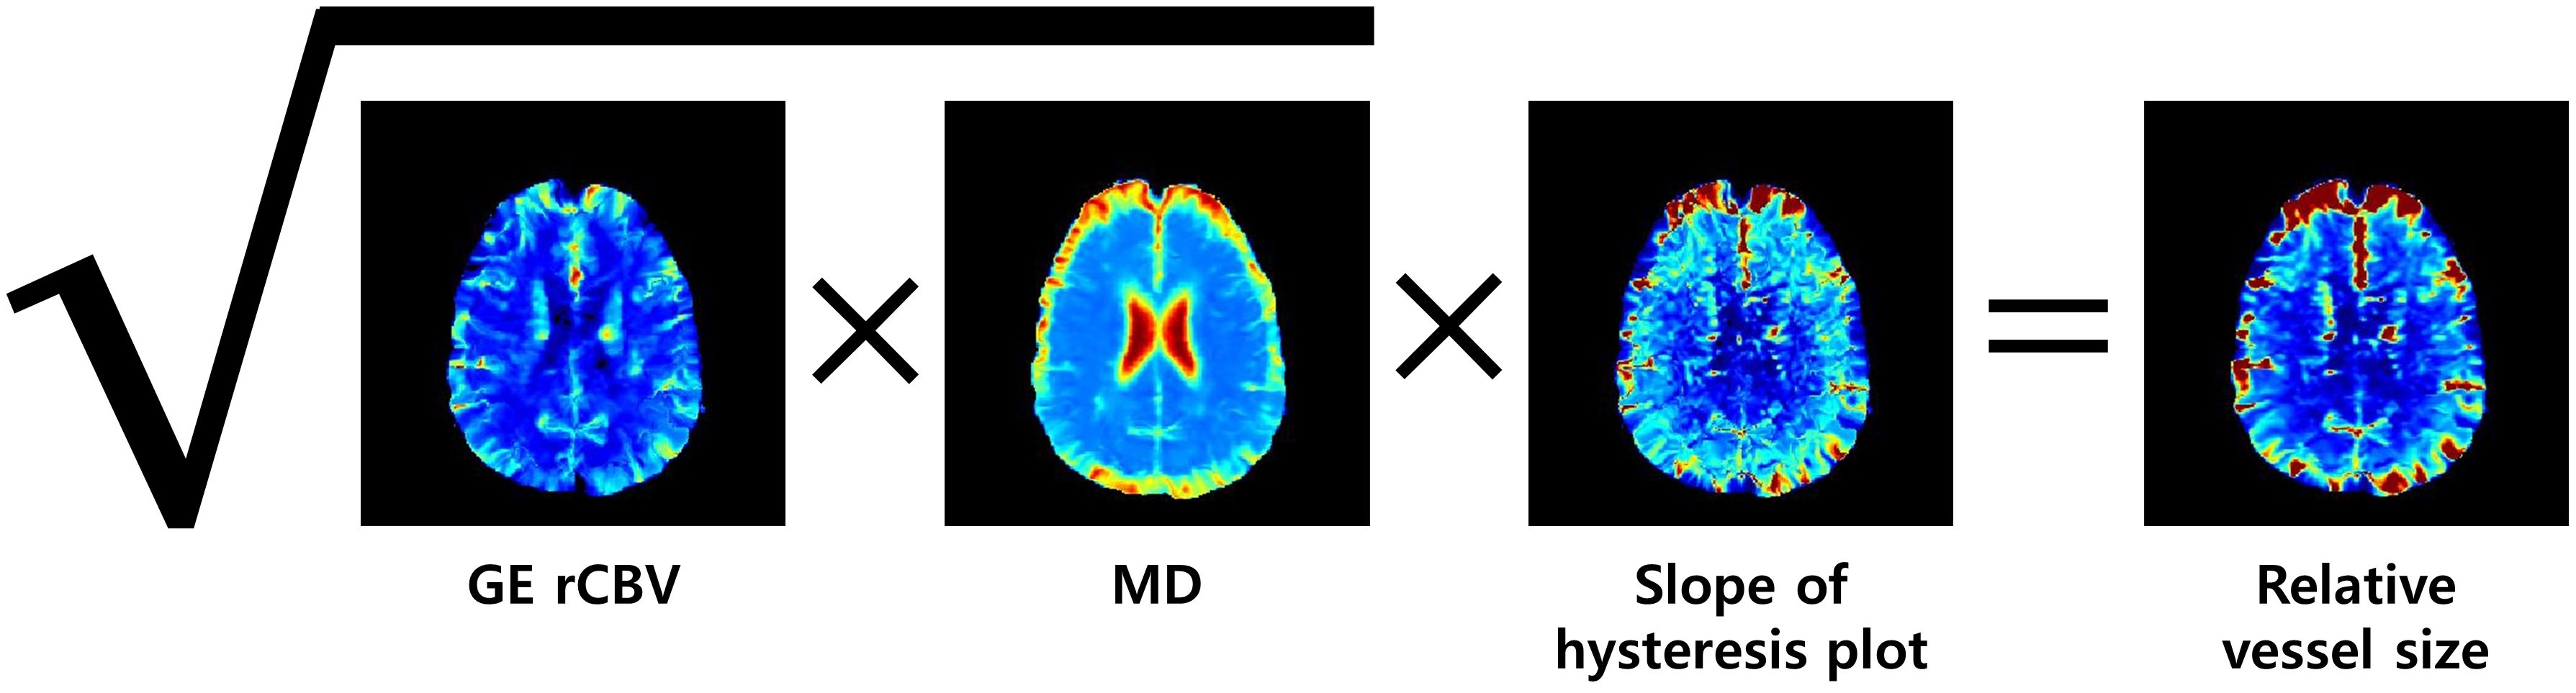
Figure 1. Vessel size measurement. The slope of hysteresis plot denotes the slope of the long axis determined by $$$y=ax$$$ fitting in the ΔR23/2 and ΔR2* hysteresis plot.
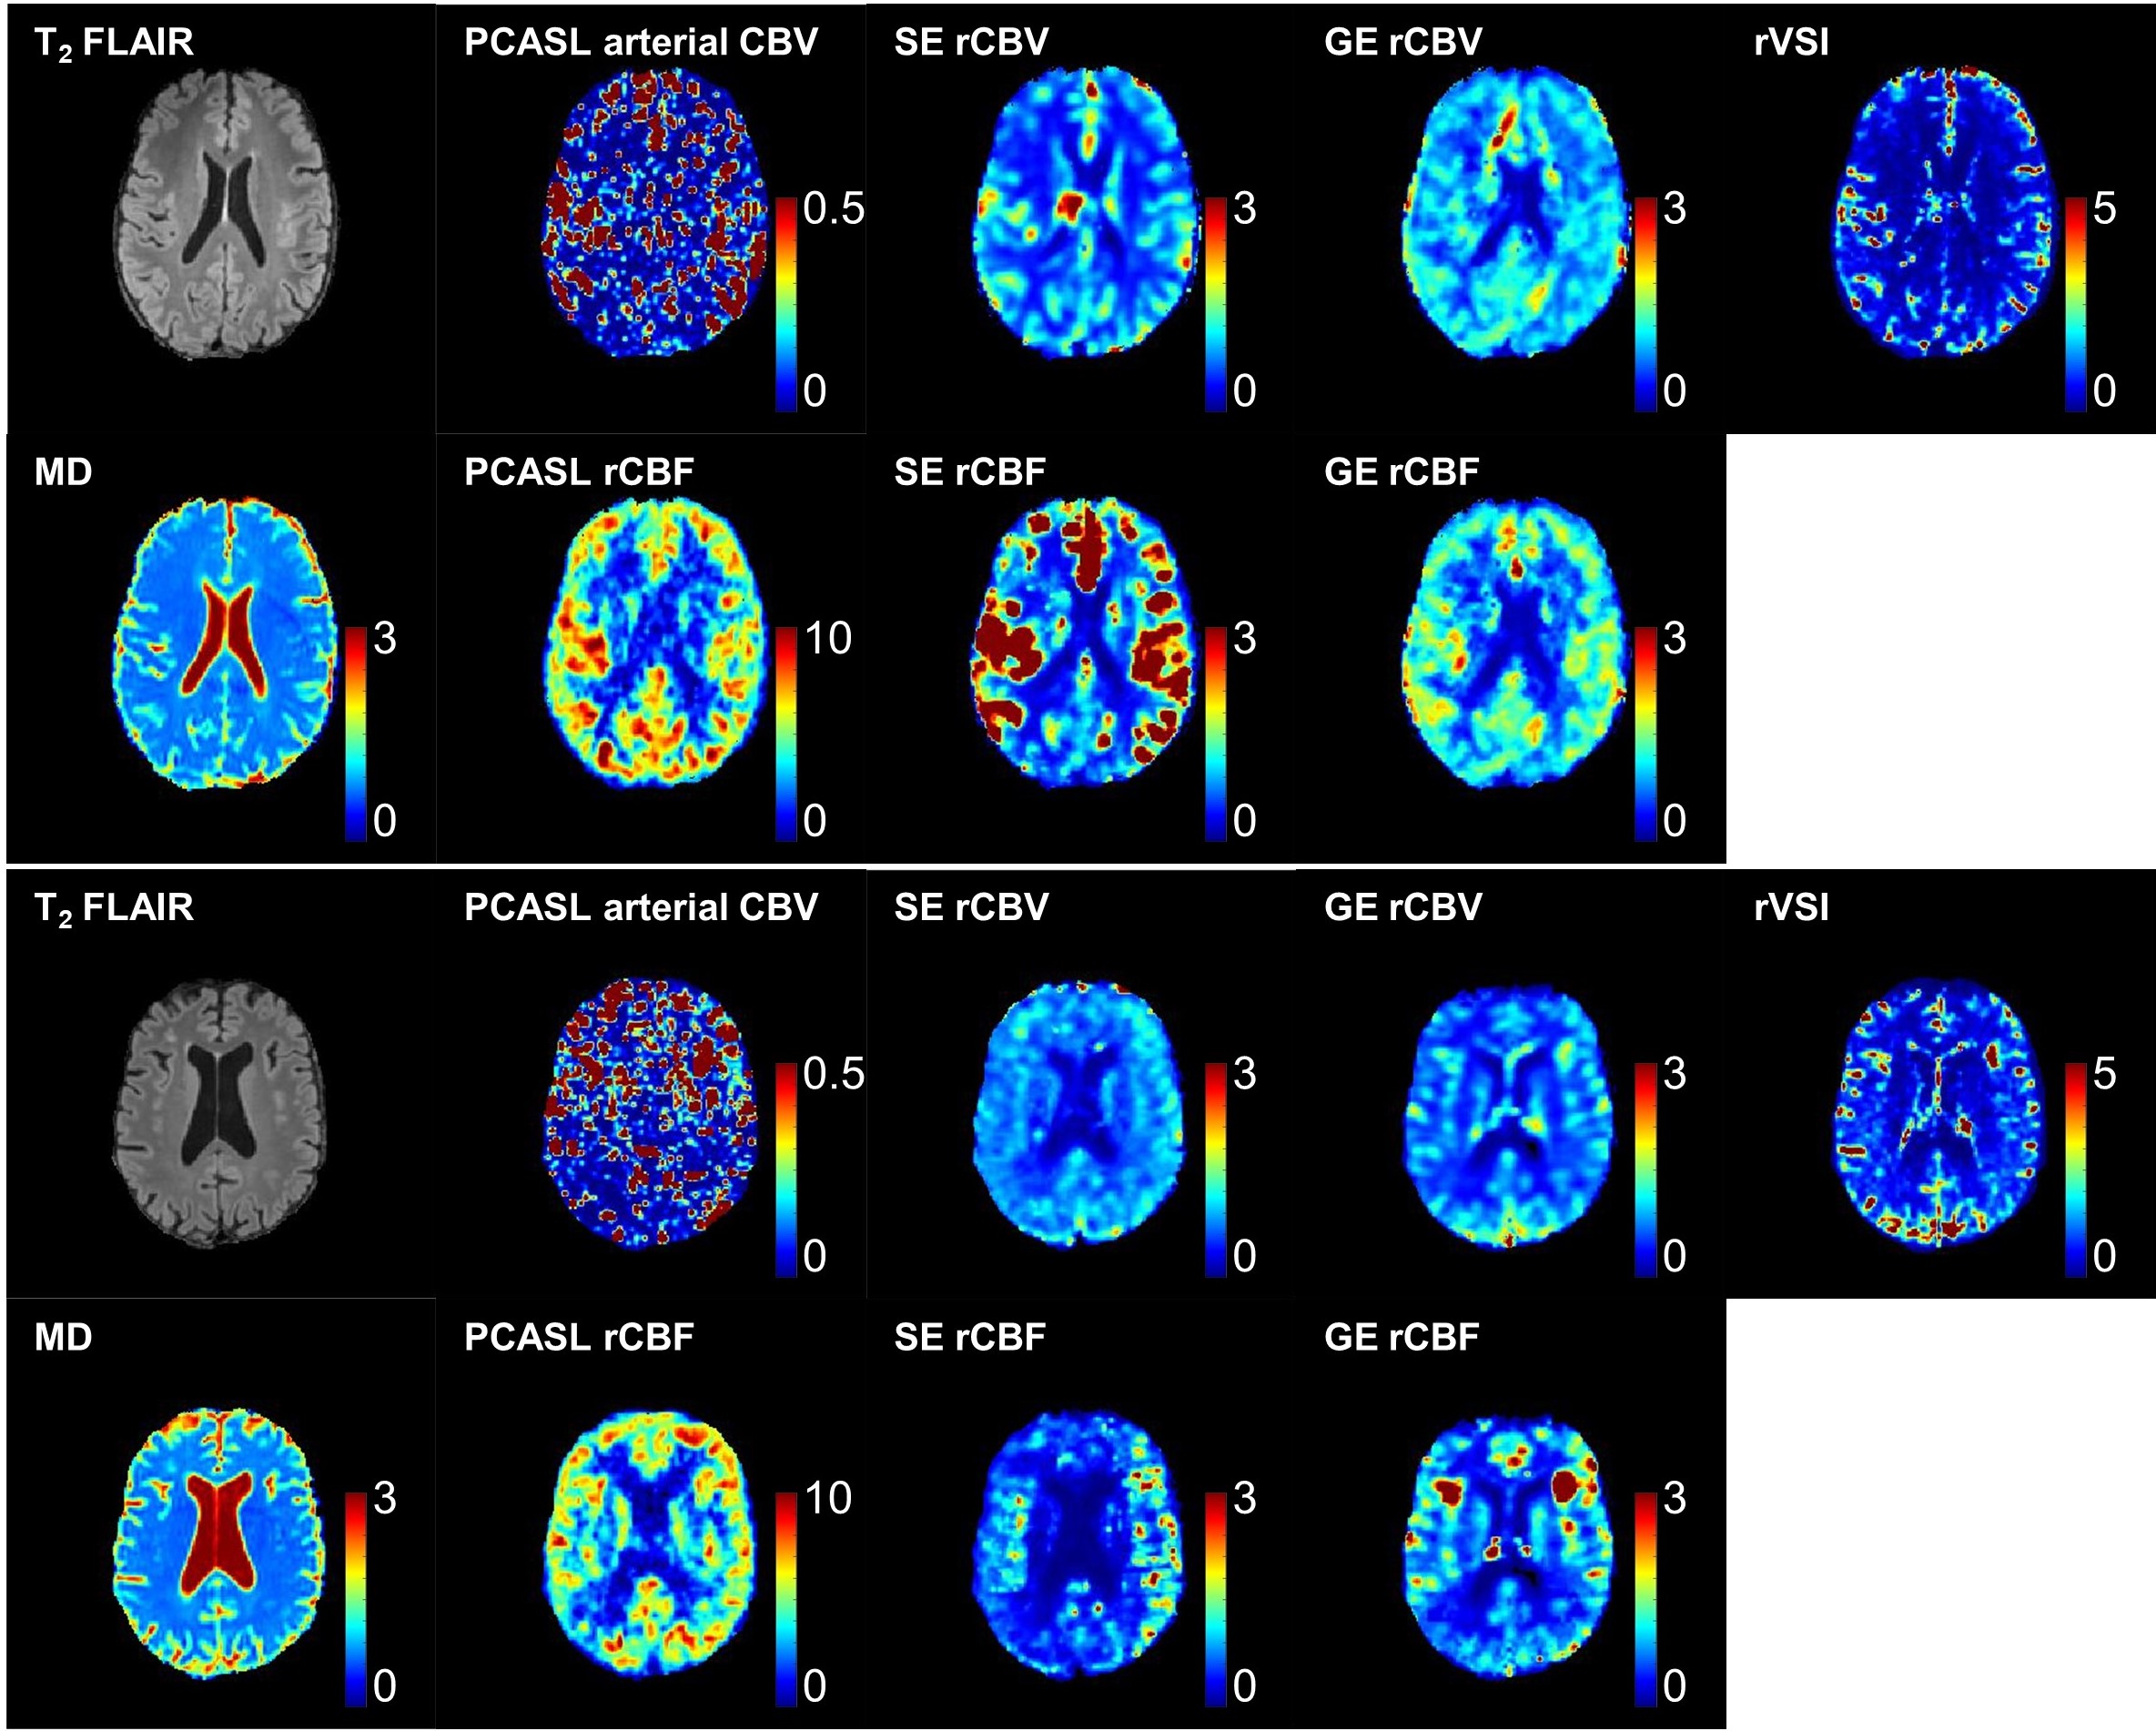
Figure 2. Multiparametric assessment of the brain with perfusion and diffusion MRI. The top two rows are from a 62-year-old male OHA. The bottom two rows are from a 66-year-old female individual with MCI. All other relative values are displayed in an arbitrary unit (a.u.). The unit of MD is mm2/s.
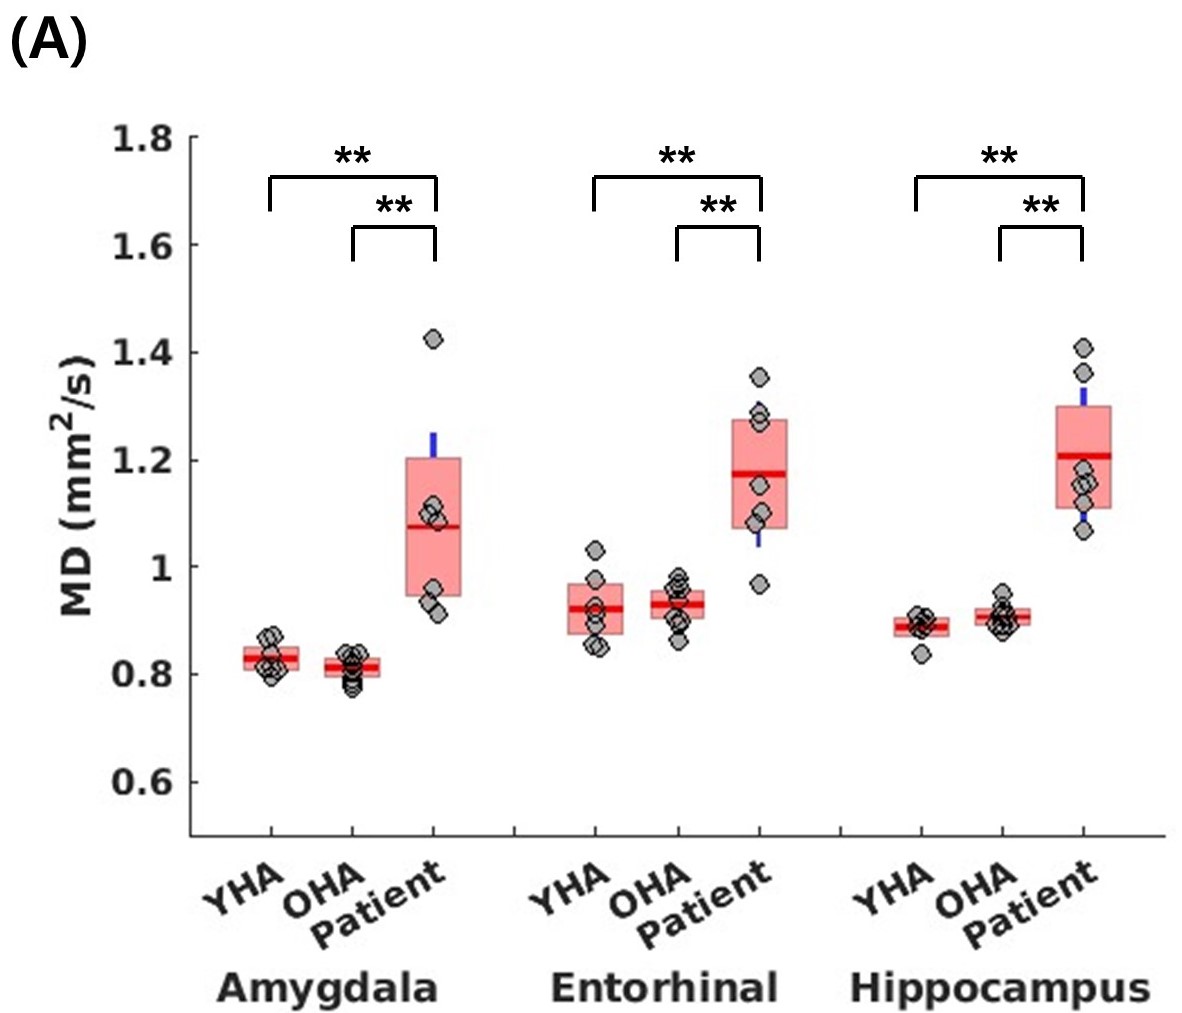
Figure 3. The distribution of MD in the amygdala, entorhinal cortex, and hippocampus. *: P-value<0.05 and **: P-value<0.005 in Mann-Whitney U test after adjusting for false discovery rate.
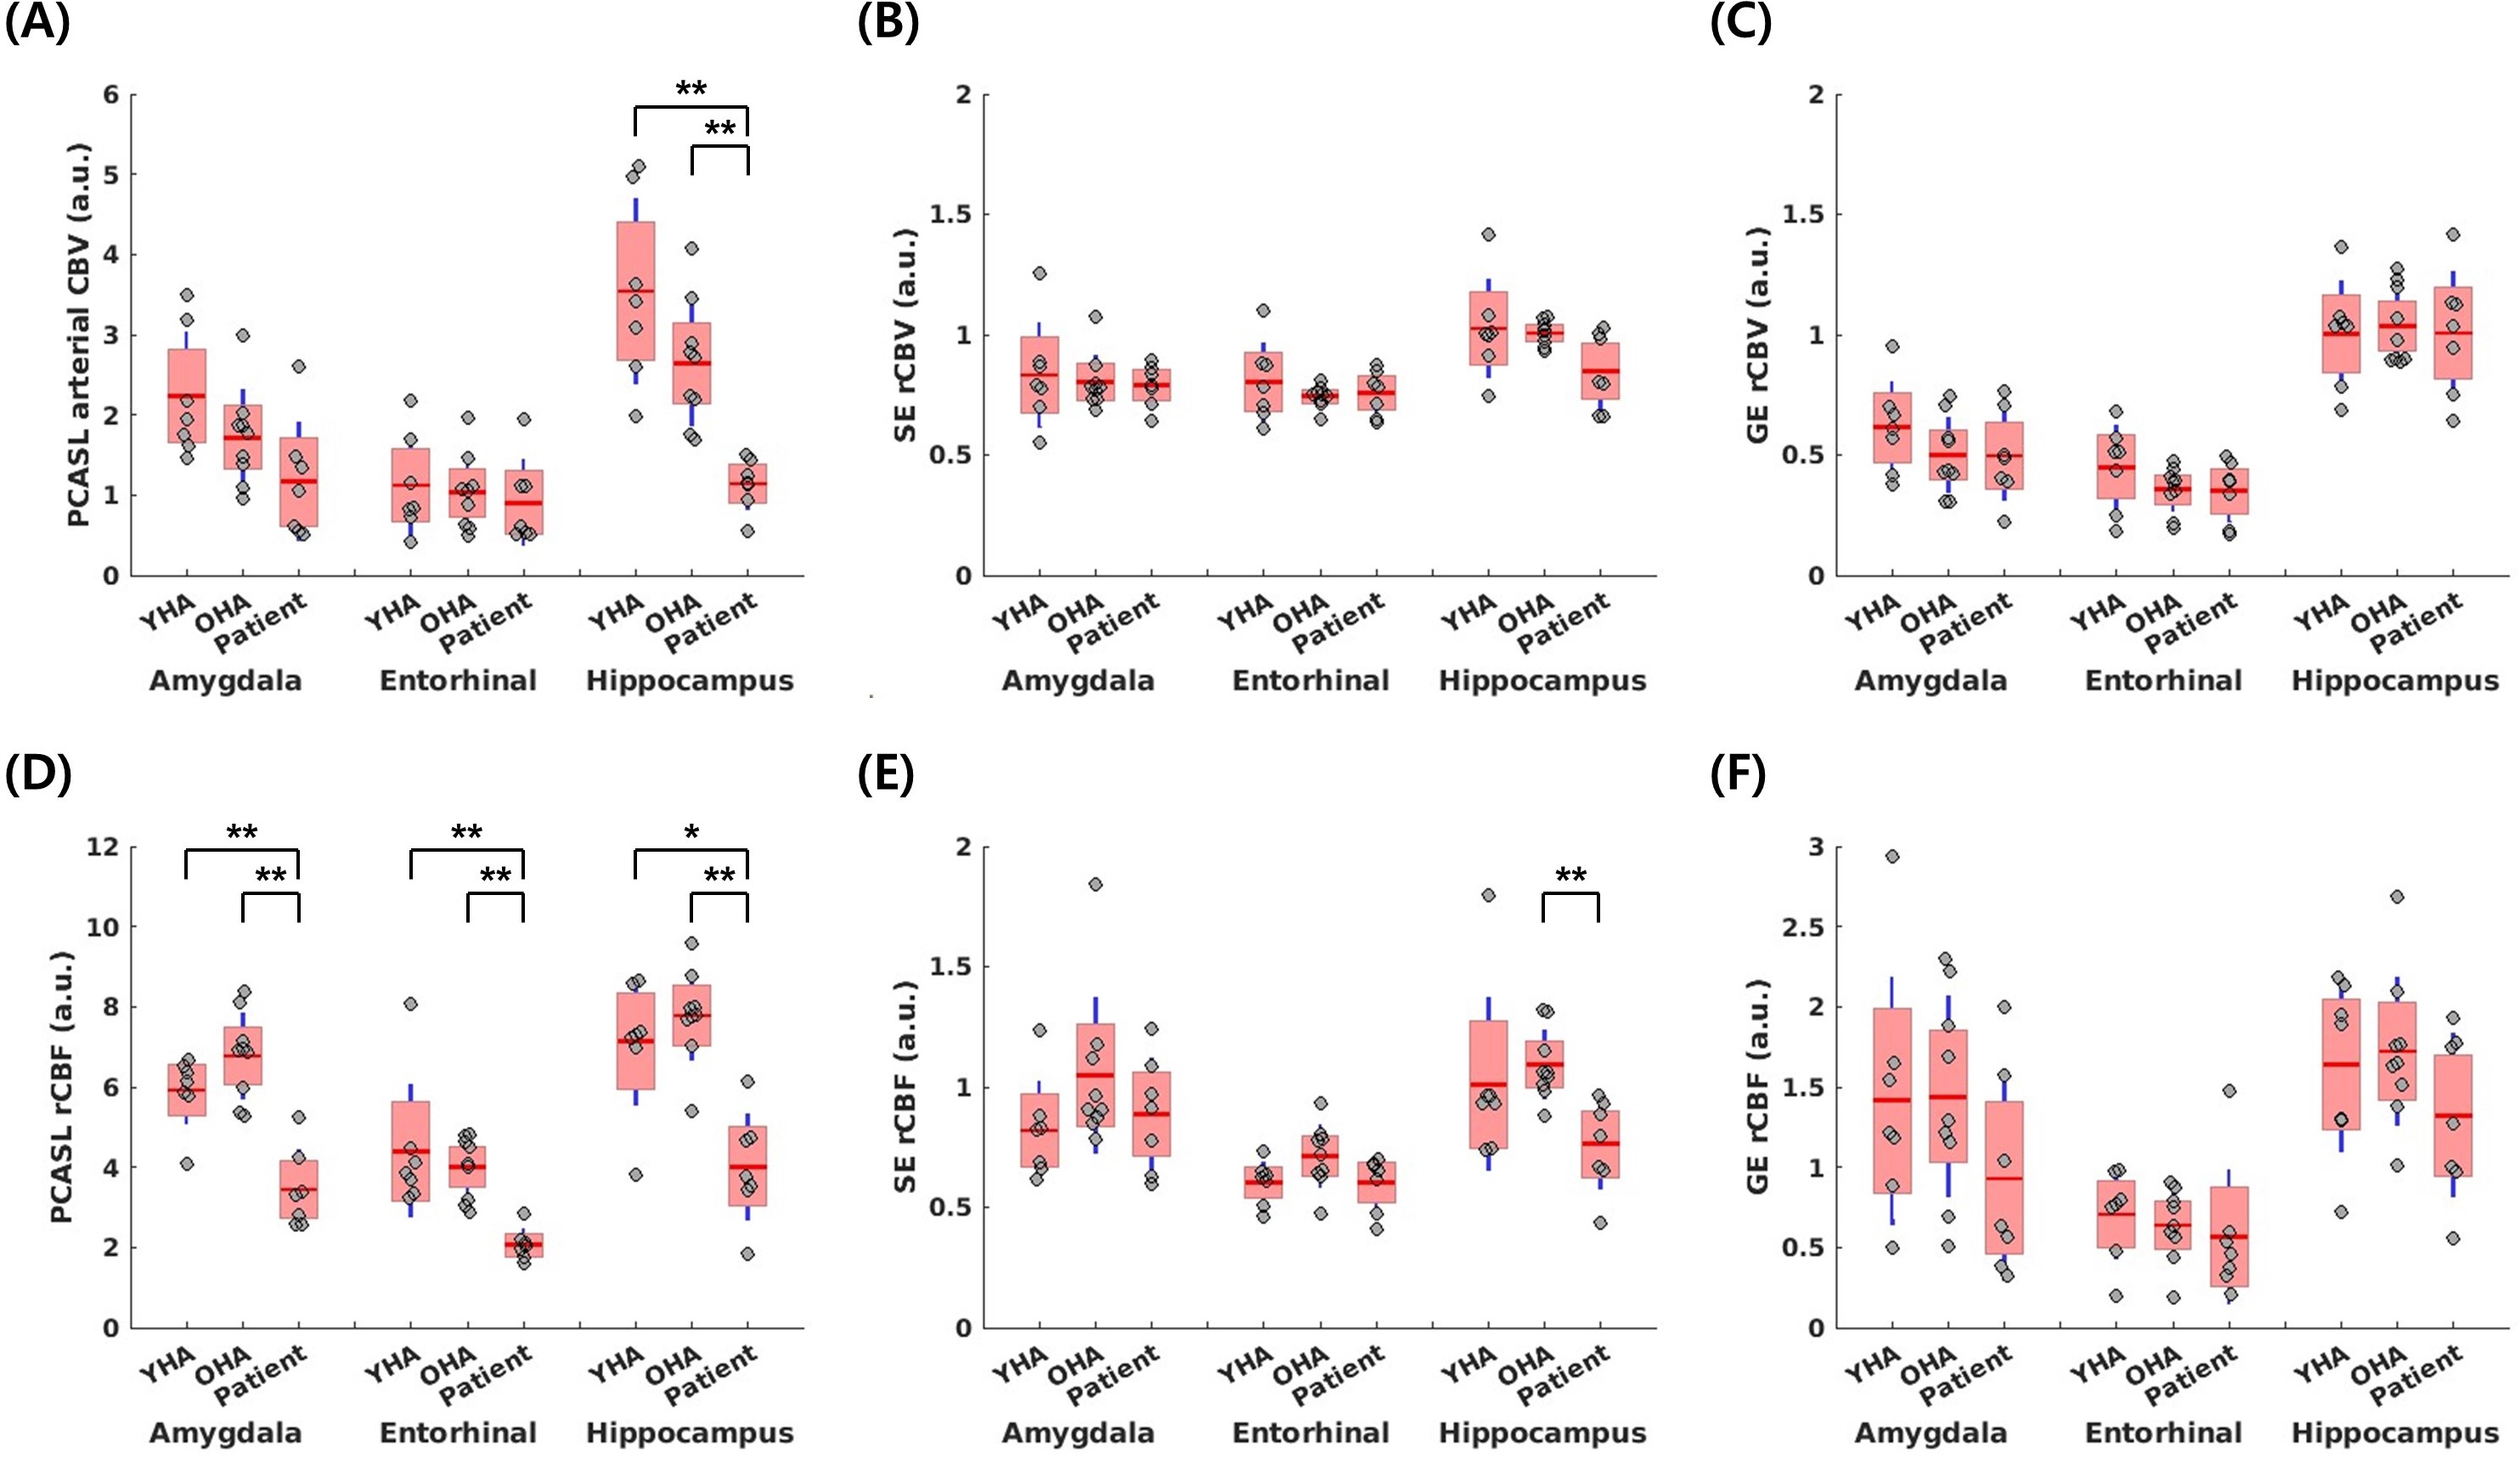
Figure 4. Comparisons of perfusion parameters in the amygdala, entorhinal cortex, and hippocampus. (A): arterial CBV from PCASL. (B): rCBV from SE DSC MRI. (C): rCBV from GE DSC MRI. (D): rCBF from PCASL. (E): rCBF SE DSC MRI. (F): rCBF from GE DSC MRI. *: P-value<0.05 and **: P-value<0.005 in Mann-Whitney U test after adjusting for false discovery rate.
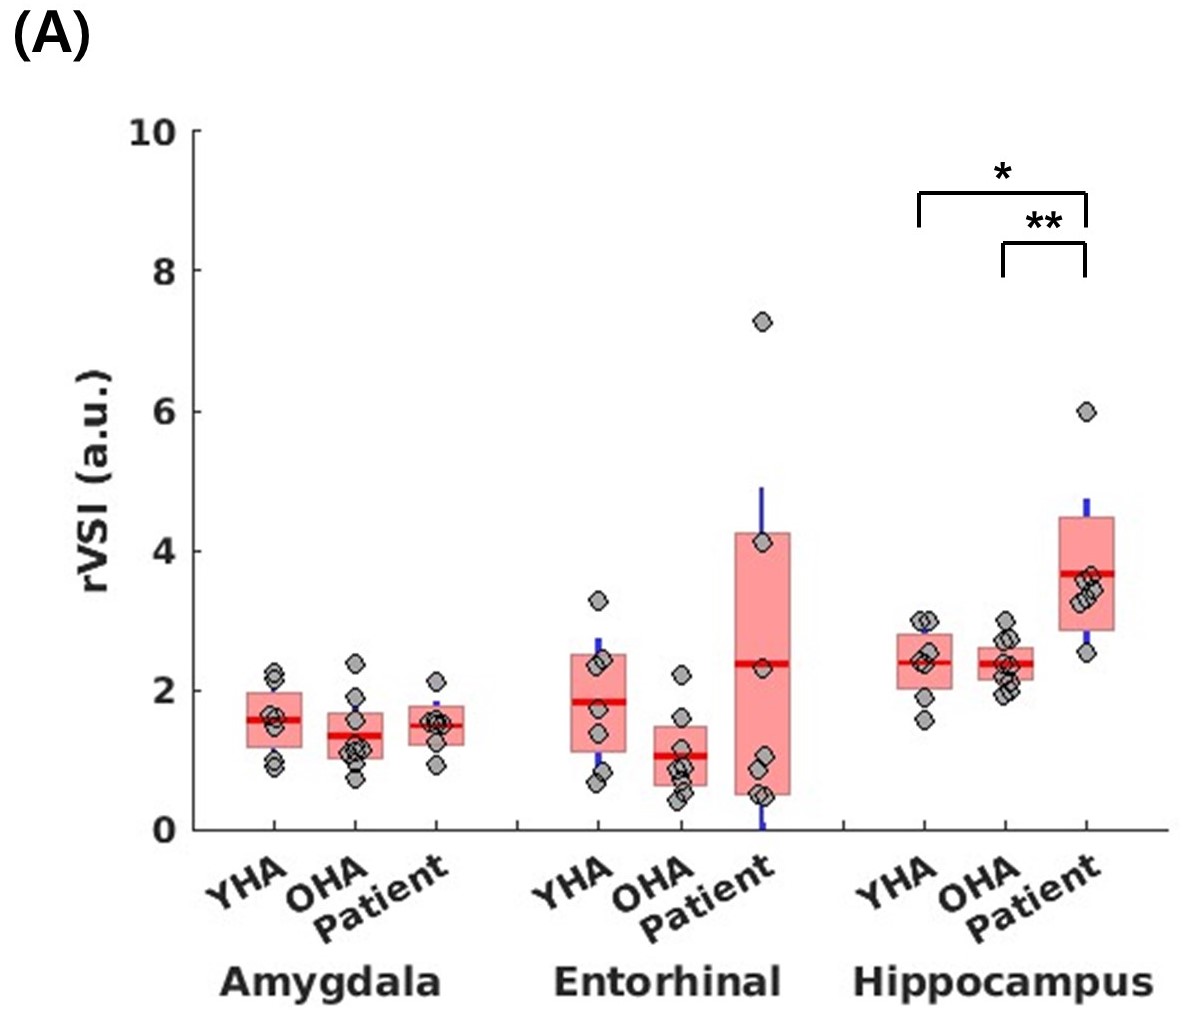
Figure 5. Comparison of rVSI in the amygdala, entorhinal cortex, and hippocampus. *: P-value<0.05 and **: P-value<0.005 in Mann-Whitney U test after adjusting for false discovery rate.