0407
Coupling between low-frequency hemodynamic oscillations and cerebrospinal fluid flow is altered in patients with cerebral amyloid angiopathy1Neurology, Massachusetts General Hospital, Harvard Medical School, Boston, MA, United States, 2C.J. Gorter MRI Center, Department of Radiology, Leiden University Medical Center, Leiden, Netherlands, 3Biomedical Engineering, Boston University, Boston, MA, United States, 4Athinoula A. Martinos Center for Biomedical Imaging, Department of Radiology, Harvard Medical School, Massachusetts General Hospital, Charlestown, MA, United States
Synopsis
Keywords: Dementia, Neurofluids, Neurovascular, small vessel disease
Cerebral amyloid angiopathy (CAA) is characterized by the accumulation of amyloid-β in the vessel walls. Prominent manifestations of CAA include enlarged perivascular spaces (ePVS) and lower amyloid-β concentrations in CSF, which may be the result of impaired brain clearance. CAA patients also demonstrate impaired evoked vascular reactivity. Whether vascular dysfunction is associated with impaired fluid movement in the human brain remains unclear. Here we show that BOLD-CSF coupling is reduced in CAA patients compared to elderly controls, which is a first demonstration of a cerebral small vessel disease affecting CSF motion.Introduction
Cerebral amyloid angiopathy (CAA) is a common age-related disease characterized by the accumulation of amyloid-β in the vessel walls. Prominent manifestations of CAA include enlarged perivascular spaces (ePVS) and lower amyloid-β concentrations in cerebrospinal fluid (CSF), which may be the result of impaired brain clearance1. CAA patients also demonstrate impaired evoked vascular reactivity in response to visual stimuli2,3. Whether vascular dysfunction is associated with impaired fluid movement in the human brain remains however unclear.Recently, a direct link between low-frequency hemodynamic oscillations and CSF-flow in the 4th ventricle (BOLD-CSF coupling) was demonstrated in healthy subjects4, hinting towards neurovascular slow waves being a driving force for CSF-flow. We therefore asked whether reduced hemodynamic oscillations such as observed in CAA would be associated with BOLD-CSF coupling reduction, as this could be considered a first hint towards proving that impaired clearance is an important underlying disease process in CAA.
We first assessed whether the previously described BOLD-CSF coupling was also observed in our group of awake, older individuals. Second, we investigated whether this coupling was disrupted in CAA patients. Finally, we tested whether the BOLD-CSF coupling was associated with markers of disease severity and progression.
Methods
All participants provided written informed consent and all experiments were performed in accordance with local Massachusetts General Hospital (MGH) IRB regulations. MRI scans were retrospectively analyzed in two already acquired datasets.The first dataset was acquired at 7T (Siemens Magnetom, Erlangen, Germany) with a high-temporal resolution optimized to interrogate the BOLD-CSF coupling in detail in CAA patients recruited from the MGH stroke clinic and similar-aged controls. As CSF-inflow can only be measured on CSF located on the first slices of the resting state (rs)-fMRI imaging volume, individuals were excluded when the first slice was not positioned at the level of the fourth ventricle (n=14) or for significant motion artifacts (n=4), leaving 11 CAA patients (age=71±5 years) and 6 elderly controls (age=68±8 years). Each dataset included a 3D T1-weighted scan (TE/TR=1.76/2500 ms, resolution of 0.75 mm) and a high temporal resolution rs-fMRI scan acquired using single-shot gradient echo EPI readout (TE/TR=17/369 ms, 1200 dynamics, SMS=5, 25 slices, resolution=3.2 mm isotropic, flip angle=30◦).
The second dataset was acquired at clinical field strength (3 Tesla, Siemens Prisma) with conventional temporal resolution to assess the relationship with other disease markers in a larger group of probable CAA patients recruited from the MGH memory clinic. After exclusion for incorrect positioning (i.e. not on the foramen magnum, n=18) or for motion artefacts (n=9), the final 3T dataset included 15 probable CAA patients. Two-year follow-up scans were available for 5 patients. Each dataset included a 3D T1-weighted scan of 1-mm resolution and a conventional rs-fMRI scan (TE/TR=30/3000 ms, 124 dynamics, 46 slices, resolution=3 mm isotropic).
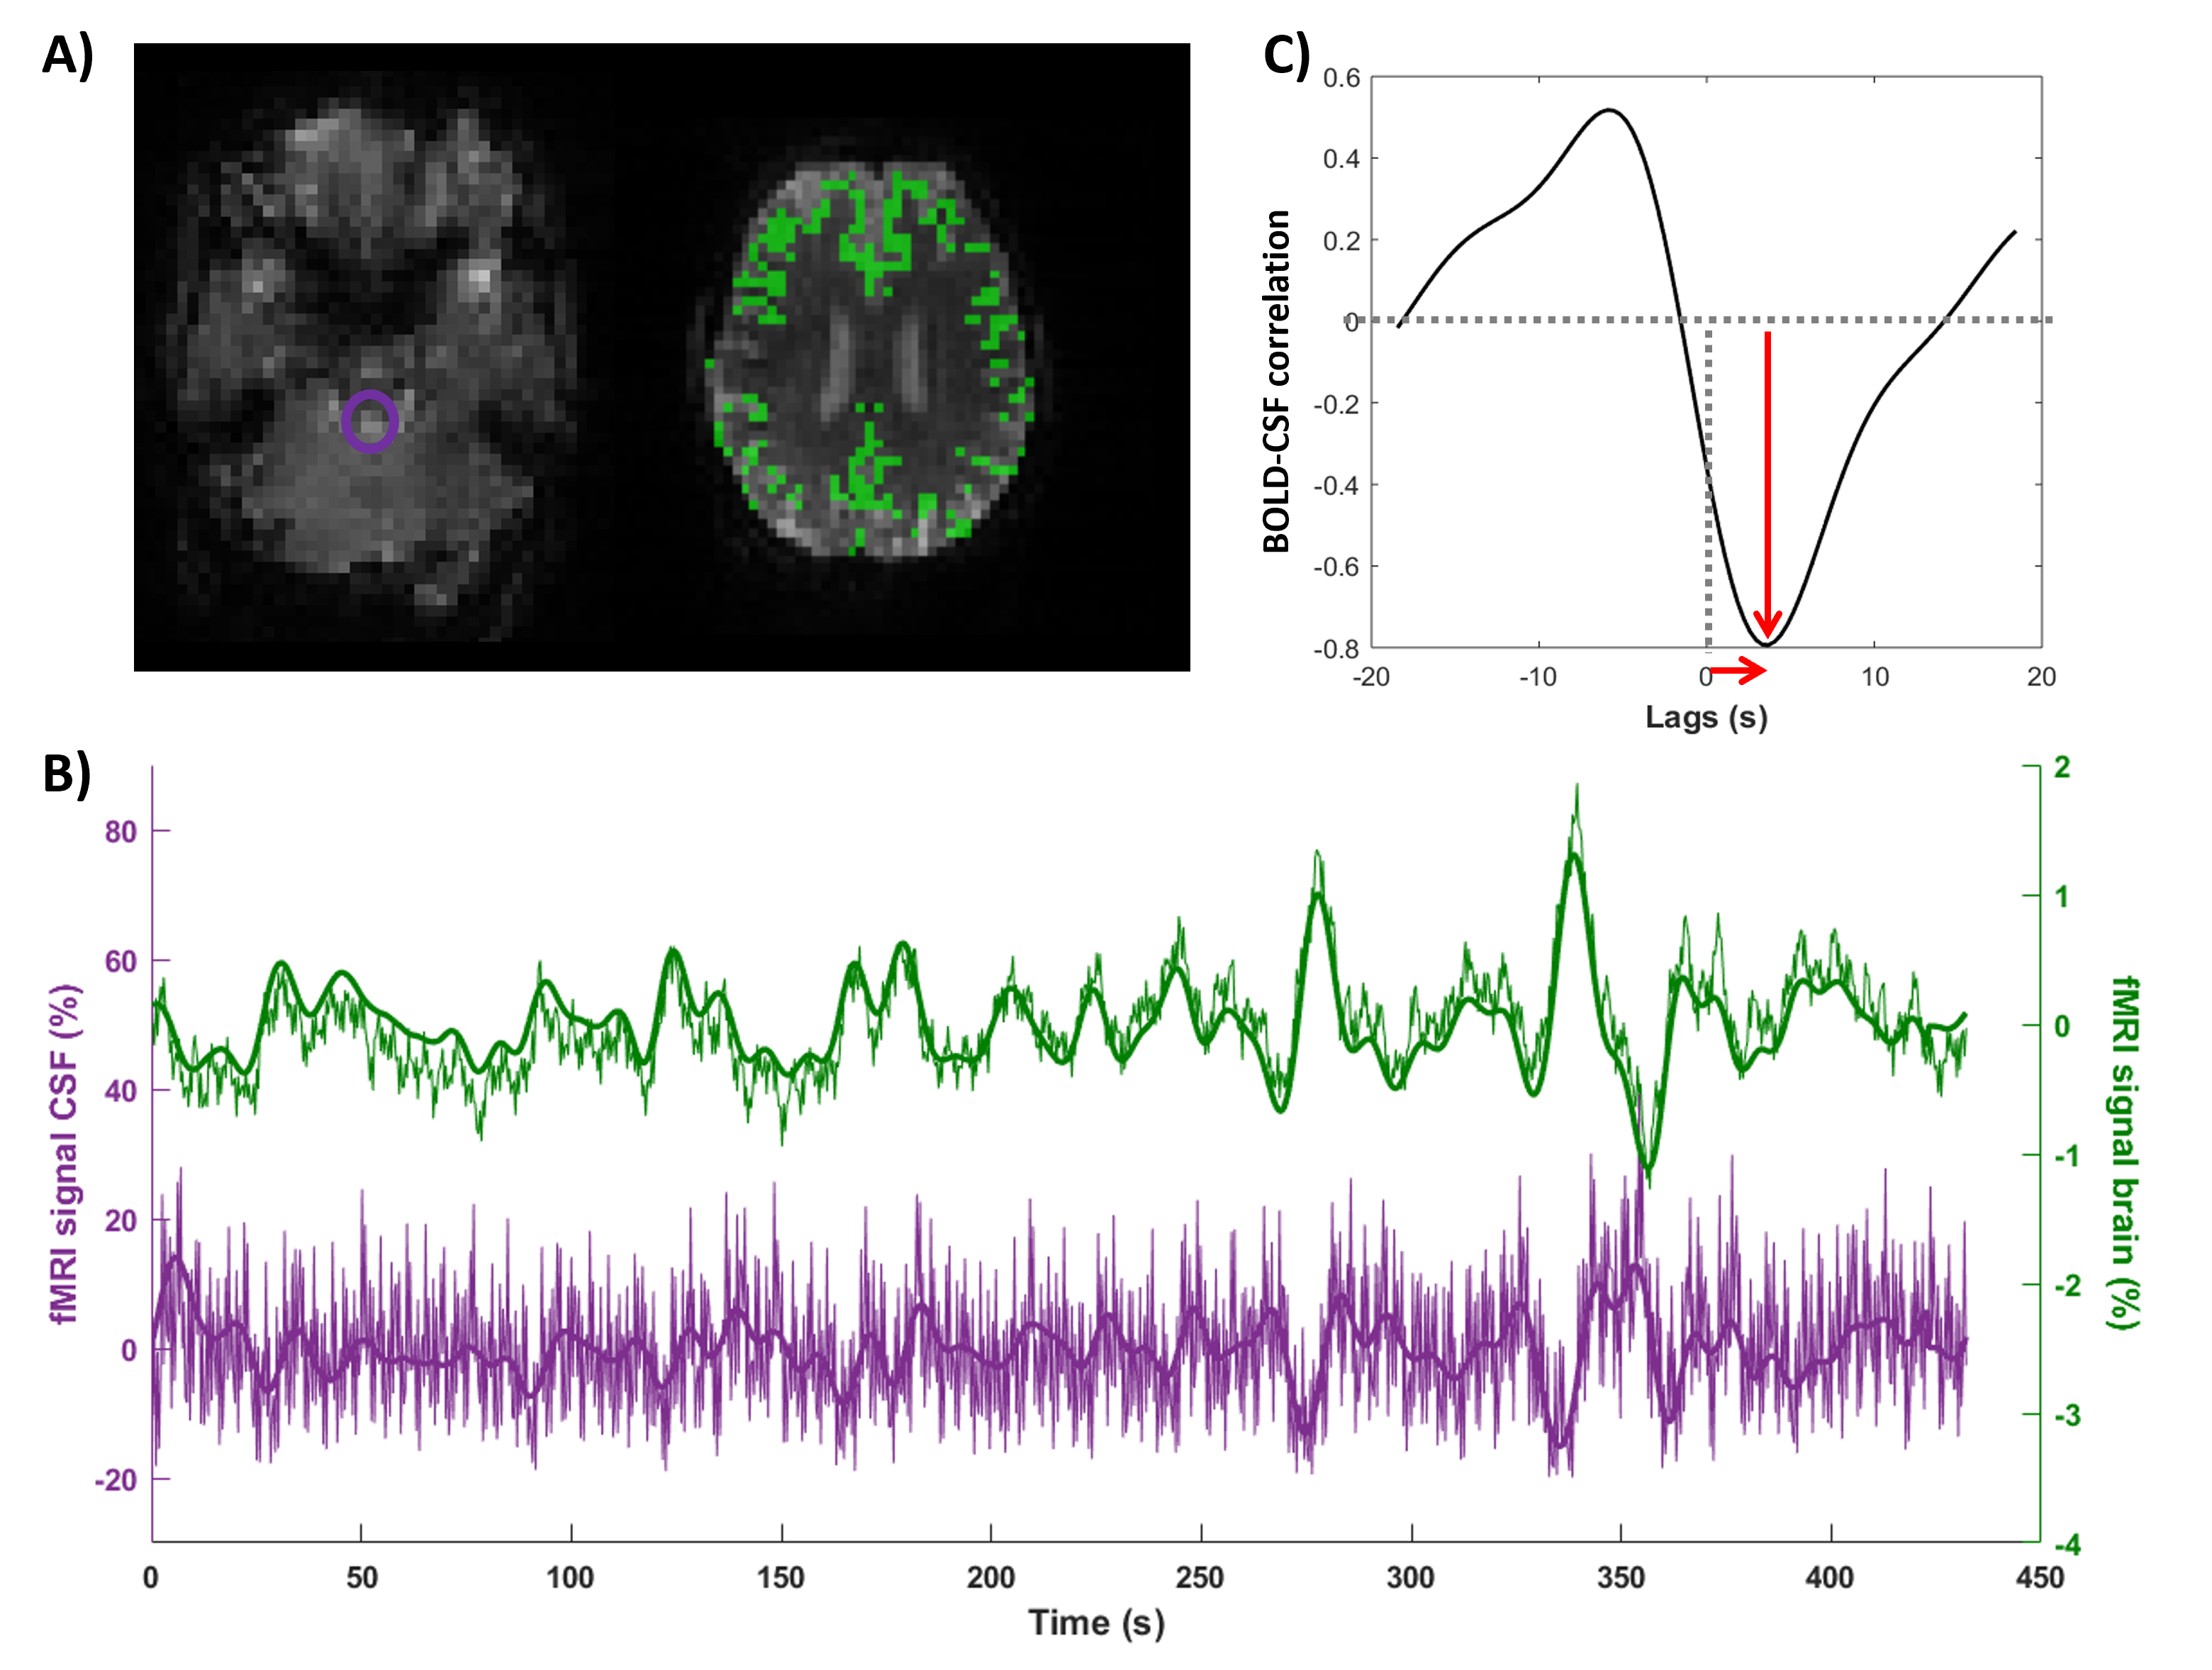
rs-fMRI scans were slice-time and motion corrected using SPM12. A T1w-based GM-mask was co-registered to the rs-fMRI scan to retrieve the GM signal. ROIs were manually drawn on the fourth ventricle (7T) and on the foramen magnum (3T) of the first slice of the non-motion corrected rs-fMRI to obtain the CSF-signal. The CSF and GM-BOLD signals were normalized, detrended and low-pass filtered at 0.1 Hz4. Next, the normalized cross-correlation of the BOLD and CSF signals was computed over a window of -20 to 20 s. The amplitude of the cross-correlation was defined as the peak that was closest to 0, be it positive (correlation) or negative (anti-correlation), see Figure 1C. The lag corresponding to this (anti)-correlation peak was retrieved as well. Neuroimaging markers of small vessel disease (count of ePVS and microbleeds, brain volume) were assessed according to the STRIVE criteria.
Results
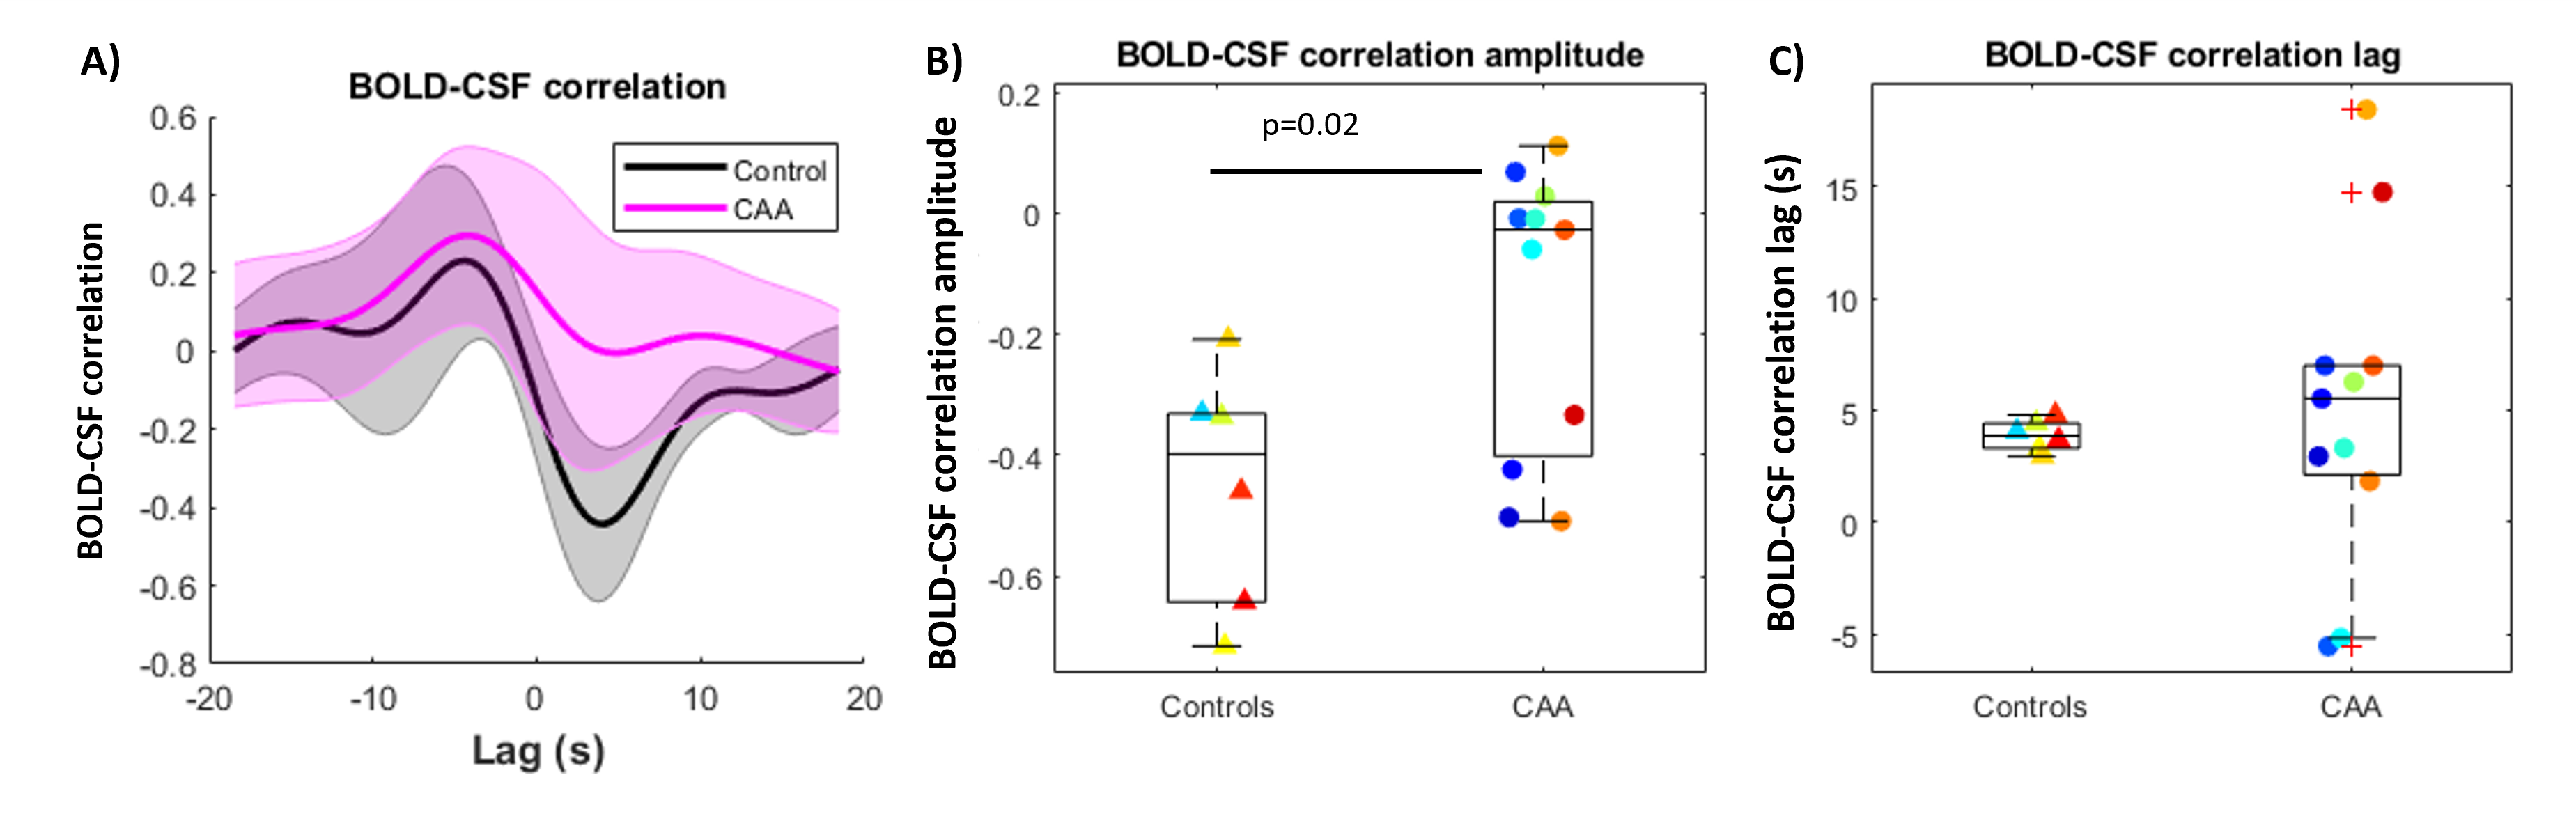
Using high-temporal rs-fMRI at 7T, we successfully detected the BOLD-CSF coupling in awake healthy elderly subjects (Fig.1). The average BOLD-CSF coupling amplitude (correlation=-0.4±0.2) and lag (3.9±0.6 s) were similar to literature4 (Fig.2).We found a reduction in BOLD-CSF coupling in CAA patients compared to elderly controls (Fig.2): in CAA, the amplitude was significantly weaker (-0.15±0.2 in CAA versus -0.4±0.2 in controls, p=0.02) and a larger spread in lags was observed across patients (5.1±6.9 s in CAA versus 3.9±0.6 s, p=0.7).
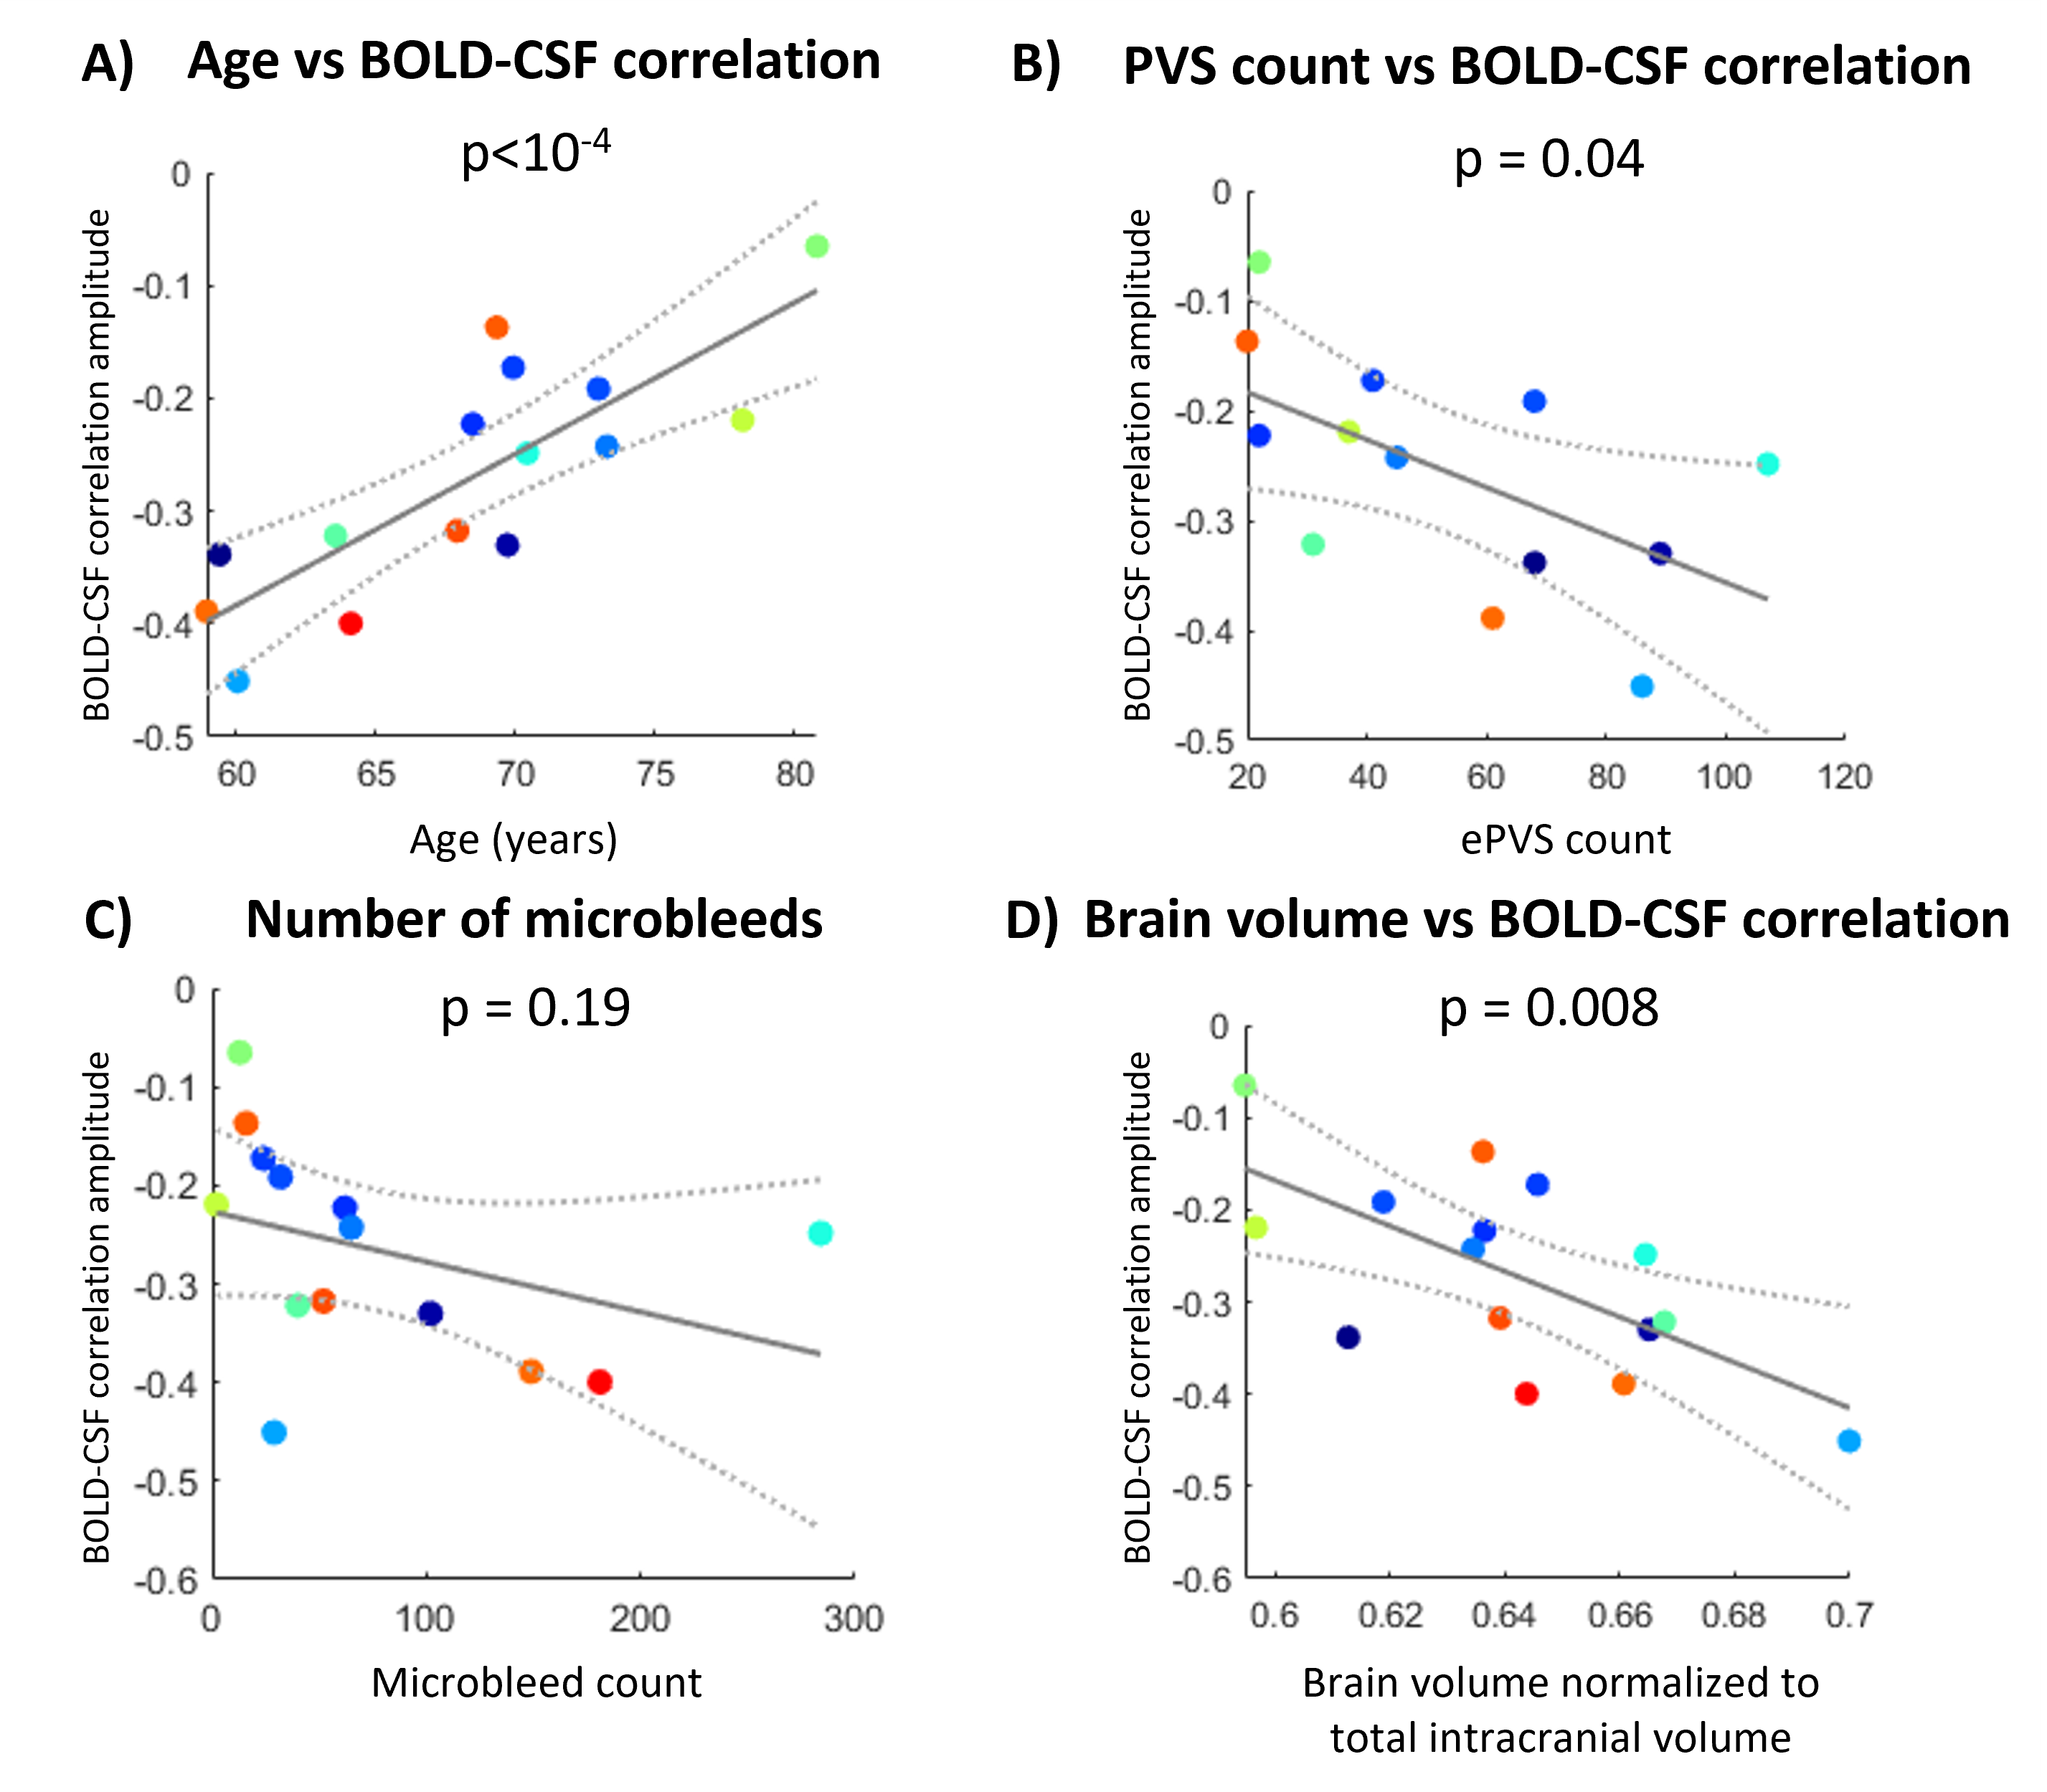
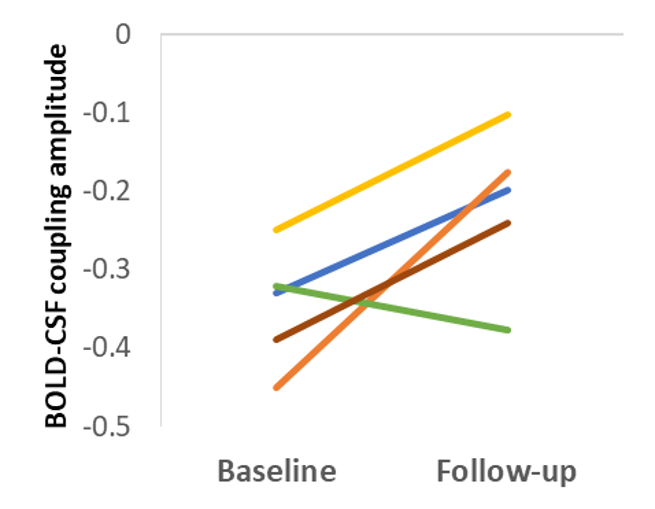
In probable CAA patients from the 3T dataset, the strength of the BOLD-CSF coupling deteriorated with higher age (p<10-4), increased with brain volume (p=0.008), but not with the number of microbleeds (p=0.19), as shown in Fig.3. Surprisingly, the BOLD-CSF coupling was stronger with higher count of ePVS (p=0.04, Fig.3b). At the 2-year follow-up session, four out of five probable CAA patients had a further loss in BOLD-CSF coupling amplitude (Fig. 4).
Discussion
BOLD-CSF coupling is reduced in CAA patients compared to elderly controls. This first demonstration of a cerebral small vessel disease affecting CSF motion potentially reflects reduced hemodynamic function due to the pathological accumulation of amyloid-β in vessel walls. Moreover, the BOLD-CSF coupling was found to deteriorate with age, disease severity, and time, and was related to ePVS count on MRI.Acknowledgements
This project was funded by Alzheimer Nederland (Young Outstanding Researcher Award WE.25-2020-05 to Susanne van Veluw and travel grant to Lydiane Hirschler) and was part of the research program Innovational Research Incentives Scheme Vici with project number 016.160.351, which was financed by the Netherlands Organisation for Scientific Research (NWO).References
1. Greenberg, S. M. et al. Cerebral amyloid angiopathy and Alzheimer disease — one peptide, two pathways. Nature Reviews Neurology (2020) doi:10.1038/s41582-019-0281-2.
2. Dumas, A. et al. Functional magnetic resonance imaging detection of vascular reactivity in cerebral amyloid angiopathy. Ann. Neurol. (2012) doi:10.1002/ana.23566.
3. van Opstal, A. M. et al. Cerebrovascular function in presymptomatic and symptomatic individuals with hereditary cerebral amyloid angiopathy: a case-control study. Lancet Neurol. (2017) doi:10.1016/S1474-4422(16)30346-5.
4. Fultz, N. E. et al. Coupled electrophysiological, hemodynamic, and cerebrospinal fluid oscillations in human sleep. Science. (2019) doi:10.1126/science.aax5440.
Figures