0402
An Open-Source Self-navigated Multi-Echo Gradient Echo Acquisition for R2* and QSM mapping using Pulseq and Model-Based Reconstruction1Massachusetts General Hospital, Athinoula A. Martinos Center for Biomedical Imaging, Charlestown, MA, United States, 2Department of Radiology, Harvard Medical School, Boston, MA, United States, 3Cardiff University Brain Research Imaging Centre, Cardiff, United Kingdom, 4Donders Institute for Brain, Cognition and Behavior, Radboud University, Nijmegen, Netherlands
Synopsis
Keywords: Pulse Sequence Design, Quantitative Susceptibility mapping, open-source, pulseq
We propose an open-source multi-echo GRE sequence and reconstruction algorithms for rapid acquisition and harmonization of QSM. This is implemented using Pulseq, where different sampling patterns are used across echoes to provide complementary information and facilitate the proposed MOdel BAsed (MOBA) reconstruction. MOBA estimates M0, R2* and frequency maps using nonlinear optimization and is implemented in BART to facilitate dissemination. B0 correction is performed using 1D navigators acquired during the crusher gradients in each repetition. Motion navigators inserted in the sequence permit robust estimation of motion parameters with time frames of ~13seconds, and will lend themselves to retrospective motion correction.Introduction
There are various ongoing projects aiming at harmonization of protocols across vendors. In the context of QSM, this has various levels: acquisition; computation of susceptibility maps and reporting. The currently recommended acquisition is a 3D multi-echo gradient echo (3DME-GRE) acquired axially to reduce acquisition time to ~6 min and be able to achieve 1 mm iso. resolution while using coils that might not be state of the art (1).This remains long research/clinical applications (with motion being a risk), and does not account for respiration related B0 fluctuations known to degrade R2* and susceptibility maps. Furthermore, gradient/RF spoiling, excitation profiles and image reconstruction can all contribute to the differences in the implementation between different vendors, even if this appears to have little impact in R2* and QSM when echo times (TEs) are accounted for (2-5).
We introduce a framework for acquisition based on Pulseq (6) that is vendor-neutral and open-source, and where data of subject motion and B0 fluctuations are encoded for artifact reduction, and with an acquisition pattern that is compatible with model-based reconstruction to reduce scan time.
Methods
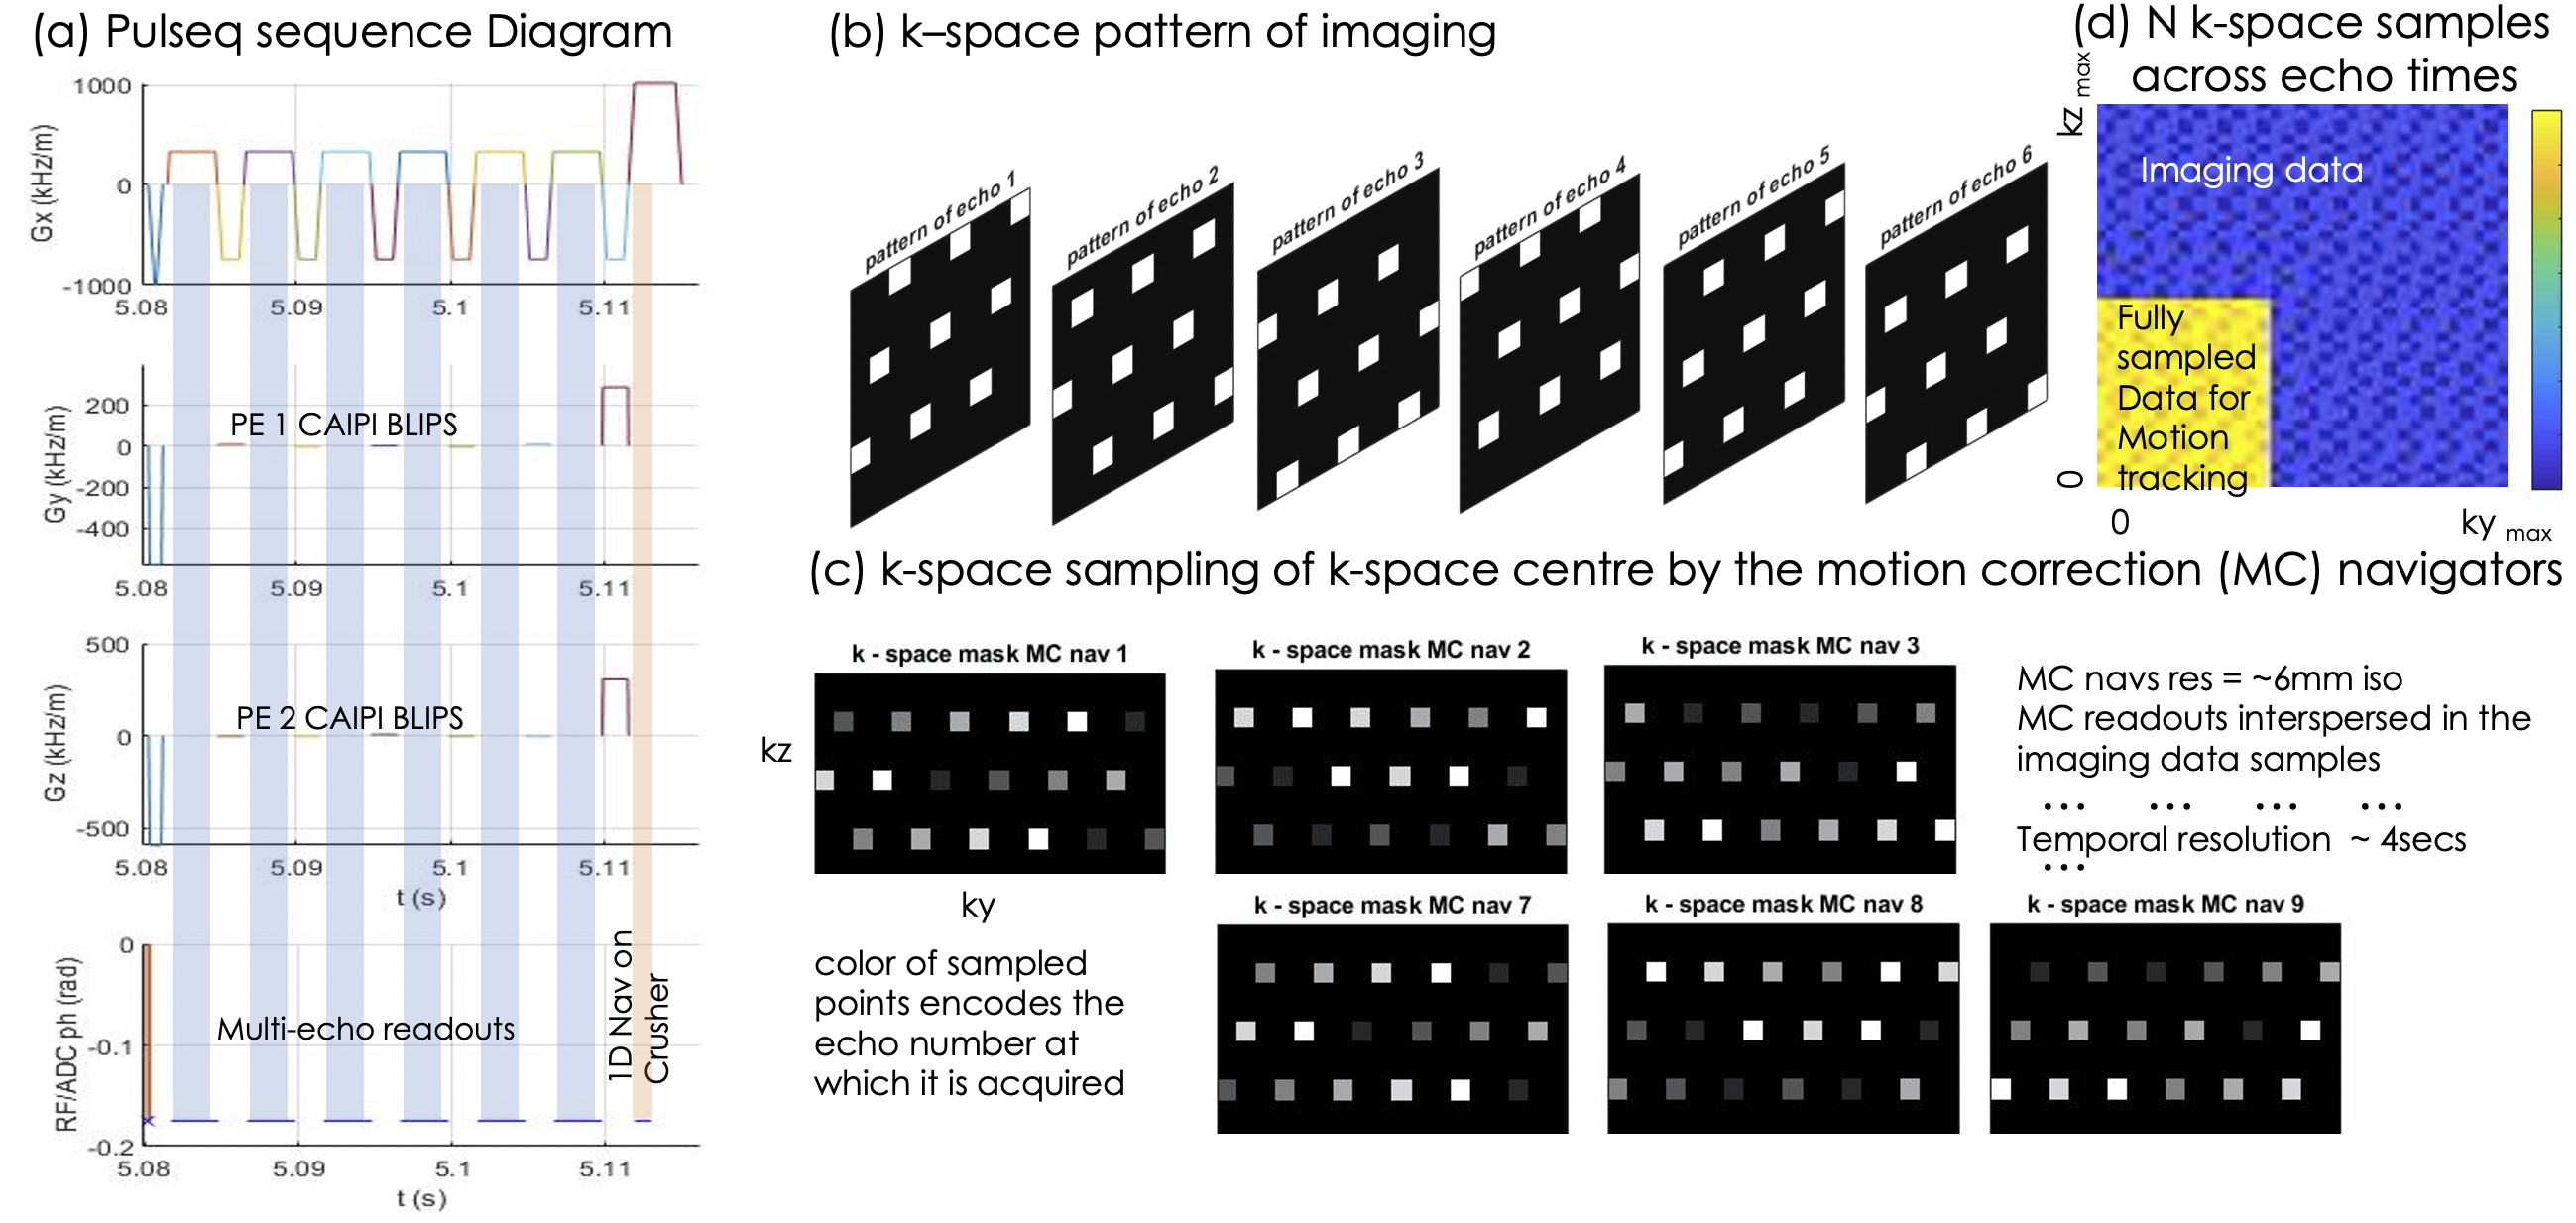
Pulseq was used to implement a 3DME-GRE sequence using controlled aliasing patterns that are shifted across TEs (Fig.1a/b). A 1D navigator was added as part of the crusher to record (Fig.1a) respiration-related information.Acquisitions were performed on a 3T Prisma equipped with a 32-channel coil using the following:
R=9-fold acceleration: $$$ TR=35ms$$$; $$$TE_1/\Delta TE /TE_6 =3/5/28ms$$$; $$$ \theta=15^o$$$; acceleration $$$[R_y, R_z,Caipi_{z-shift}, Caipi_{z-echo-shift}] = [1,9,3,2]$$$; Sagittal acquisition FOV=[256,198,225]mm, 1mm isotropic; Central [27 ,36] PEy and PEz lines were fully sampled and used for motion correction; acquisition time 4mins
R=12-fold acceleration: $$$[R_y, R_z,Caipi_{z-shift}, Caipi_{z-echo-shift}] = [1,12,4,2]$$$; acquisition time 3mins, other parameters were the same.
One subject was scanned twice with the above protocol: either breathing normally or taking deep breaths to induce motion and B0 artifacts observed when studying patient populations (7,8).
$$$ B_0$$$ correction was implemented by fitting a first order polynomial to the phase of the navigator data (in regions of sufficient SNR), and applying that correction across all echoes.
The use of navigators for motion correction was evaluated by reconstructing using various sliding windows (Fig.1c), and inspecting the motion correction parameters stability derived by mcflirt (fsl.fmrib.ox.ac.uk). To stabilize the reconstruction and use the signal model $$$ S_0 (r)e^{-TE_n(R_2^* -i 2\pi\cdot f_{B_{0}})}$$$, the fully sampled center of k-space was used as a reference/target 4D image, $$$ S_{GT}(TE_{1->N})$$$. The multi-echo navigators, $$$ S_{nav_n}(TE_{1->N})$$$, were reconstructed with iterative SENSE using L2 regularization on $$$\frac{\partial S_{GT}(TE_{N->1}) S_{nav_n}(TE_{N->1})}{\partial TE} $$$.
MOdel-BAsed Reconstruction (MOBA): Different CAIPI patterns across the echoes and GRE signal modeling were exploited by solving (9): $$ x = (S_{0}, R_{2}^{*}, f_{B_{0}})^{T} = \text{argmin}_{ x} \sum_{\text{TE}}\|P\mathcal{F}C\cdot S_{0} \cdot \text{e}^{-\text{TE} \cdot R_{2}^{*} + i 2\pi\cdot \text{TE} \cdot f_{B_{0}}} - Y\|_{2}^{2} + R(x) $$
While a joint L1-Wavelet sparsity constraint was applied to S0 and R2* maps, Sobolev regularization was adopted for $$$f_{B_{0}}$$$ to enforce smoothness. MOBA was implemented on BART (10) and used GPU acceleration.
Sequence/reconstruction code/data:
https://anonymous.4open.science/r/pulseq_qsm-2DF5
Results
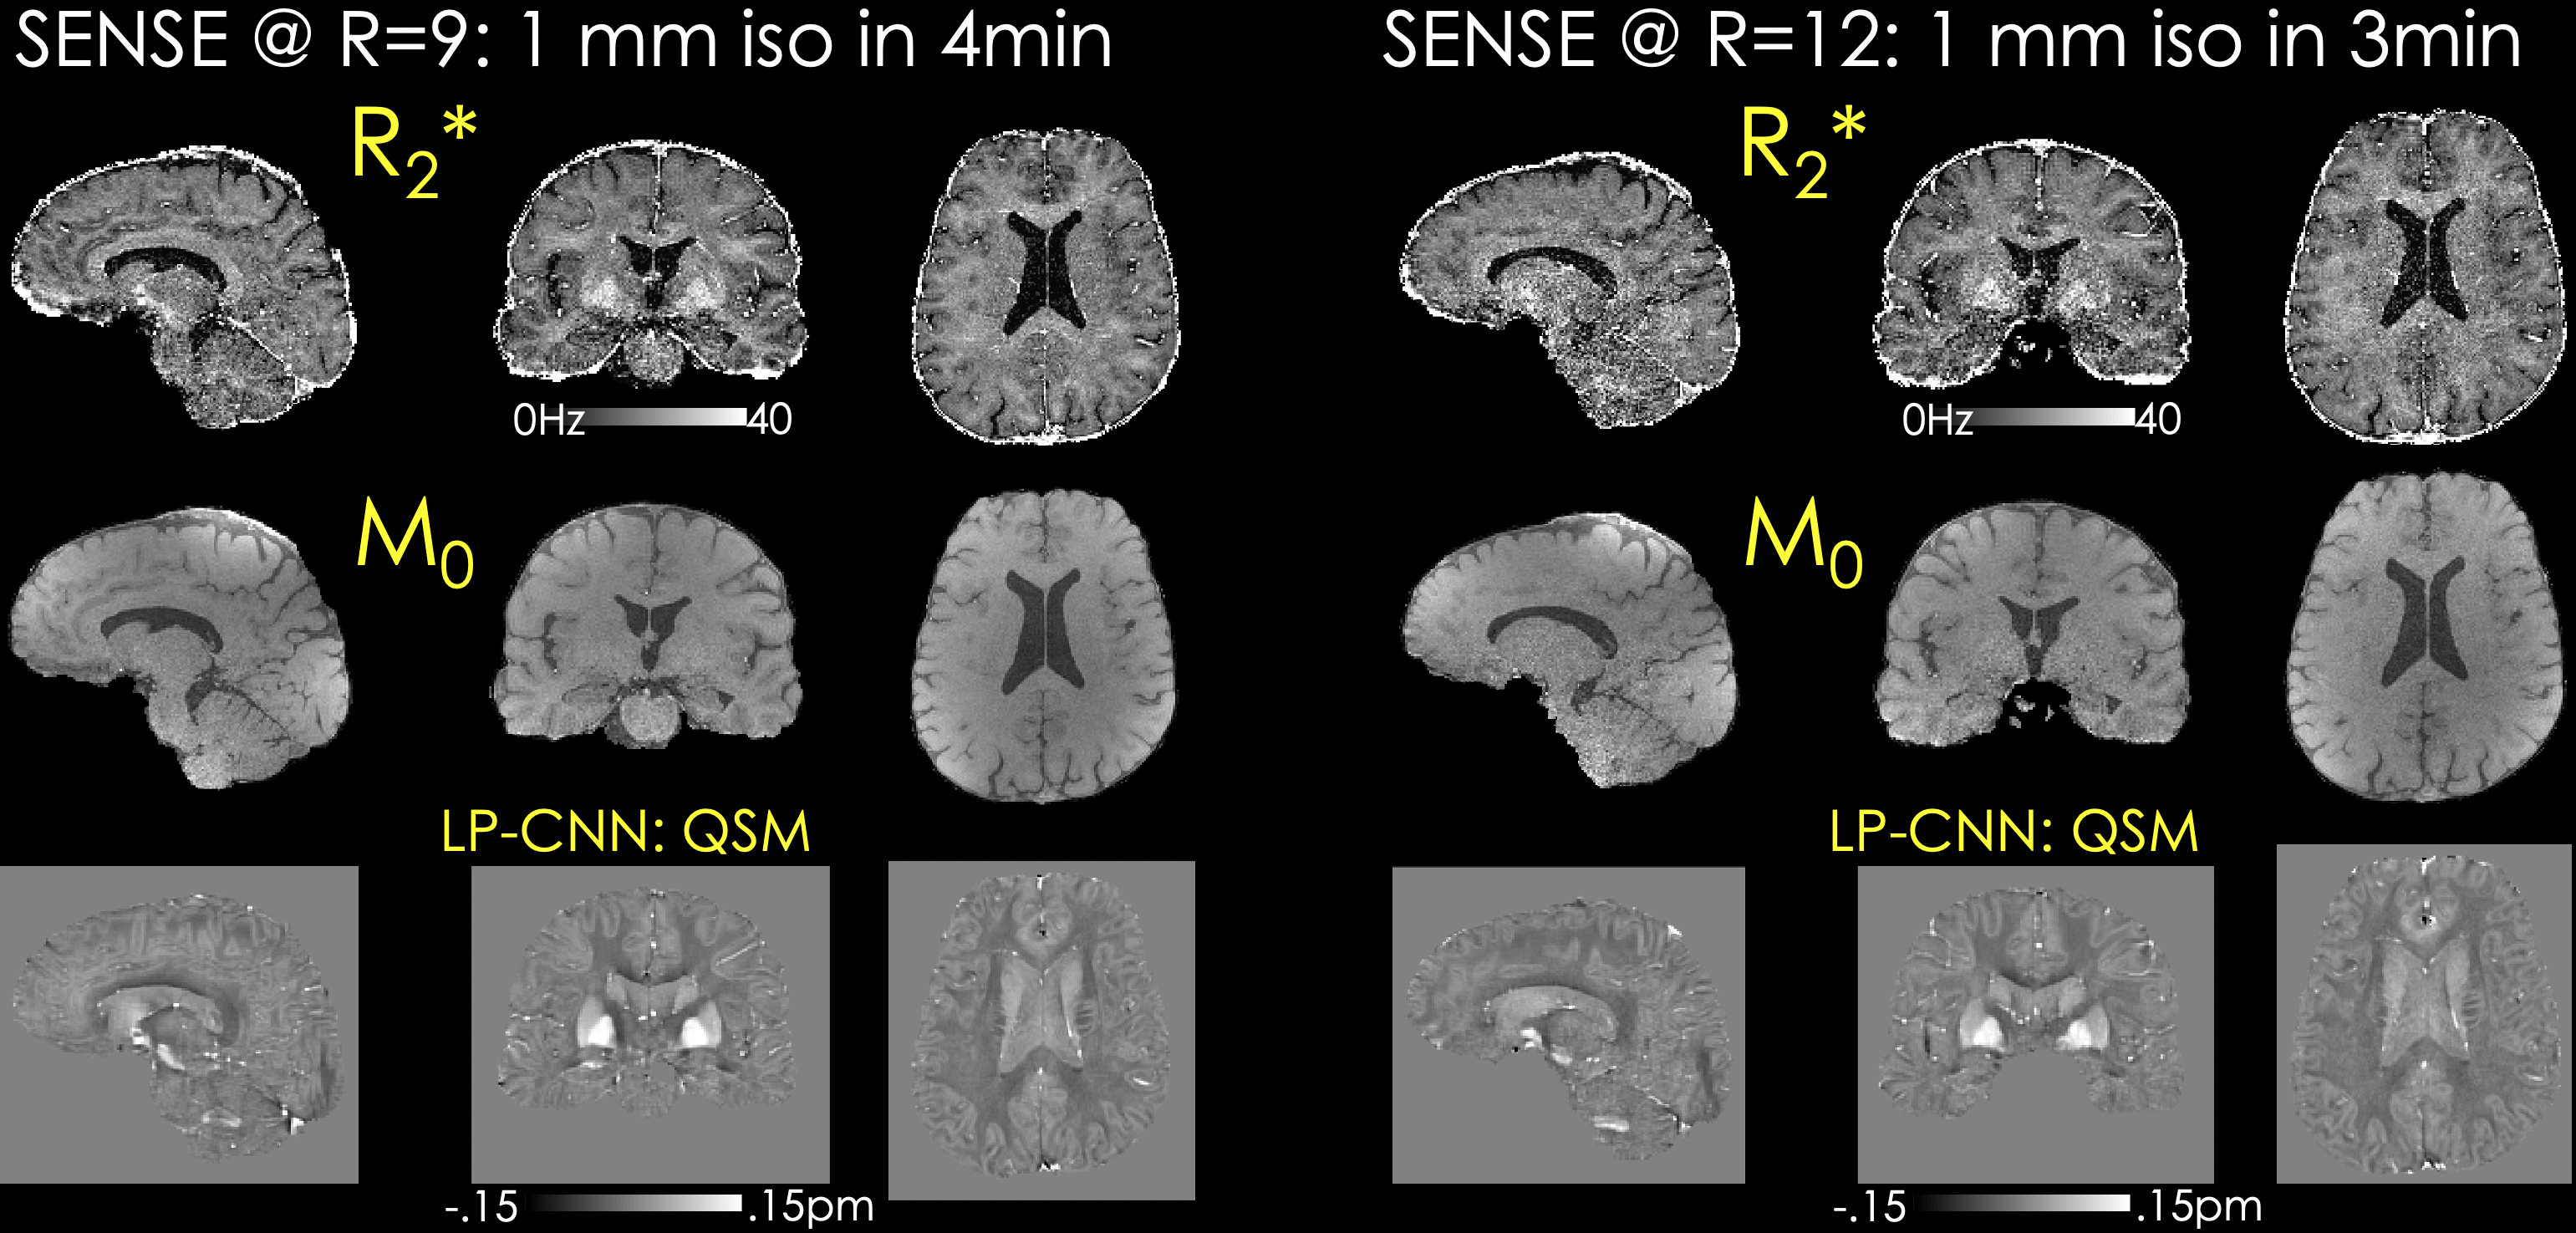
Fig.2a shows that the B0 navigation can clearly detect respiration fluctuations, with the required correction being greater on lower coils, as well as introducing a correction that has an impact on the later echo and R2* maps.Fig.3 depicts R2*, M0 and QSM estimates obtained using SENSE at R=9 and R=12-fold acceleration. SEPIA’s (11) implementation of LP-CNN (12) was used for dipole inversion. MPPCA (13) was applied on multi-echo SENSE volumes for denoising.
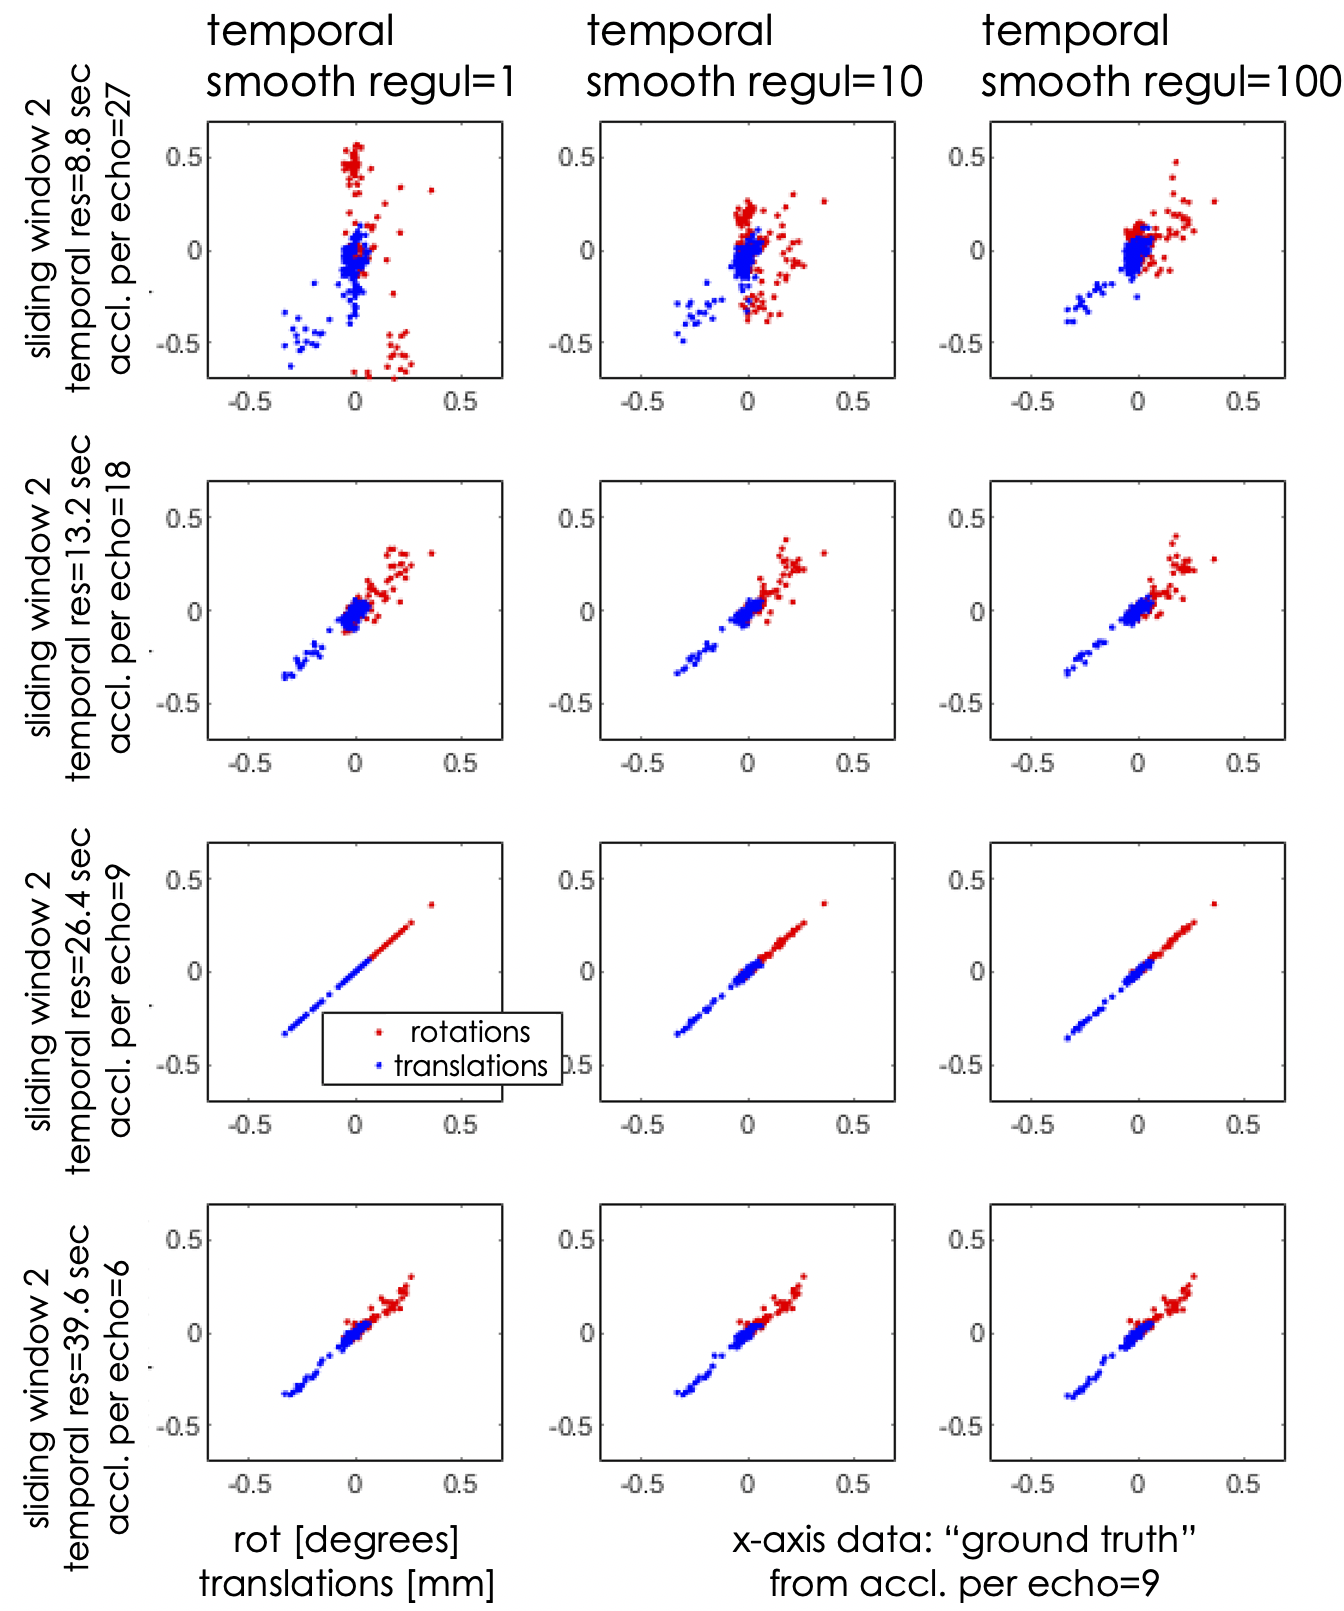
Fig.4 shows the quality of motion estimates in the deep-breathing acquisition as a function of temporal resolution and regularization. Fidelity of the motion estimates is reduced at the temporal resolution of 8.8 sec, whereas better estimates were obtained by increasing the sliding-windowing factor at the cost of increasing the motion sensitivity to 13.2 sec.
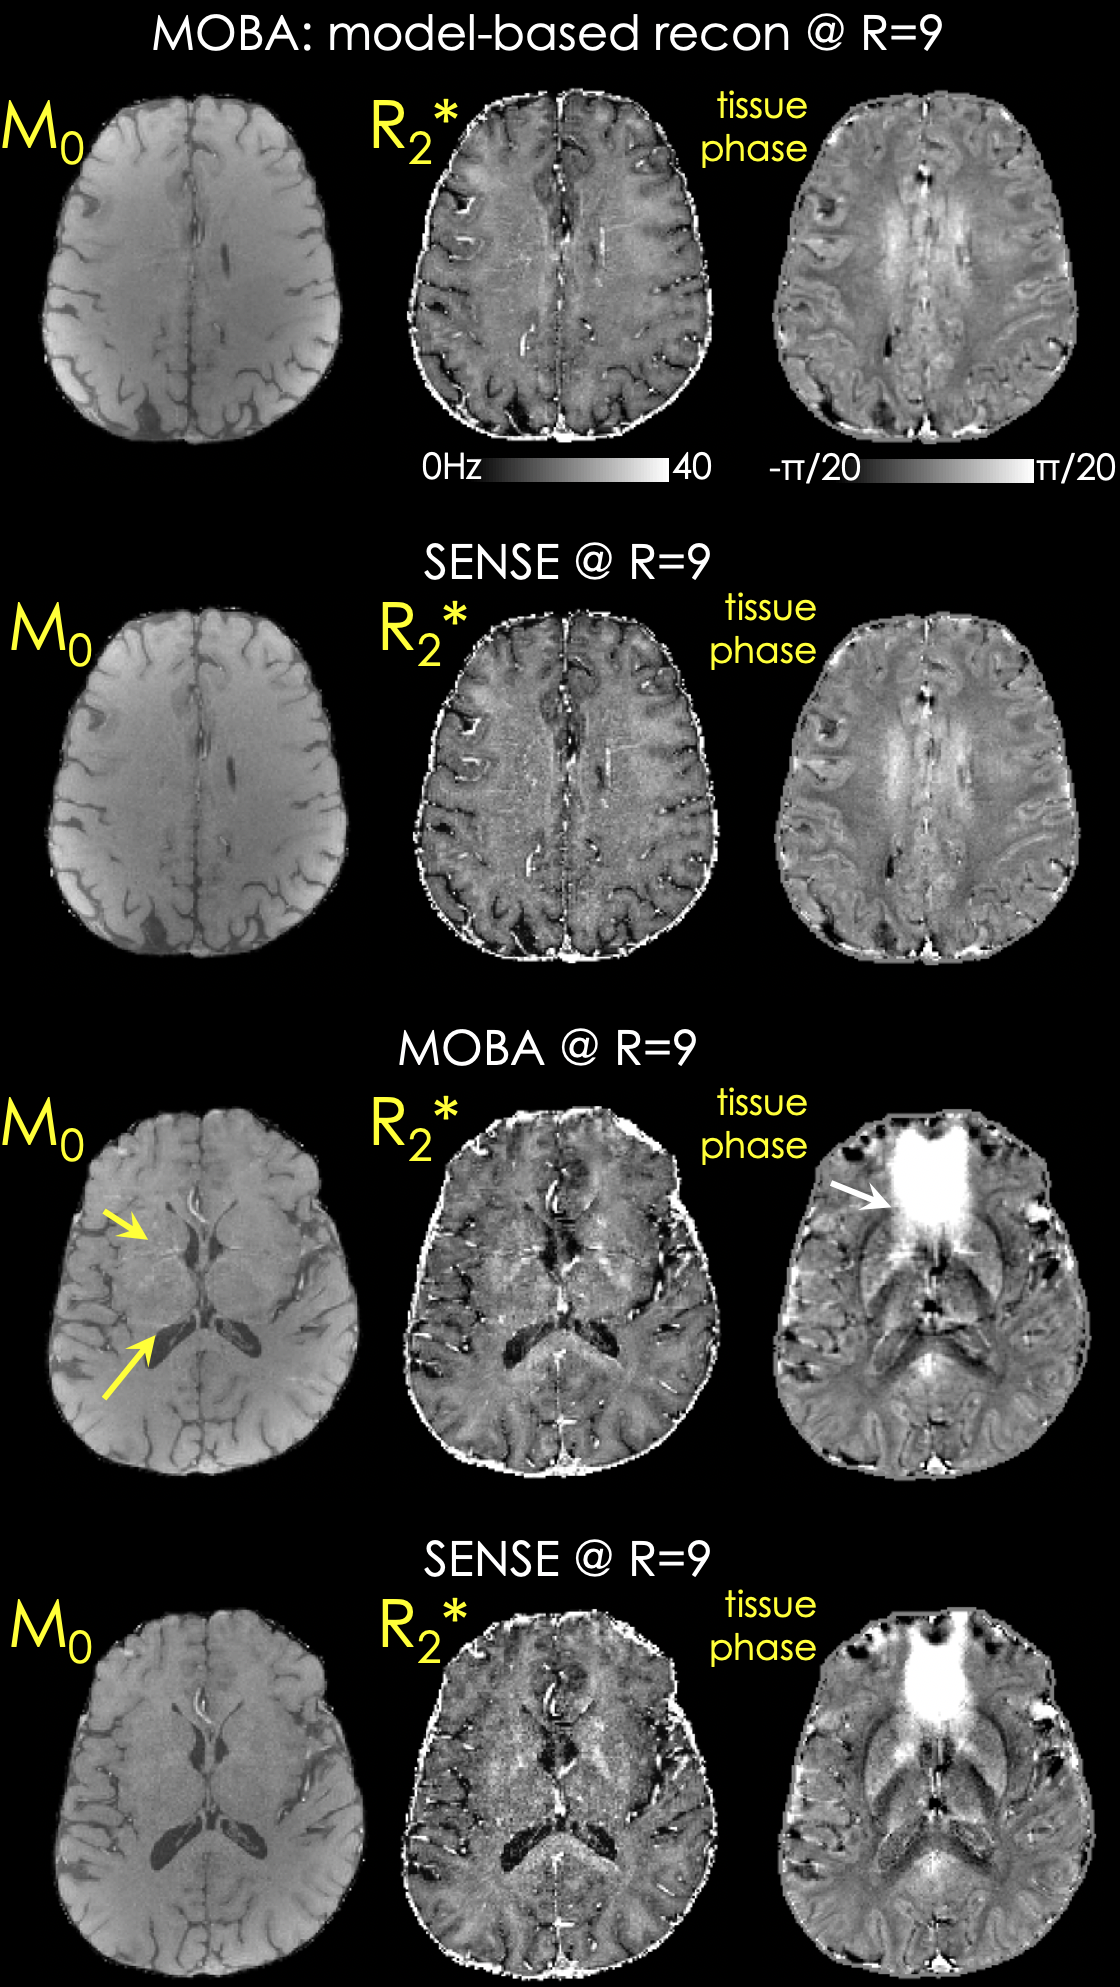
Fig.5 shows two slices from MOBA and SENSE reconstructions at R=9. Improved SNR is observed in the R2* and M0 maps, yet artifacts were visible in the lower slice. Tissue phase was obtained using V-SHARP directly on the $$$f_{B_{0}}$$$ estimate.
Discussion/Conclusion
Proposed framework can be used to benchmark the quality of existing sequences and understand the impact of motion/respiration in manufacturer protocols. R2* mapping quality is typically plagued by short TEs used (as was the case in this pilot data), the use of B0 navigation allows longer TEs, while MOBA combined with controlled aliased patterns across echos allows higher acceleration, keeping clinically acceptable acquisition times in systems with poorer gradients and number of coils. Future work will focus on retrospective motion correction using the navigators.Fig.4 shows that a 3 min acquisition at R=12 is feasible, and no artifacts were visible. Regardless, g-factor penalty contributed to the increased noise especially in the middle of the FOV, which can be mitigated using e.g. wave-CAIPI (14). As pointed out by the arrows in Fig.5, there are residual fat and B0-related artifacts in the lower slices in the MOBA reconstruction. These can be addressed by modeling the fat component in the signal model (9). Future work will explore the ability to accelerate acquisitions in more standard clinical RF setups with 12 and 16 channels using wave encoding and water-fat separated MOBA reconstruction.
Acknowledgements
This work was supported by research grants NIH R01 EB032378, R01 EB028797, R03 EB031175, U01 EB025162, P41 EB030006, U01 EB026996, the NWO grant FOM-N-31/16PR1056, and the NVidia Corporation for computing support.References
1. QMR Lucca 2022 Joint Workshop on MR phase, magnetic susceptibility and electrical properties mapping, Lucca, Italy.
2. Lancione M, Bosco P, Costagli M, et al. Multi-centre and multi-vendor reproducibility of a standardized protocol for quantitative susceptibility Mapping of the human brain at 3T. Physica Medica 2022;103:37–45 doi: 10.1016/j.ejmp.2022.09.012.
3. Ropele S, Wattjes MP, Langkammer C, et al. Multicenter R2* mapping in the healthy brain. Magn. Reson. Med. 2014;71:1103–1107.
4. Leutritz T, Seif M, Helms G, et al. Multiparameter mapping of relaxation (R1, R2*), proton density and magnetization transfer saturation at 3 T: A multicenter dual-vendor reproducibility and repeatability study. Hum. Brain Mapp. 2020;41:4232–4247.
5. Rua C, Clarke WT, Driver ID, et al. Multi-centre, multi-vendor reproducibility of 7T QSM and R2* in the human brain: Results from the UK7T study. Neuroimage 2020;223:117358.
6. Layton KJ, Kroboth S, Jia F, et al. Pulseq: A rapid and hardware-independent pulse sequence prototyping framework. Magn. Reson. Med. 2017;77:1544–1552.
7. Wen J, Cross AH, Yablonskiy DA. On the role of physiological fluctuations in quantitative gradient echo MRI: implications for GEPCI, QSM, and SWI. Magn. Reson. Med. 2015;73:195–203.
8. Versluis MJ, Sutton BP, de Bruin PW, Börnert P, Webb AG, van Osch MJ. Retrospective image correction in the presence of nonlinear temporal magnetic field changes using multichannel navigator echoes. Magn. Reson. Med. 2012;68:1836–1845.
9. Tan Z, Unterberg-Buchwald C, Blumenthal M, et al. Free-Breathing Liver Fat, R_2^* and B_0 Field Mapping Using Multi-Echo Radial FLASH and Regularized Model-based Reconstruction. 2021 doi: 10.48550/arXiv.2101.02788.
10. Uecker M, Tamir JI, Ong F, Lustig M. The BART toolbox for computational Magnetic Resonance Imaging. http://wwwuser.gwdg.de/~muecker1/basp-uecker2.pdf. Accessed November 8, 2022.
11. Chan K-S, Marques JP. SEPIA—Susceptibility mapping pipeline tool for phase images. Neuroimage 2021;227:117611.
12. Lai K-W, Aggarwal M, van Zijl P, Li X, Sulam J. Learned Proximal Networks for Quantitative Susceptibility Mapping. Med. Image Comput. Comput. Assist. Interv. 2020;12262:125–135.
13. Veraart J, Novikov DS, Christiaens D, Ades-Aron B, Sijbers J, Fieremans E. Denoising of diffusion MRI using random matrix theory. Neuroimage 2016;142:394–406.
14. Bilgic B, Gagoski BA, Cauley SF, et al. Wave-CAIPI for highly accelerated 3D imaging. Magn. Reson. Med. 2015;73:2152–2162.
Figures