0396
Phantom Results of the ISMRM Joint RRSG–qMRSG Reproducibility Challenge on T1 mapping1NeuroPoly, Polytechnique Montreal, Montreal, QC, Canada, 2Montreal Heart Institute, Montreal, QC, Canada, 3Unité de Neuroimagerie Fonctionnelle (UNF), Centre de recherche de l’Institut Universitaire de Gériatrie de Montréal (CRIUGM), Montreal, QC, Canada, 4Medical Physics, Ingham Institute for Applied Medical Research, Liverpool, Australia, 5Department of Medical Physics, Liverpool and Macarthur Cancer Therapy Centres, Liverpool, Australia, 6Philips Research, Hamburg, Germany, 7Stanford University, Stanford, CA, United States, 8Department of Biomedical Engineering and Health Systems, KTH Royal Institute of Technology, Stockholm, Sweden, 9Department of Radiology, Stanford University, Stanford, CA, United States, 10Medical Physics Unit, McGill University, Montreal, QC, Canada, 11University of British Columbia, Vancouver, BC, Canada, 12Medical Imaging, McGill University Health Centre, Montreal, QC, Canada, 13MR Clinical Science, Philips Canada, Mississauga, ON, Canada, 14Department of Computer Science, University College London, London, United Kingdom, 15Lysholm Department of Neuroradiology, National Hospital for Neurology and Neurosurgery, University College London Hospitals NHS Foundation Trust, London, United Kingdom, 16Department of Biomedical Engineering, Case Western Reserve University, Cleveland, OH, United States, 17Department of Medical Radiation Sciences, Institute of Clinical Sciences, Sahlgrenska Academy, University of Gothenburg, Gothenburg, Sweden, 18Department of Medical Physics and Biomedical Engineering, Sahlgrenska University Hospital, Gothenburg, Sweden, 19Hôpital Maisonneuve-Rosemont, Montreal, QC, Canada, 20Department of Surgery & Cancer, Imperial College London, London, United Kingdom, 21Department of Biomedical Engineering, Viterbi School of Engineering, University of Southern California, Los Angeles, CA, United States, 22Philips GmbH Market DACH, Hamburg, Germany, 23Philips Healthcare Germany, Hamburg, Germany, 24CREATIS Laboratory, Univ. Lyon, UJM-Saint-Etienne, INSA, CNRS UMR 5520, INSERM, Lyon, France, 25Centre d'Imagerie Cérébrale, Douglas Mental Health University Institute, Montreal, QC, Canada, 26MRC, London Institute of Medical Sciences, Imperial College London., London, United Kingdom, 27Department of Radiation Oncology - CNS Service, The University of Texas MD Anderson Cancer Center, Houston, TX, United States, 28Department of Radiation Oncology, Henry Ford Cancer Institute, Detroit, MI, United States
Synopsis
Keywords: Quantitative Imaging, Relaxometry, Reproducibility, challenge
A collaborative reproducibility challenge was launched to explore if an imaging protocol independently-implemented at multiple centers can reliably measure T1 using inversion recovery in a standardized quantitative MRI phantom (ISMRM/NIST). A total of 19 submissions were accepted, totalling 41 phantom T1 mapping datasets. Errors relative to the temperature-corrected reference T1 values were under 10% for the range of values expected in the human brain in vivo. All submitted phantom data, code, pipelines, and scripts were shared on open platforms.Introduction
Quantitative MRI has a reproducibility problem. Even the most fundamental MR parameters such as T1, which has been mapped since the dawn of MRI (Pykett and Mansfield, 1978), still cannot be reliably measured in vivo across quantitative techniques or site-specific implementations (Stikov et al., 2015). Inversion recovery is the gold standard for T1 mapping (Barral et al., 2010), and although it is impractically slow for whole-organ imaging, it can be useful to evaluate the variability of T1 values across site-specific implementations. The 2020 ISMRM joint study group (Reproducible Research and Quantitative MR) reproducibility challenge posed the following question: will an imaging protocol independently-implemented at multiple centers reliably measure what is considered one of the fundamental MR parameters (T1) using the most robust technique (inversion recovery) in a standardized phantom (ISMRM/NIST system phantom)?Methods
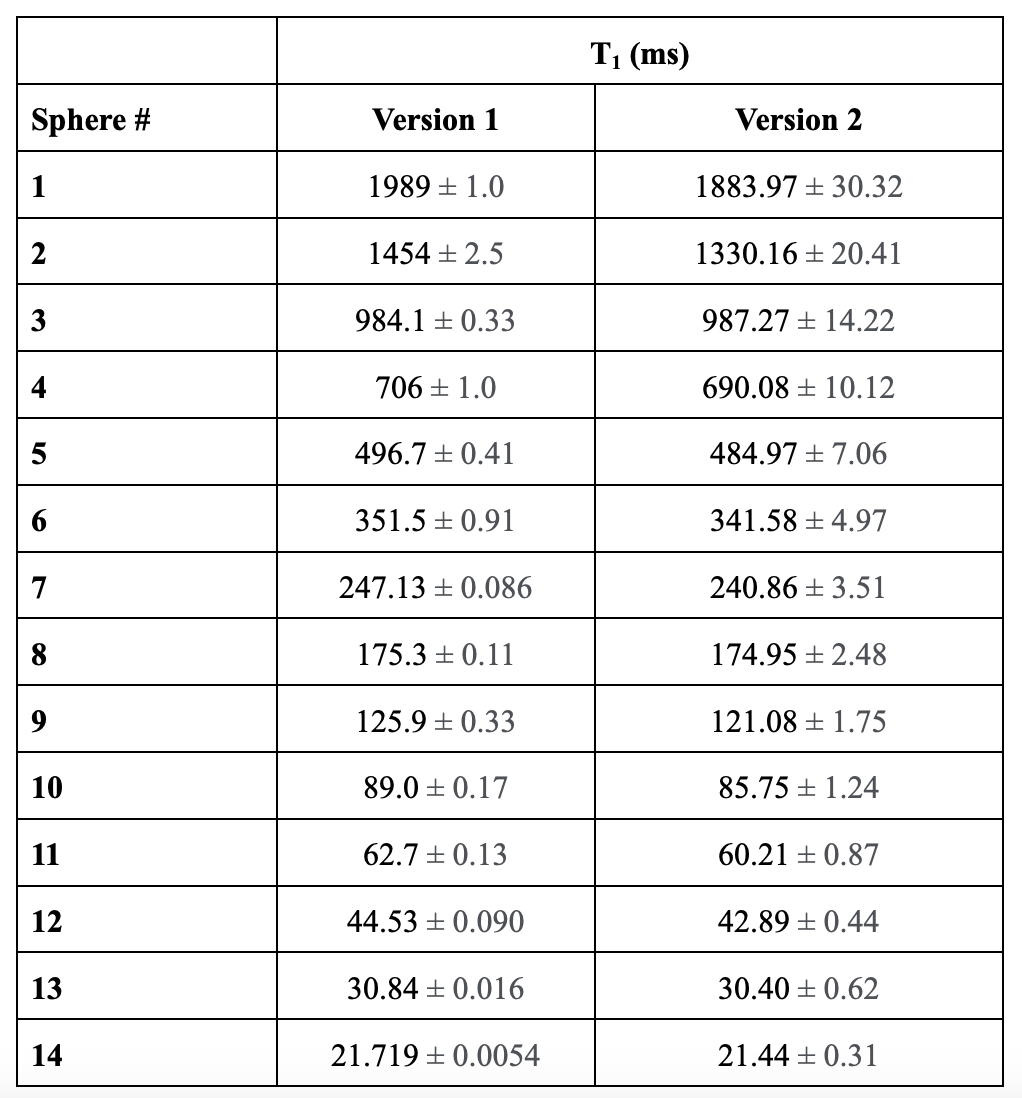
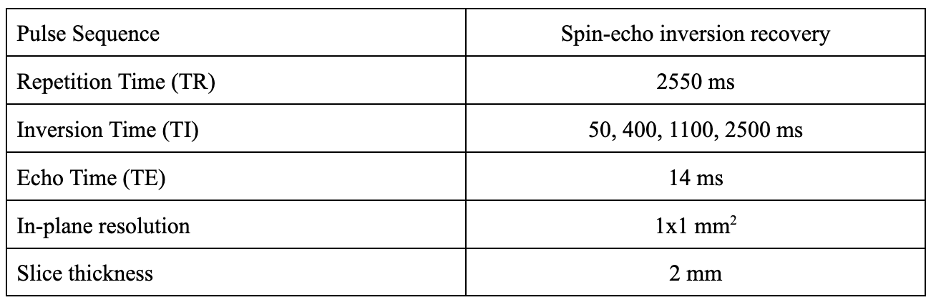
Submissions required a set of inversion recovery acquisitions of the ISMRM/NIST system phantom (Stupic et al., 2021) (Premium System Phantom, CaliberMRI, Boulder, Colorado), which has a T1 plate with 14 fiduciary spheres (see Figure 1 for reference values). Challenge participants were instructed to acquire data using the spin-echo inversion recovery protocol for T1 mapping as reported in (Barral et al., 2010), the details of which are listed in Figure 2. Note that the short repetition time (TR ~ T1) is possible because the T1 fitting model used in (Barral et al., 2010) does not make the conventional long TR assumption. Also, note that the four inversion times (TIs) from this publication were optimized for mapping brain T1 values. As the focus of this challenge was on reproducibility, the challenge design put emphasis on reproducible research practices by sharing the submitted data, code, pipelines, and scripts to reproduce figures. Data submissions for the challenge were handled through the GitHub issue tracking framework in a repository dedicated to this purpose (https://github.com/rrsg2020/data_submission). Each submission was reviewed by the challenge organizers to ensure guidelines were followed, and then datasets and YAML files containing additional details of the submissions were uploaded to OSF.io (https://osf.io/ywc9g/). T1 maps were generated using a pipeline (https://github.com/rrsg2020/t1_fitting_pipeline) using Barral’s original open-source code built into qMRLab (Karakuzu et al., 2020). ROI labels of each of the 14 T1 spheres were created using a numerical mask template created in MATLAB and shared by NIST. The diameters were reduced to be 60% of the expected sphere diameter in an effort to avoid edge effects in the ROIs. A pipeline to register the ROI labels to each submitted T1 map dataset was written using ANTs (Avants, Tustison and Song, 2009). The reference T1 values for the phantom were adjusted using the measured internal temperature of the phantoms as reported by the participants, prior to data plotting and analyses.Results
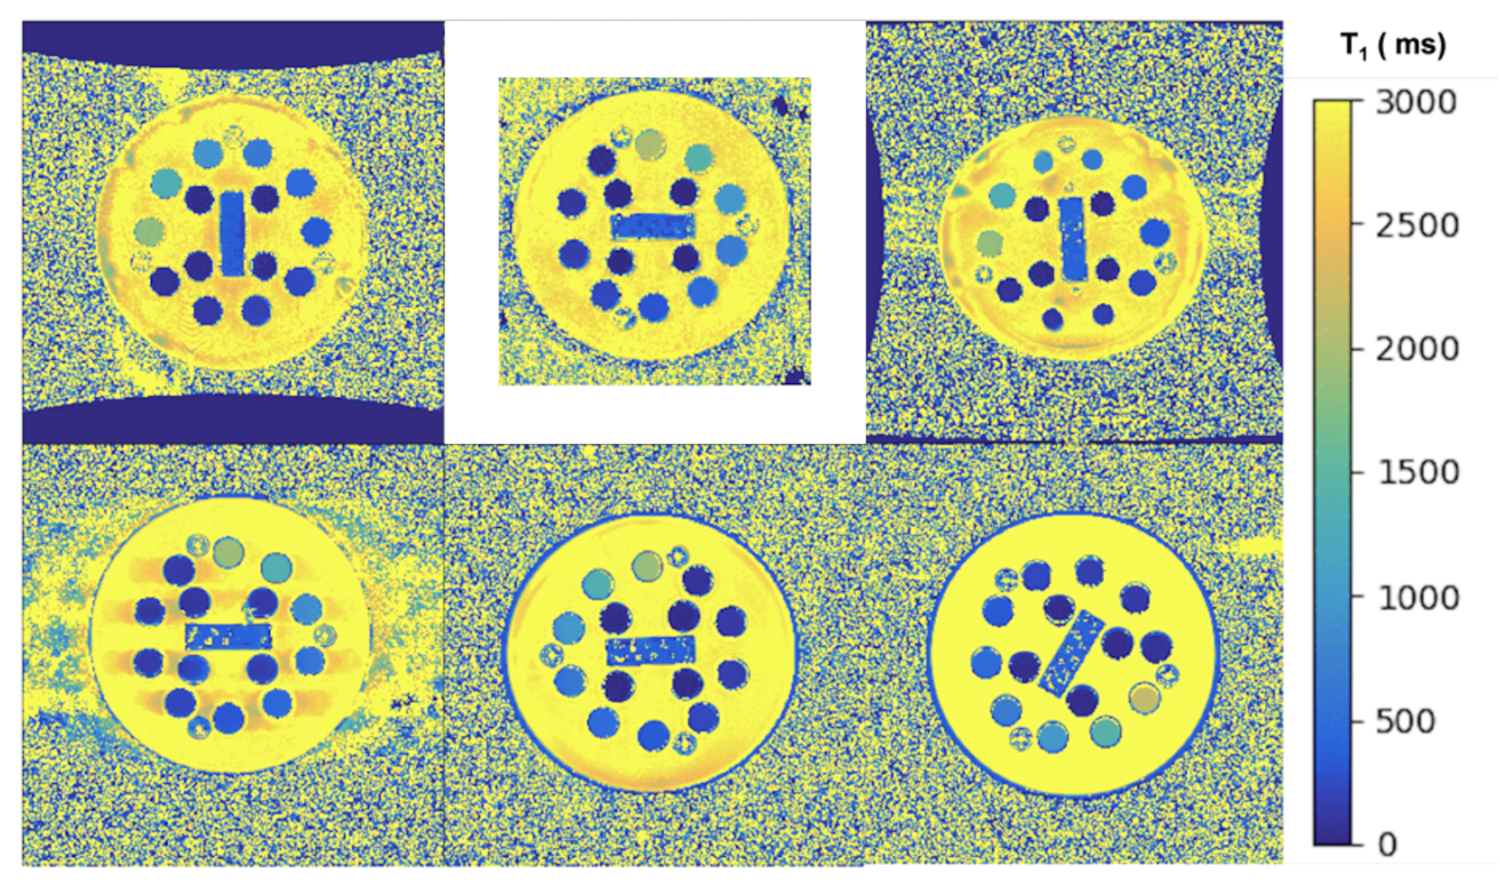
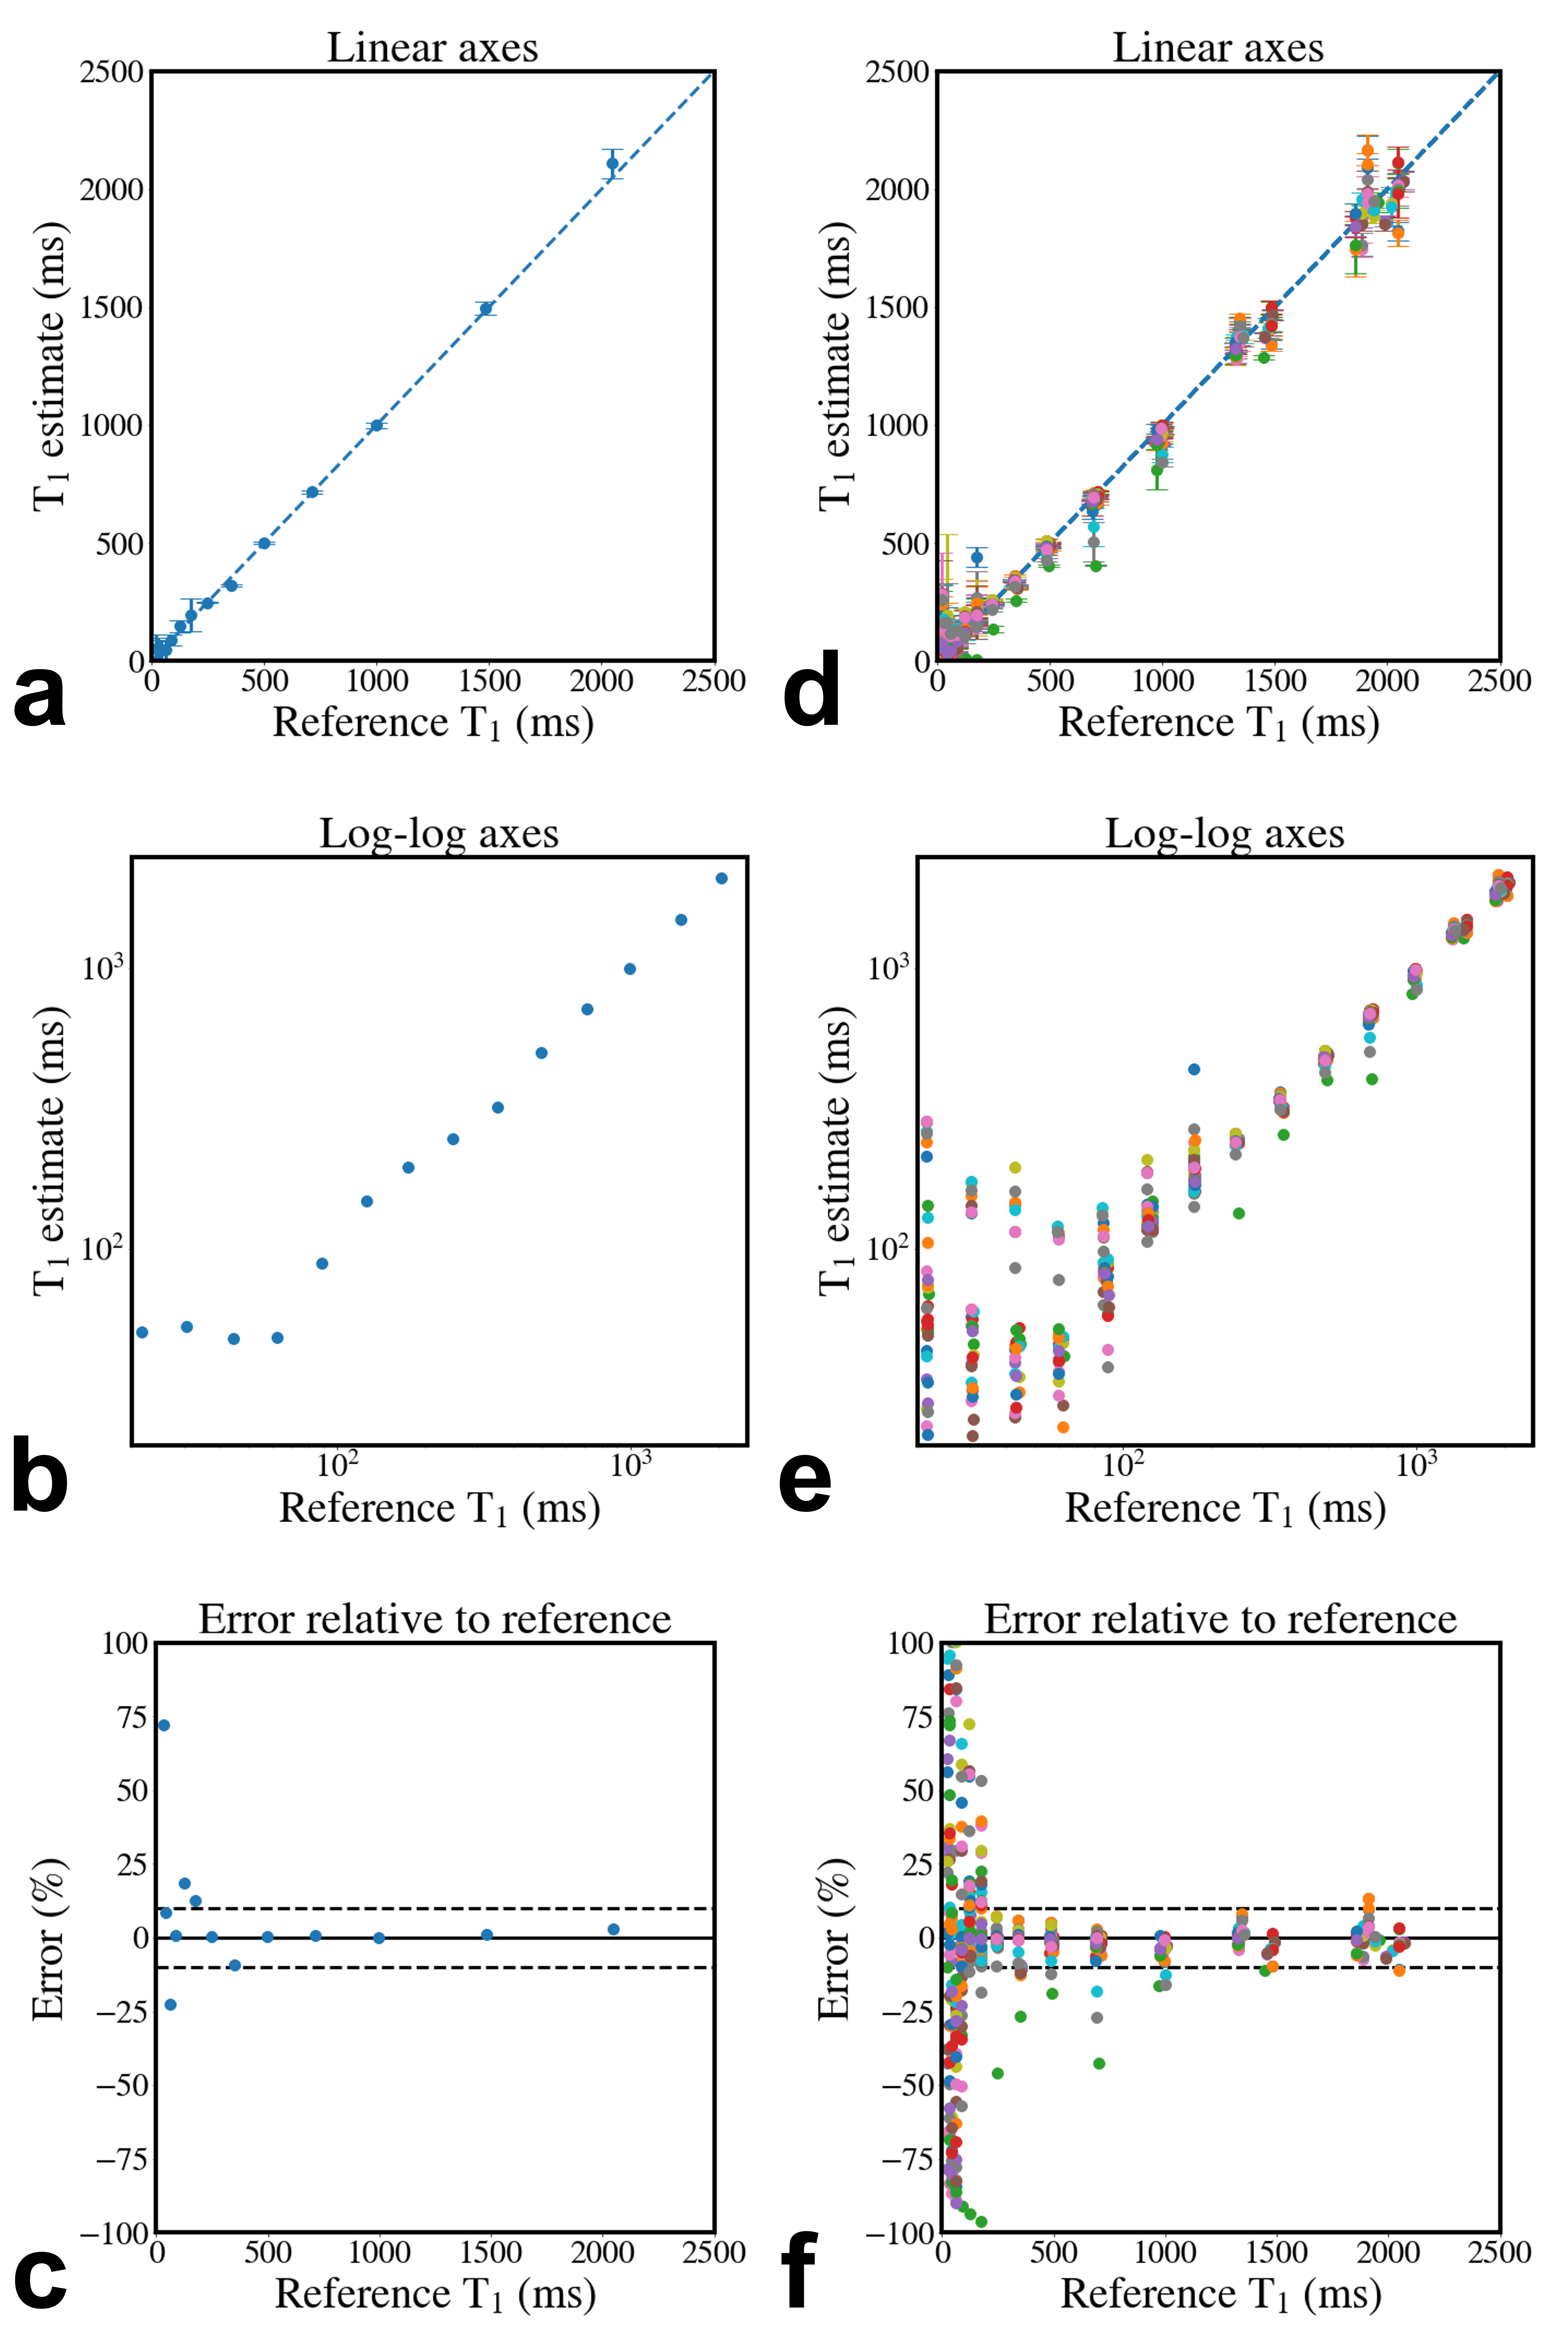
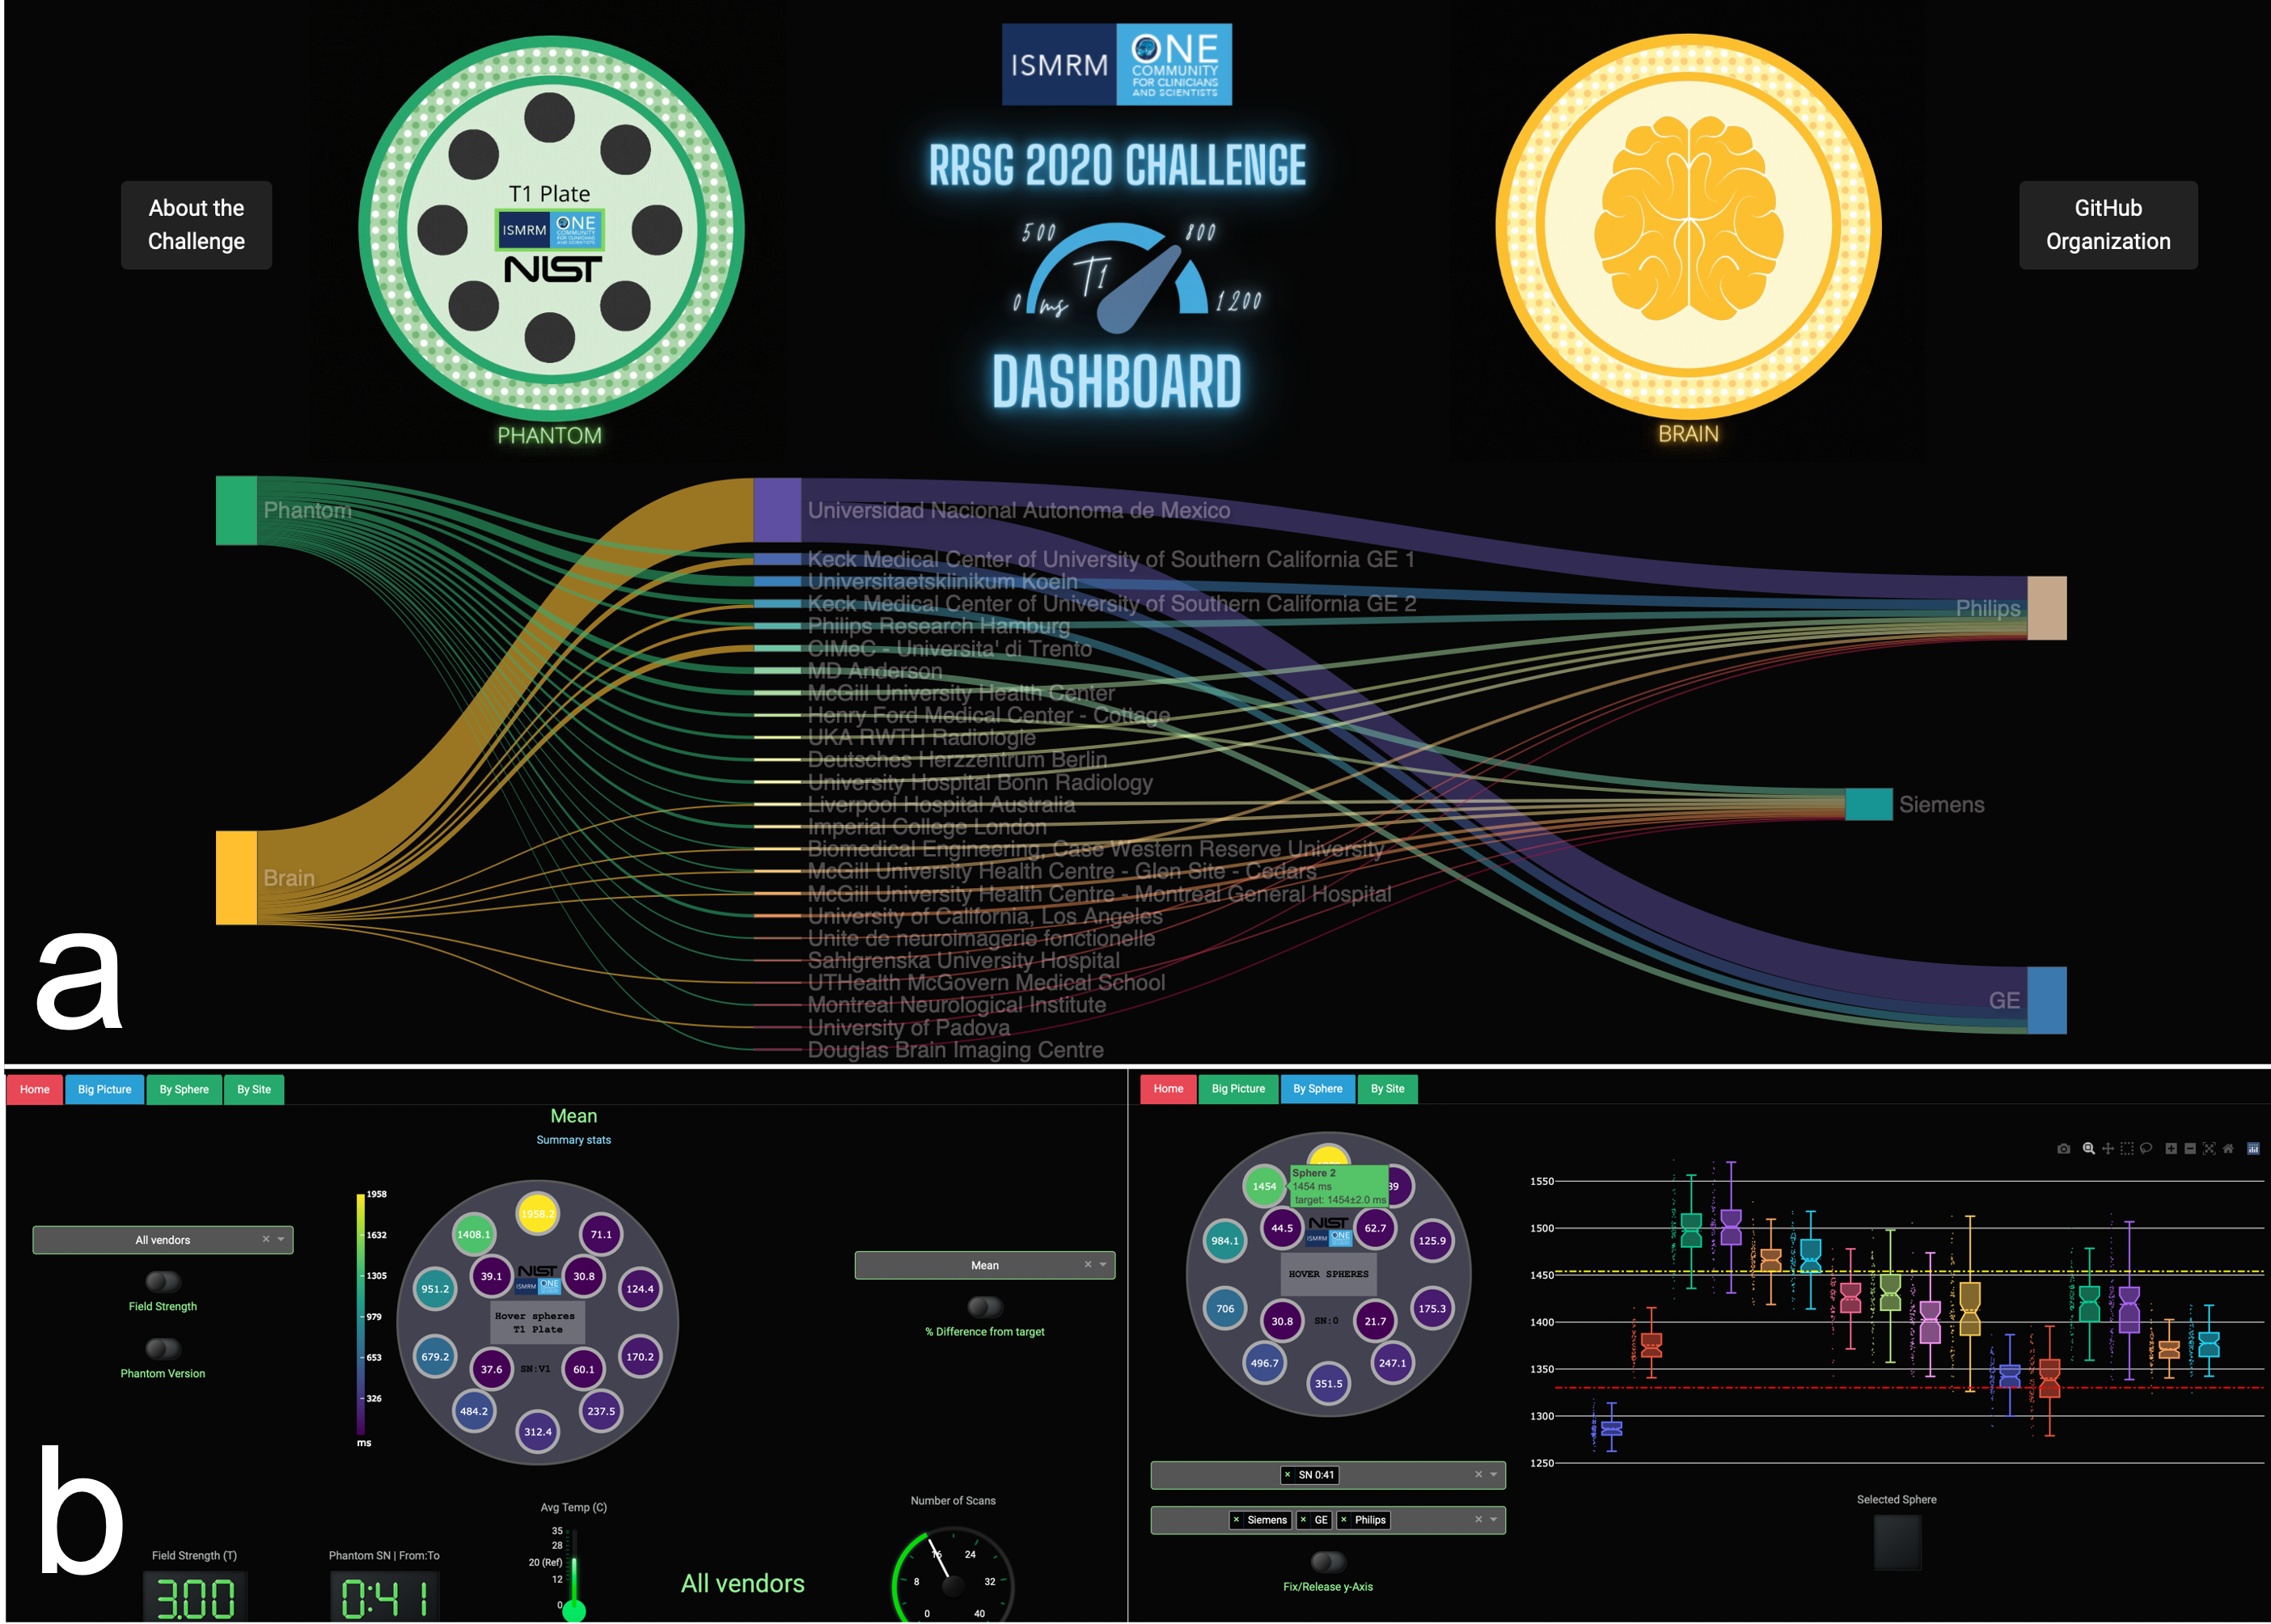
A total of 41 phantom T1 datasets were submitted and approved, collected at 20 imaging sites. All submitted datasets were acquired at 3 T except for one submission at 0.35 T, and they were all acquired on MRI systems from three major clinical vendors (GE, Philips, Siemens). Minor protocol deviations were reported across sites; in particular, the maximum TI wasn't always achievable (eg., 2400 instead of 2500 ms), and the bandwidth varied substantially (120 to 400 Hz/px). Figure 3 shows the variability in orientation, field-of-view, noise, distortions, and artefacts due to the different site-specific implementations by participants all of whom followed the same inversion recovery T1 mapping protocol (Figure 2). Figure 4 shows the mean T1 estimates relative to the reference T1 values for each sphere on a single representative submission (a,b,c) and all submissions (d,e,f). Each row represents the same data with different axes representations: linear (a,d), log-log (b,e), and error (%) relative to the reference (c,f). Overall, in the range of brain T1 values (500-2000ms) there is good agreement with small measurement error (within 10%) and only a few severe outliers (4 sites had data points with >10% error). For short T1 values (< 200 ms), the fit breaks down as expected due to the choice of inversion times; for these short relaxation times, near full signal relaxation occurs by the second inversion time (400 ms).In addition to sharing all the data, pipelines, and analysis notebooks, an interactive dashboard was developed to present a summary of the data and submission details (Figure 5). From this dashboard, we found that there was a mean intra-site coefficient of variation (CoV) of 2.4% across T1 values within the human range (spheres 1 to 5, 2000 ms to 500 ms) indicating low T1 variability within ROIs due to noise and other confounding imaging issues. The inter-site mean CoV for this range of T1 was 6%, which estimates the level of variability from the site-specific implementations of this protocol and technique.
Conclusions
This challenge reports on the level of variability of T1 values measured in a standard quantitative system phantom across site-specific protocol implementations of a gold standard quantitative technique. With the goal of promoting reproducible research, all collected data, processing pipeline code, computational environment files, and analysis scripts were shared. Future work could compare these results with other multi-center studies that used this phantom to quantify T1 mapping stability (Bane et al., 2018; Keenan et al., 2021).Acknowledgements
We thank the Reproducible Research and Quantitative MR ISMRM study group committees for their roles in organizing this initiative. Thank you to Joëlle Barral, Paul Tofts, Ilana Leppert, Tommy Boshkovski, Kiril Zelenkovski, and Filip Velkov for their valuable insights and discussions during the planning stages of this challenge. Special thanks to Kathryn Keenan, Zydrunas Gimbutas, and Andrew Dienstfrey from the National Institute of Standards and Technology for their valuable insights and for sharing their numerical ISMRM/NIST phantom ROI template.References
Avants, Tustison and Song (2009) ‘Advanced normalization tools (ANTS)’, The Insight Journal [Preprint]. Available at: https://scicomp.ethz.ch/public/manual/ants/2.x/ants2.pdf.
Bane, O. et al. (2018) ‘Accuracy, repeatability, and interplatform reproducibility of T1 quantification methods used for DCE-MRI: Results from a multicenter phantom study’, Magnetic Resonance in Medicine, 79(5), pp. 2564–2575.
Barral, J.K. et al. (2010) ‘A robust methodology for in vivo T1 mapping’, Magnetic Resonance in Medicine, 64(4), pp. 1057–1067.
Karakuzu, A. et al. (2020) ‘qMRLab: Quantitative MRI analysis, under one umbrella’, Journal of Open Source Software (JOSS), 5(53), p. 2343.
Keenan, K.E. et al. (2021) ‘Multi-site, multi-platform comparison of MRI T1 measurement using the system phantom’, PLOS One, 16(6), p. e0252966.
Pykett, I.L. and Mansfield, P. (1978) ‘A line scan image study of a tumorous rat leg by NMR’, Physics in Medicine and Biology, 23(5), pp. 961–967.
Stikov, N. et al. (2015) ‘On the accuracy of T1 mapping: Searching for common ground’, Magnetic Resonance in Medicine, 73(2), pp. 514–522.
Stupic, K.F. et al. (2021) ‘A standard system phantom for magnetic resonance imaging’, Magnetic Resonance in Medicine, 86(3), pp. 1194–1211.
Figures