0394
Single breath-hold full abdominal T1 mapping using a CNN based short inversion-recovery sampling technique
Eze Ahanonu1, Ute Goerke2, Kevin Johnson3, Brian Toner4, Diego Martin5, Vibhas Deshpande6, Ali Bilgin1,3,7, and Maria Altbach3,7
1Department of Electrical and Computer Engineering, The University of Arizona, Tucson, AZ, United States, 2Siemens Healthineers, Tucson, AZ, United States, 3Department of Medical Imaging, The University of Arizona, Tucson, AZ, United States, 4Applied Math Program, The University of Arizona, Tucson, AZ, United States, 5Department of Radiology, Houston Methodist Hospital, Houston, TX, United States, 6Siemens Healthineers, Austin, TX, United States, 7Department of Biomedical Engineering, The University of Arizona, Tucson, AZ, United States
1Department of Electrical and Computer Engineering, The University of Arizona, Tucson, AZ, United States, 2Siemens Healthineers, Tucson, AZ, United States, 3Department of Medical Imaging, The University of Arizona, Tucson, AZ, United States, 4Applied Math Program, The University of Arizona, Tucson, AZ, United States, 5Department of Radiology, Houston Methodist Hospital, Houston, TX, United States, 6Siemens Healthineers, Austin, TX, United States, 7Department of Biomedical Engineering, The University of Arizona, Tucson, AZ, United States
Synopsis
Keywords: Machine Learning/Artificial Intelligence, Quantitative Imaging
Comprehensive liver evaluation with T1 mapping requires full abdominal coverage with sufficiently high spatial resolution for detection of pathology. Existing methods for abdominal T1 mapping are only able to achieve partial coverage, primarily limited by the breath hold and the time required to sample the T1 recovery curve (T1RC) for accurate T1 estimation. We present a radial Look-Locker T1 mapping framework which utilizes short T1RC sampling combined with deep learning based T1 estimation to achieve full abdominal coverage within a single 20s breath hold period.Introduction
T1 mapping allows for quantitative tissue evaluation to assist in the diagnosis of diseases.1,2 Traditional T1 mapping is performed using a Cartesian MOLLI sequence, which only allows acquisition of 1-2 slices within a 20s breath hold period (BHP). Recently, a radial Look-Locker (LL) technique was proposed which demonstrates improved slice efficiency for acquisition of up to 11 slices within a BHP.3 Unfortunately, this only provides partial coverage of the abdomen. The goal of this work is to enable full abdominal coverage within a single BHP. This is achieved by performing short sampling of the T1 recovery curve (T1RC), followed by convolutional neural network (CNN) T1 estimation.Methods
Technique: A 2D radial LL T1 mapping technique was implemented (Figure 1). A baseline sequence (Figure 1A) utilizing long sampling of the T1RC is used to acquire reference and training data for the CNN. Here, radial views are divided into 16-view groups to produce $$$N$$$ TI groups ($$$K_1,…,K_N$$$). These are used in a locally low rank (LLR)4 reconstruction to obtain the corresponding TI images ($$$I_1,…,I_N$$$). Single pixel fitting (SPF) using a non-linear least squares method is used to generate T1 maps.The accelerated sequence (Figure 1B) employs shortened sampling of the T1RC to improve slice efficiency. This results in fewer radial views being acquired thus, grouping of views yields $$$\hat{N}<N$$$ TI groups ($$$K_1,…,K_\hat{N}$$$). LLR reconstruction is used to obtain a reduced set of TI images ($$$\hat{I_1},...,\hat{I_\hat{N}}$$$).
To overcome T1 estimation error due to reduced signal quality from the short T1RC, a supervised CNN model is trained to estimate T1 maps directly from the reduced set of TI images. The $$$N$$$ TI groups obtained from the long T1RC data, acquired using the baseline LL sequence, are used to obtain the T1 maps used as the CNN labels. The number of views within the long T1RC dataset is then retrospectively truncated to produce a dataset with $$$\hat{N}<N$$$ TI groups. This simulates data acquired through shortened sampling of the T1RC. The TI images reconstructed from the truncated dataset serve as the CNN input. For testing, we used short T1RC data prospectively acquired with the accelerated LL sequence to obtain $$$\hat{N}$$$ TI images. These are given to the pre-trained network to generate a T1 map estimate.
In vivo imaging: Data were acquired at 3T (MAGNETOM Skyra, Siemens) with TR=3.3ms, TE=1.75ms, $$$\alpha$$$=10° and pixel-resolution=1.56 x 1.56 x 8mm. Training data: Data from 20 subjects were acquired with 21 slices per subject over 3 breath-holds using the baseline LL sequence. T1RC was 2.5s and consisted of 768 radial views. The dataset was retrospectively truncated to 576, 512, 304, 256, 192 and 128 views to simulate datasets at T1RC lengths of 1.9s, 1.69s, 1.0s, 0.84s, 0.63s and 0.42s, respectively. A separate CNN was trained using each dataset. Testing Data: Data from 5 subjects were acquired with the accelerated LL sequence. The T1RC=0.84s (256 radial views) yielded 21 slices within a single 20s BHP. An optimized slice interleaving scheme5 was used to reduce T1 saturation. Reference data for each subject were acquired using the training data protocol (T1RC=2.5s).
Results and Discussion
Figure 3A demonstrates the impact of T1RC length on T1 estimation. Here the various T1RC lengths were generated by retrospectively cutting the reference 2.5s curve. We used (i) conventional SPF to fit the TI images and (ii) CNN to estimate T1 maps directly from the network. SPF achieved T1 estimation error below 5% (4.0%) in liver for T1RC=1.69s but exceeds 5% for muscle (6.0%) and spleen (7.4%) even for T1RC=1.9s. On the other hand, CNN T1 estimation error remained below 5% across liver (3.8%), muscle (3.4%) and spleen (4.6%) down to T1RC=0.84s. Qualitative evaluation (Figure 3B) demonstrates the superior quality of CNN generated T1 maps across T1RC length.Based on the above result, a single BHP accelerated acquisition protocol was developed using T1RC=0.84s combined with optimized slice interleaving to allow acquisition of 21 slices with 8mm slice thickness. This protocol provided full abdominal coverage (168mm) with excellent spatial resolution (1.56x1.56x8mm). Figure 4A demonstrates the consistency in estimated T1 across liver (674 ± 15.9ms), muscle (1115 ± 22.1ms) and spleen (1174 ± 23.4ms) for a single subject, indicating no T1 saturation due to the advanced slice interleaving scheme used. Further validation can be seen by qualitative evaluation of the T1 maps obtained from the acquired slices (Figure 4B).
Figure 5 shows correlation and Bland-Altman analysis for SPF and CNN T1 estimates for data acquired on 5 subjects using the single BHP protocol. Systematic over estimation of T1 is observed for SPF, with an average T1 error of 10.2%/20.7%/16.5% across liver/muscle/spleen, respectively, with a coefficient of variation of 11%. The CNN achieved significant improvements, with average T1 error of 0.9%/1.4%/4.3% across liver/muscle/spleen, respectively, and a coefficient of variation of 2.7%.
Conclusions
An accelerated T1 mapping framework was developed which allows for full abdominal coverage within a single BHP. This technique should allow improved efficiency in clinical applications of T1 mapping compared to the current standard.Acknowledgements
Work supported by NIH (CA245920 and EB031894), Arizona Biomedical Research Centre (CTR056039), and the Technology and Research Initiative Fund (TRIF) Improving Health Initiative.
References
1. Kim JW, Lee YS, Park YS, Kim BH, Lee SY, Yeon JE, Lee CH. Multiparametric MR Index for the Diagnosis of Non-Alcoholic Steatohepatitis in Patients with Non-Alcoholic Fatty Liver Disease. Sci Rep. 2020;10(1):2671.2. Huang Y, Sadowski EA, Artz NS, et al. Measurement and comparison of T1 relaxation times in native and transplanted kidney cortex and medulla. J Magn Reson Imaging. 2011;33:1241-1247.
3. Goerke U, Ahanonu E, Keerthivasan M, Bilgin A, Deshpande V, Altbach MI, Inversion Recovery Look-Locker T1-Mapping for Abdominal Imaging: How Many Slices Can One Fit in a Single Breath-Hold? Proceedings of Annual Meeting of the ISMRM, 30:107, 2022.
4. https://mrirecon.github.io/bart/
5. Li Z, Bilgin A, Johnson K, Galons JP, Martin DR, and Altbach MI, Rapid high-resolution T1 mapping using highly accelerated radial steady-state free-precession acquisition, J Magn Reson Imaging, 2019 Jan;49(1):239-252. doi: 10.1002/jmri.26170. Epub 2018 Aug 24. PMID: 30142230.
Figures
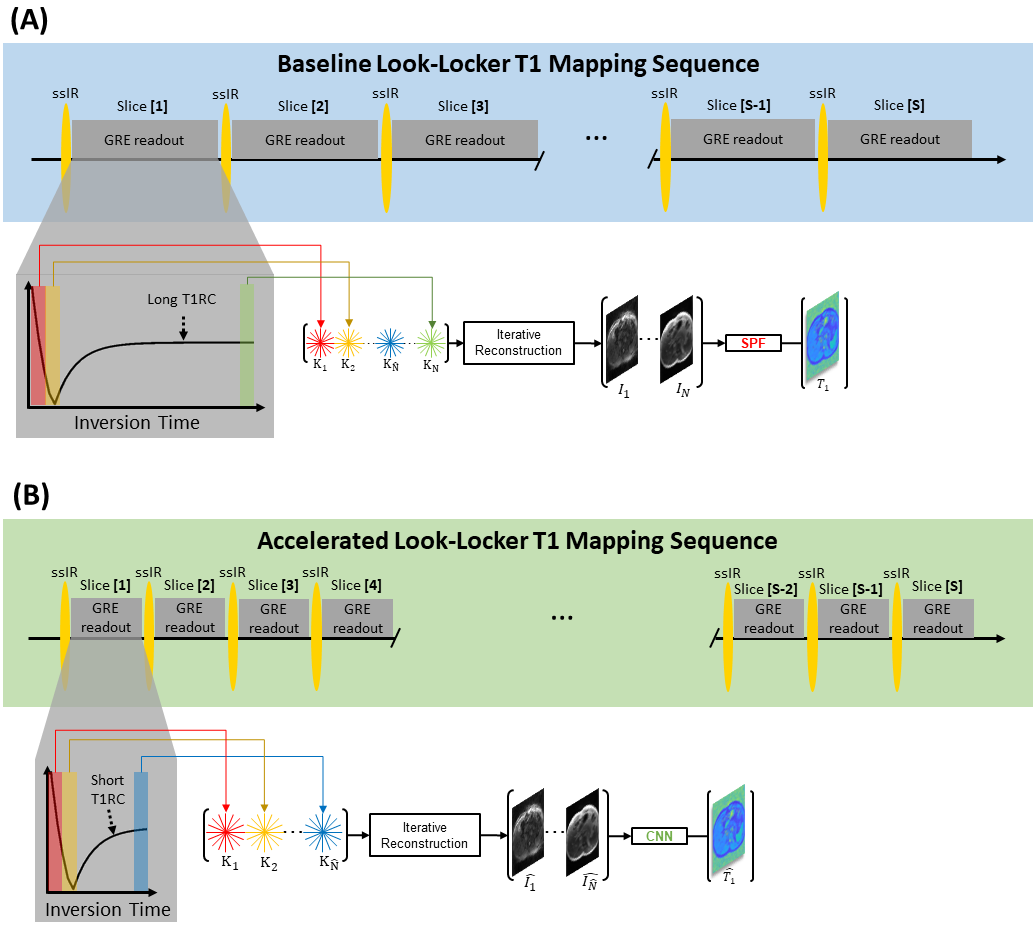
Figure 1. Diagrams of the 2D radial LL T1 mapping technique with slice-selective inversion (ssIR). (A) Baseline T1 mapping framework utilizing long T1RC sampling paired with single pixel fitting (SPF). (B) Accelerated T1 mapping framework utilizing short T1RC sampling combined with convolutional neural network (CNN) based T1 estimation.
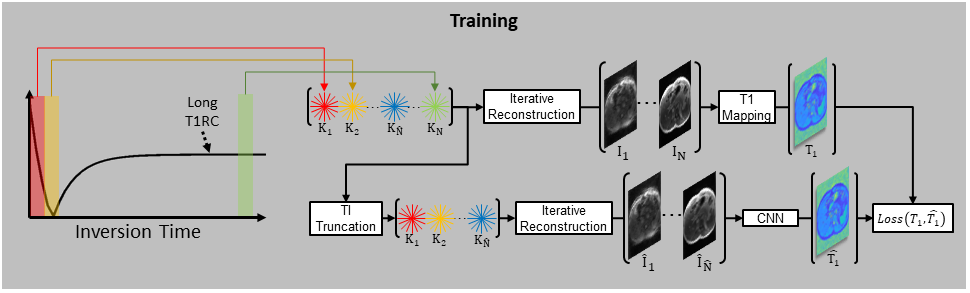
Figure 2. CNN training framework. k-space views acquired with a long T1RC are split into $$$N$$$ TI groups ($$$K_1,…,K_N$$$), and the resulting TI images ($$$I_1,…,I_N$$$) used to compute a reference T1 map. Views are then truncated to produce a short T1RC dataset ($$$K_1,…,K_\hat{N}$$$), which is used to produce a truncated image set ($$$\hat{I_1},…,\hat{I_\hat{N}})$$$). A CNN is then trained to estimate $$$T_1$$$ given the truncated image set.
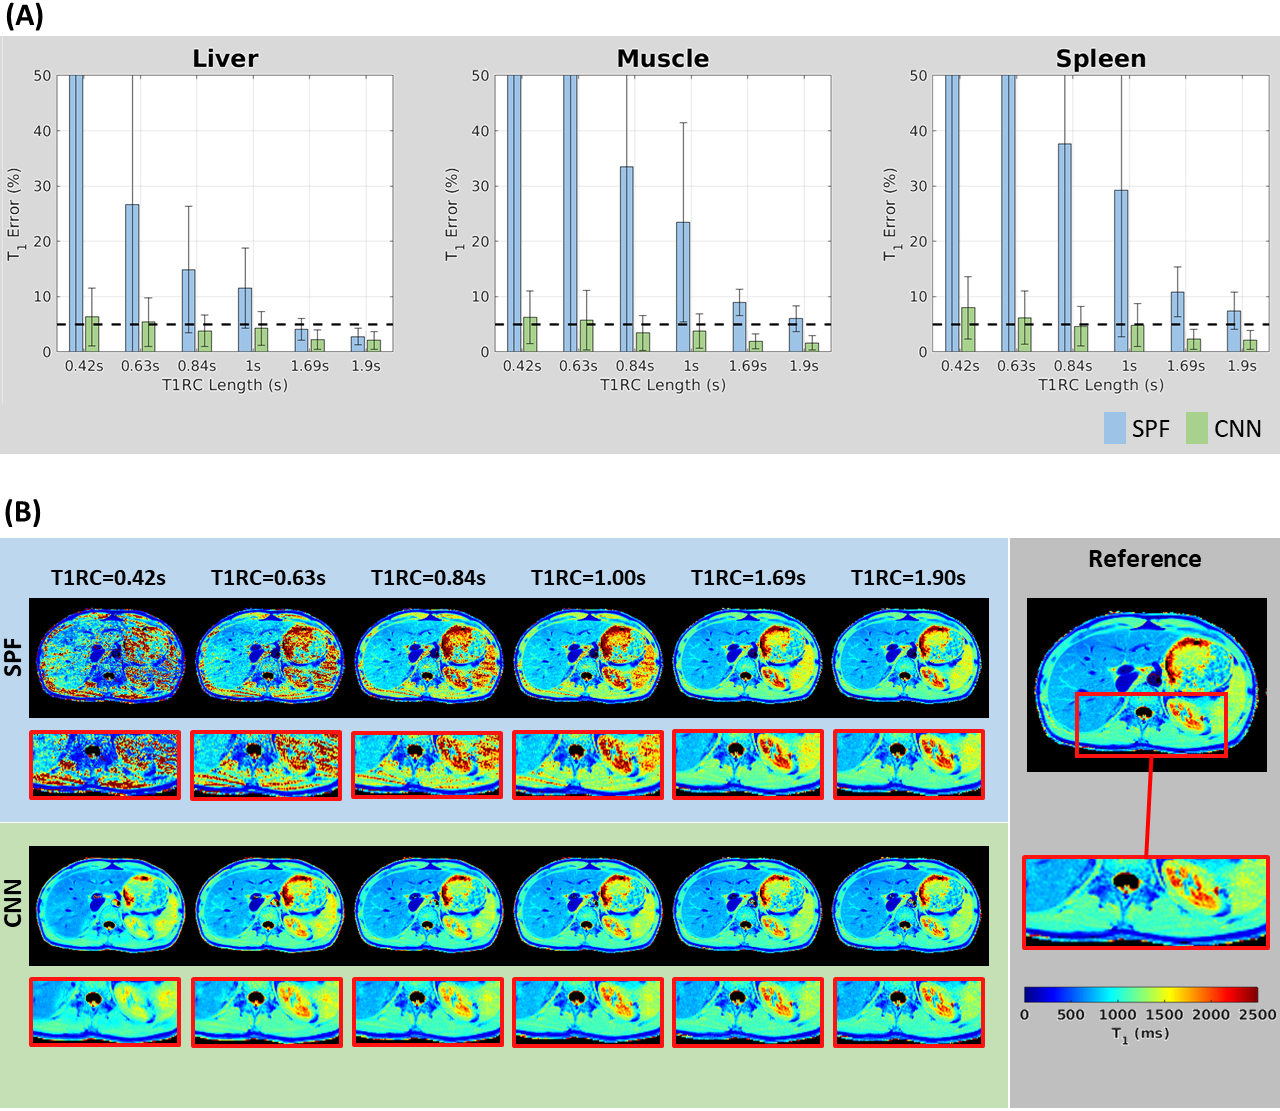
Figure 3. (A) T1 estimation error across T1RC lengths within liver, muscle and spleen when using SPF (blue) and CNN (green). Reference T1 values are obtained using SPF with a 2.5s T1RC. (B) Visual demonstration of T1 mapping quality for SPF and CNN across the range of T1RC lengths, with the zoomed-in ROI giving detail of liver, muscle, kidney and spleen regions.
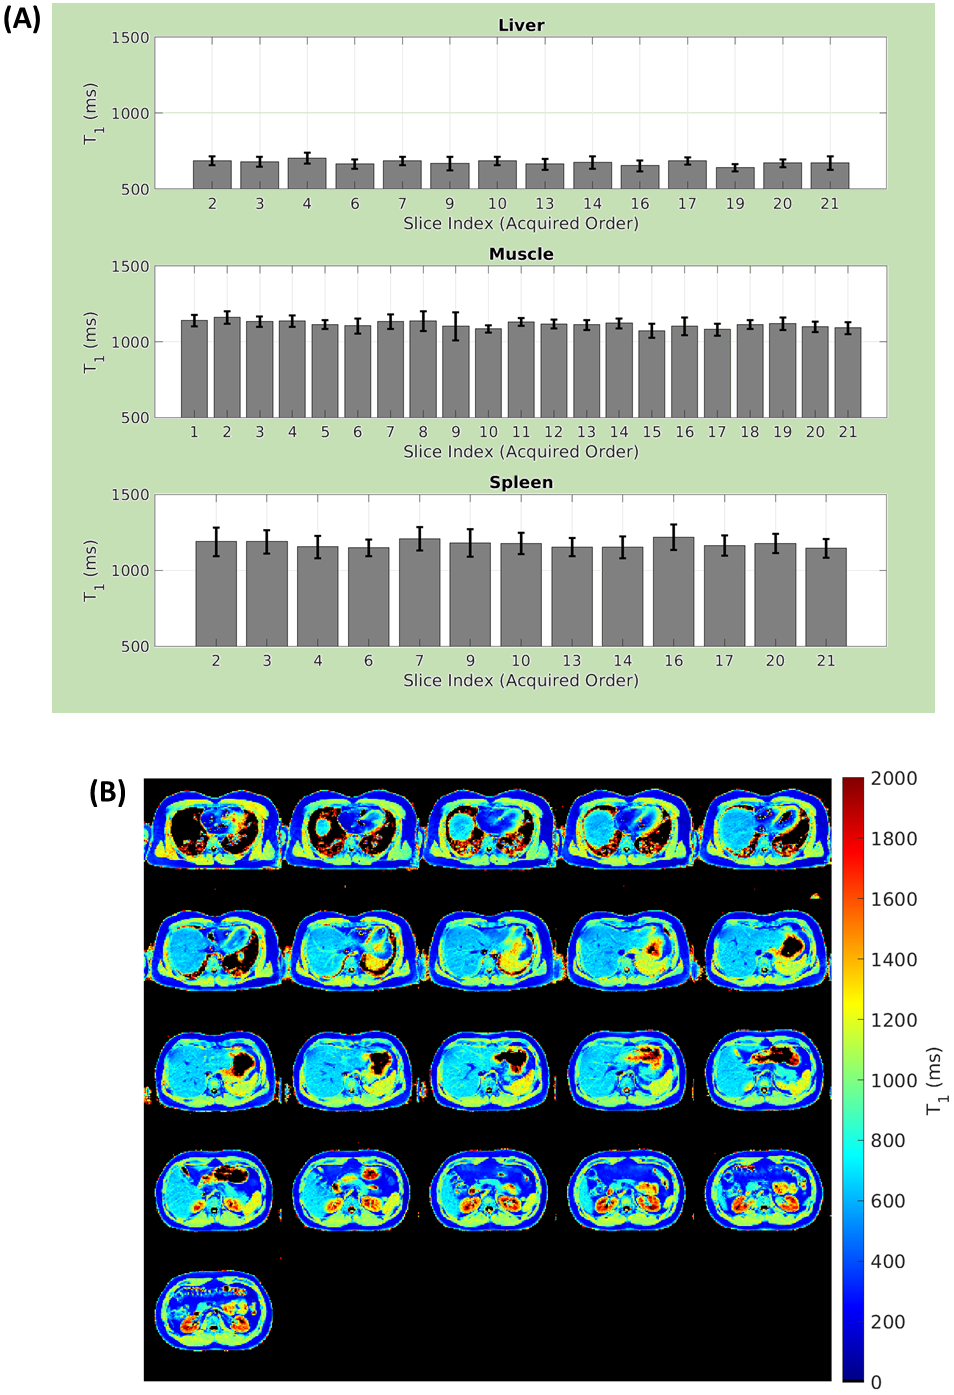
Figure 4. (A) Estimated T1 values across the acquired slices for ROIs in liver, muscle and spleen. Slice indices provide the acquired slice order, and slices for which no ROI was available are omitted. (B) CNN generated T1 maps obtained from data acquired with single breath hold acquisition using a 0.84s T1RC. Slices are displayed in anatomical order.
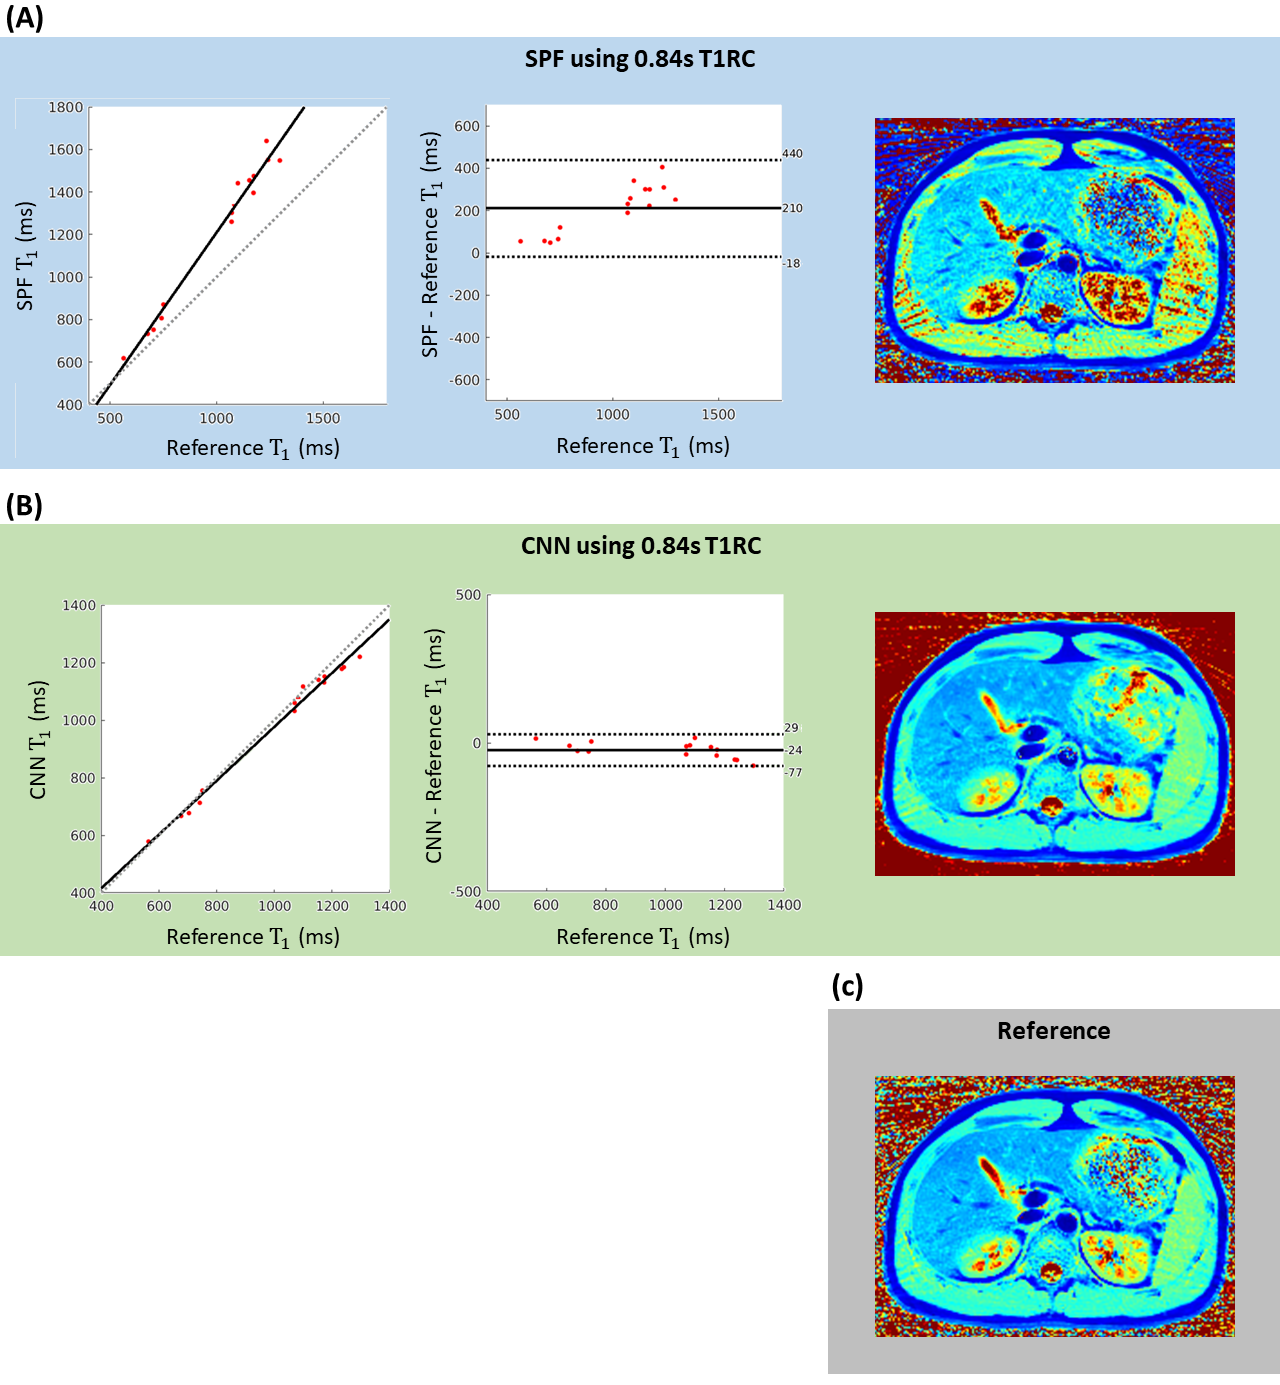
Figure 5. Correlation and Bland-Altman plots comparing T1 values obtained by (A) SPF and (B) CNN from single breath hold acquisition using a 0.84s T1RC, to reference values obtained from SPF from a reference scan using a 2.5s T1RC. Data are acquired from 5 subjects, and ROIs are taken from liver, muscle and spleen. A qualitative example is provided for each method, along with the reference scan, to demonstrate the superior quality of the CNN generated T1 maps.
DOI: https://doi.org/10.58530/2023/0394